
|
|||||
|
 | |
| |
| |
| |
| |
| |
|
Gene: LRRFIP2 |
Gene summary for LRRFIP2 |
| Gene information | Species | Human | Gene symbol | LRRFIP2 | Gene ID | 9209 |
| Gene name | LRR binding FLII interacting protein 2 | |
| Gene Alias | HUFI-2 | |
| Cytomap | 3p22.2 | |
| Gene Type | protein-coding | GO ID | GO:0006139 | UniProtAcc | Q9Y608 |
Top |
Malignant transformation analysis |
| Identification of the aberrant gene expression in precancerous and cancerous lesions by comparing the gene expression of stem-like cells in diseased tissues with normal stem cells |
| Entrez ID | Symbol | Replicates | Species | Organ | Tissue | Adj P-value | Log2FC | Malignancy |
| 9209 | LRRFIP2 | CA_HPV_3 | Human | Cervix | CC | 3.20e-04 | 1.60e-01 | 0.0414 |
| 9209 | LRRFIP2 | CCI_2 | Human | Cervix | CC | 8.87e-09 | 1.29e+00 | 0.5249 |
| 9209 | LRRFIP2 | CCI_3 | Human | Cervix | CC | 8.92e-07 | 7.77e-01 | 0.516 |
| 9209 | LRRFIP2 | HTA11_3410_2000001011 | Human | Colorectum | AD | 6.80e-25 | -7.29e-01 | 0.0155 |
| 9209 | LRRFIP2 | HTA11_2951_2000001011 | Human | Colorectum | AD | 3.66e-04 | -7.90e-01 | 0.0216 |
| 9209 | LRRFIP2 | HTA11_347_2000001011 | Human | Colorectum | AD | 7.41e-22 | 8.50e-01 | -0.1954 |
| 9209 | LRRFIP2 | HTA11_411_2000001011 | Human | Colorectum | SER | 4.03e-05 | 6.35e-01 | -0.2602 |
| 9209 | LRRFIP2 | HTA11_2112_2000001011 | Human | Colorectum | SER | 1.89e-02 | 2.19e-01 | -0.2196 |
| 9209 | LRRFIP2 | HTA11_3361_2000001011 | Human | Colorectum | AD | 9.09e-03 | -5.18e-01 | -0.1207 |
| 9209 | LRRFIP2 | HTA11_866_3004761011 | Human | Colorectum | AD | 1.67e-13 | -7.05e-01 | 0.096 |
| 9209 | LRRFIP2 | HTA11_9408_2000001011 | Human | Colorectum | AD | 1.35e-03 | -5.92e-01 | 0.0451 |
| 9209 | LRRFIP2 | HTA11_8622_2000001021 | Human | Colorectum | SER | 1.32e-03 | -7.30e-01 | 0.0528 |
| 9209 | LRRFIP2 | HTA11_10711_2000001011 | Human | Colorectum | AD | 1.28e-11 | -6.53e-01 | 0.0338 |
| 9209 | LRRFIP2 | HTA11_7696_3000711011 | Human | Colorectum | AD | 2.95e-21 | -6.54e-01 | 0.0674 |
| 9209 | LRRFIP2 | HTA11_6818_2000001021 | Human | Colorectum | AD | 2.60e-14 | -8.18e-01 | 0.0588 |
| 9209 | LRRFIP2 | HTA11_99999970781_79442 | Human | Colorectum | MSS | 5.98e-19 | -6.06e-01 | 0.294 |
| 9209 | LRRFIP2 | HTA11_99999973899_84307 | Human | Colorectum | MSS | 3.53e-07 | -7.70e-01 | 0.2585 |
| 9209 | LRRFIP2 | HTA11_99999974143_84620 | Human | Colorectum | MSS | 1.73e-44 | -9.69e-01 | 0.3005 |
| 9209 | LRRFIP2 | F007 | Human | Colorectum | FAP | 3.35e-15 | -8.02e-01 | 0.1176 |
| 9209 | LRRFIP2 | A002-C-010 | Human | Colorectum | FAP | 1.03e-05 | -4.41e-01 | 0.242 |
| Page: 1 2 3 4 5 6 7 8 9 10 11 |
| Tissue | Expression Dynamics | Abbreviation |
| Cervix |  | CC: Cervix cancer |
| HSIL_HPV: HPV-infected high-grade squamous intraepithelial lesions | ||
| N_HPV: HPV-infected normal cervix | ||
| Colorectum (GSE201348) |  | FAP: Familial adenomatous polyposis |
| CRC: Colorectal cancer | ||
| Colorectum (HTA11) |  | AD: Adenomas |
| SER: Sessile serrated lesions | ||
| MSI-H: Microsatellite-high colorectal cancer | ||
| MSS: Microsatellite stable colorectal cancer | ||
| Esophagus | 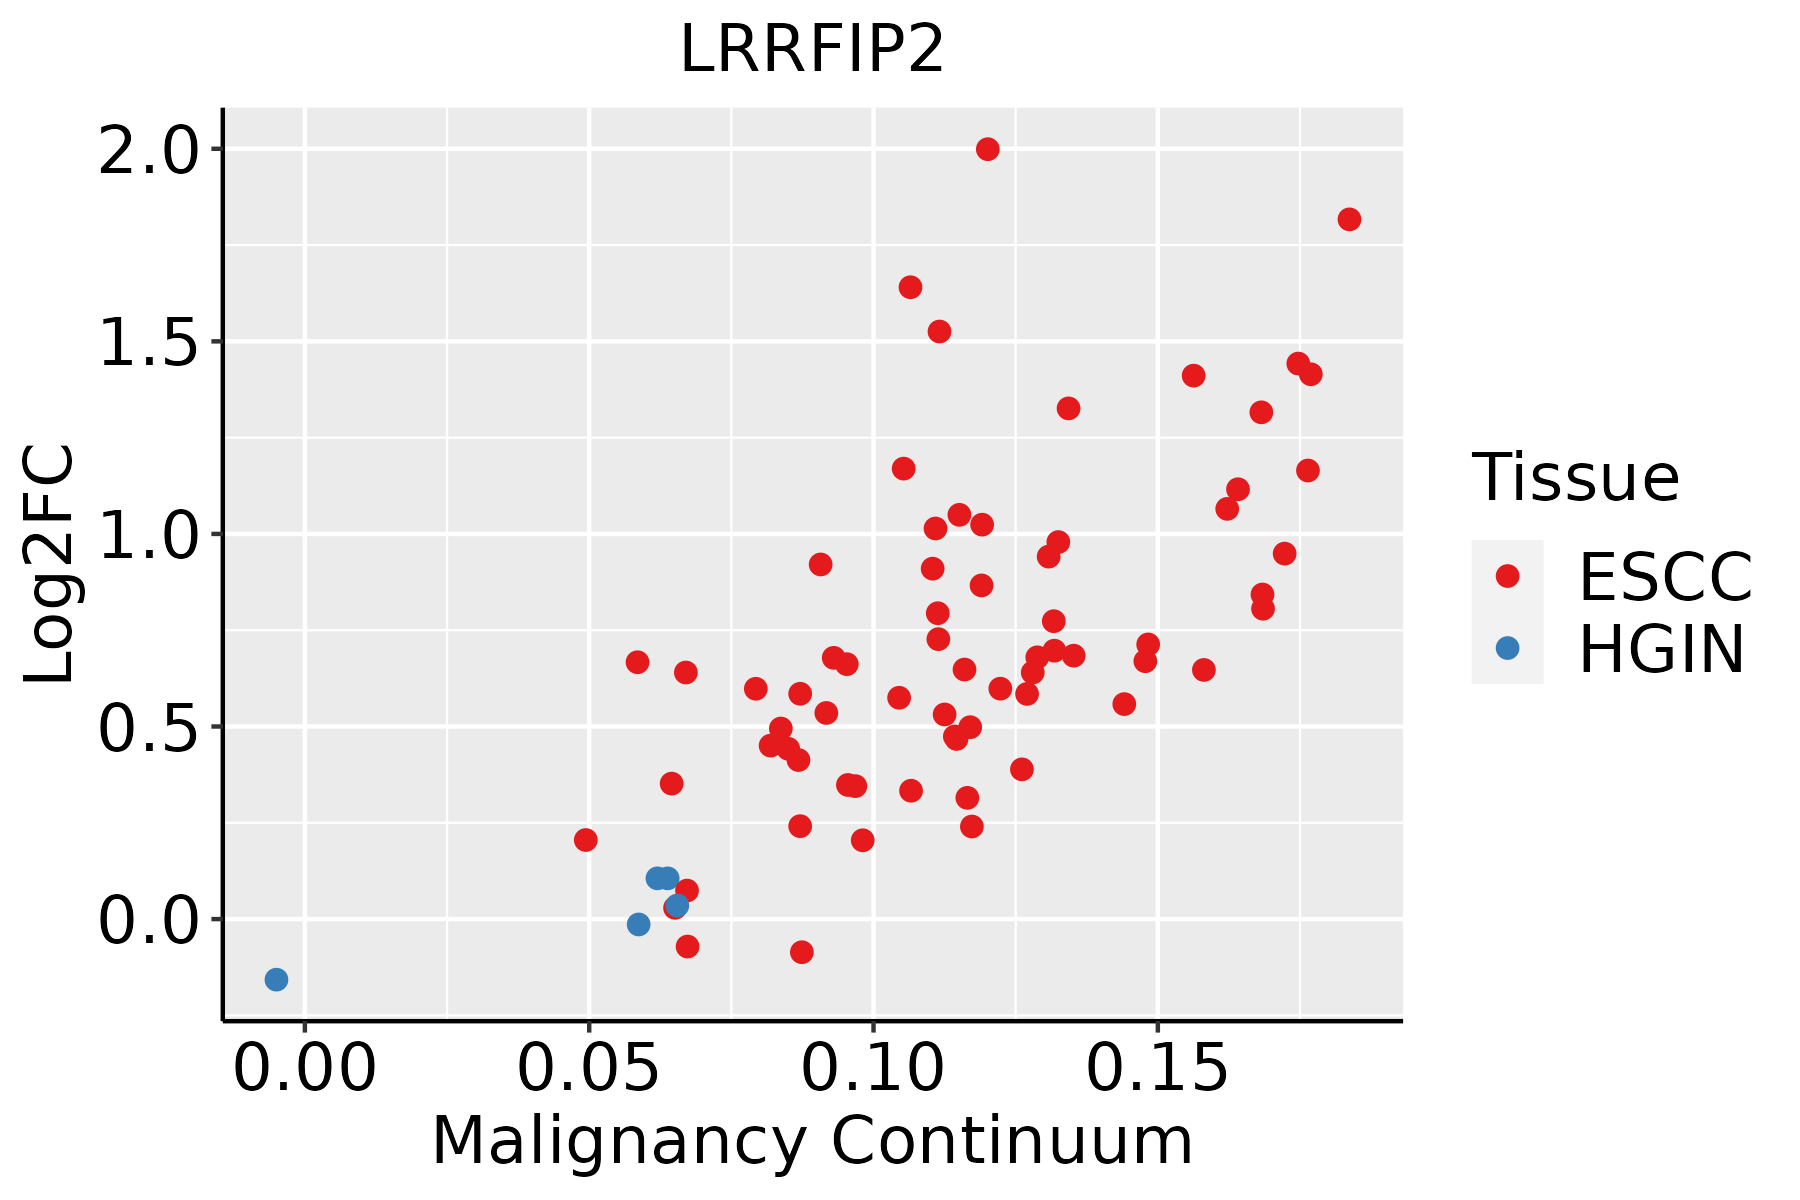 | ESCC: Esophageal squamous cell carcinoma |
| HGIN: High-grade intraepithelial neoplasias | ||
| LGIN: Low-grade intraepithelial neoplasias | ||
| Liver |  | HCC: Hepatocellular carcinoma |
| NAFLD: Non-alcoholic fatty liver disease | ||
| Lung | 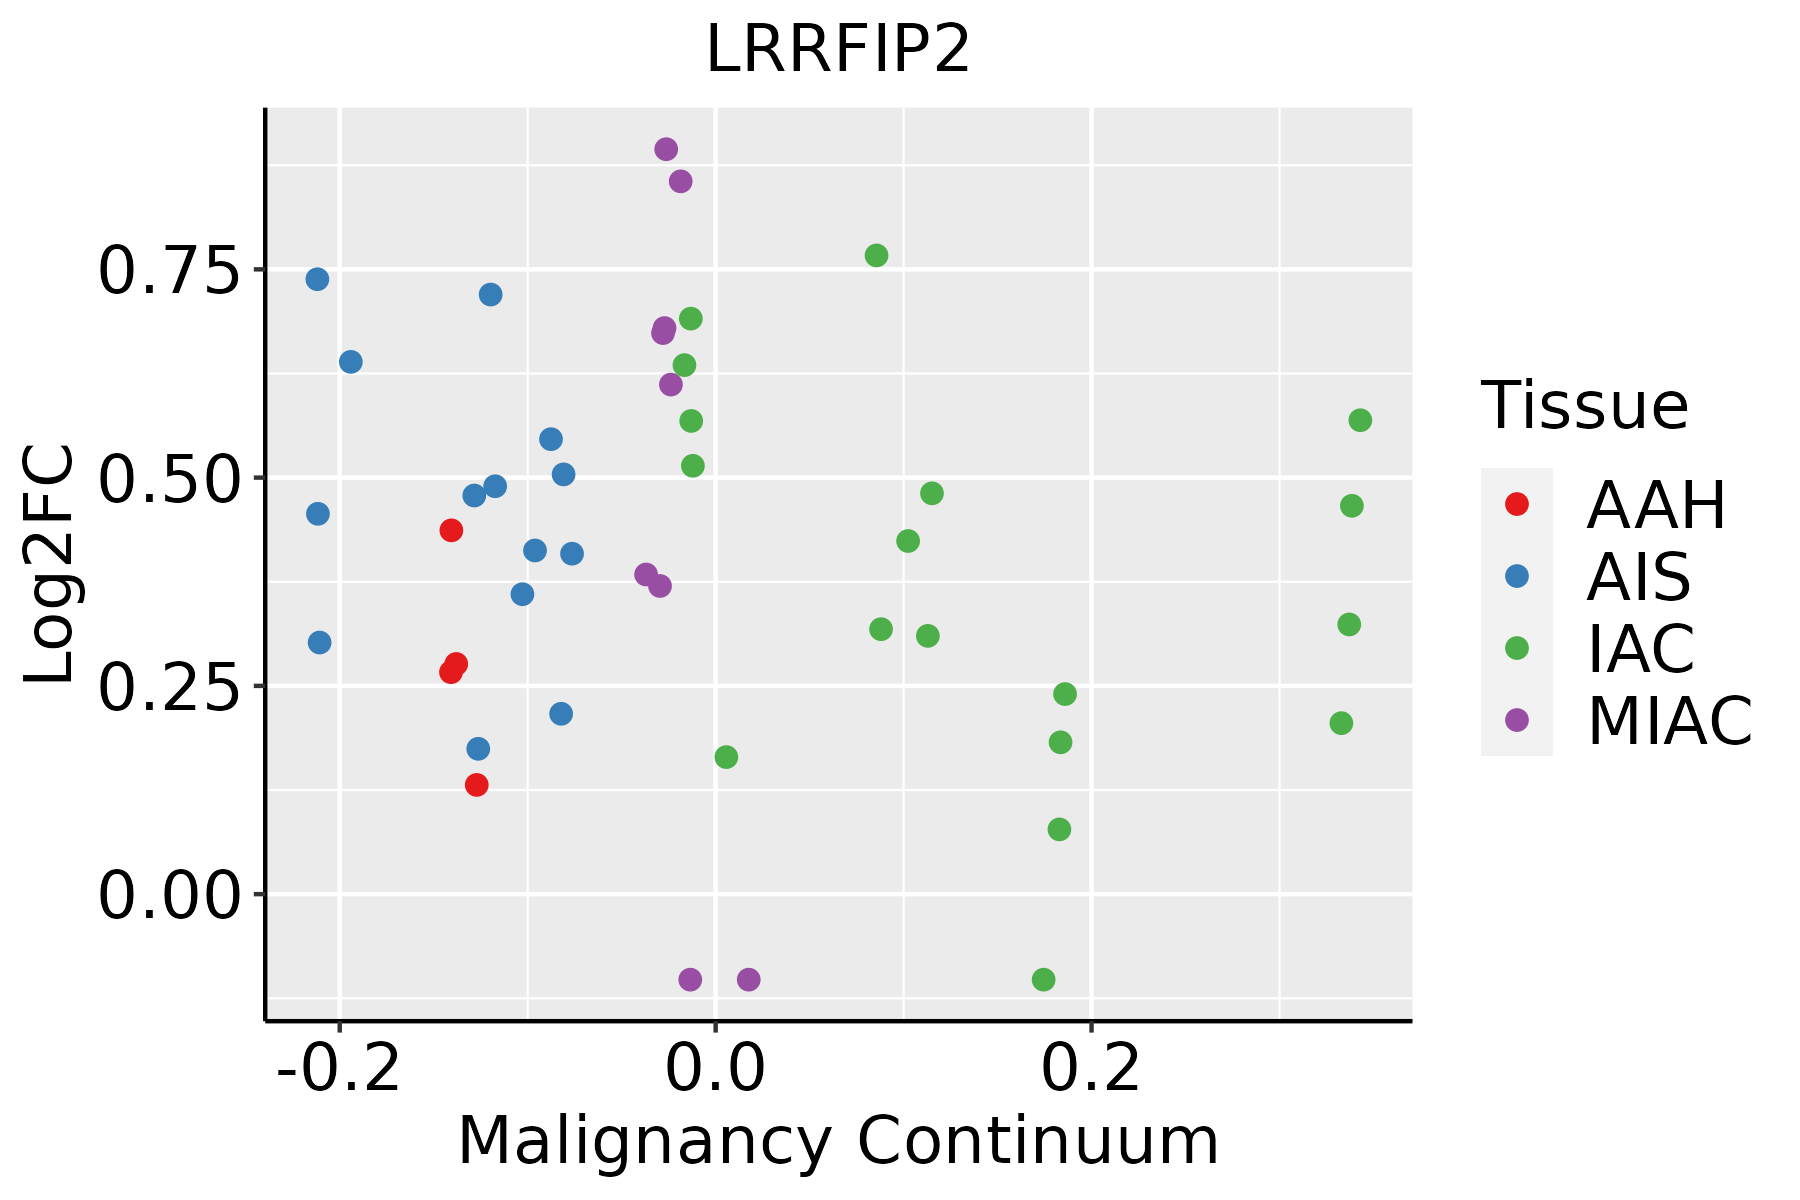 | AAH: Atypical adenomatous hyperplasia |
| AIS: Adenocarcinoma in situ | ||
| IAC: Invasive lung adenocarcinoma | ||
| MIA: Minimally invasive adenocarcinoma | ||
| Oral Cavity | 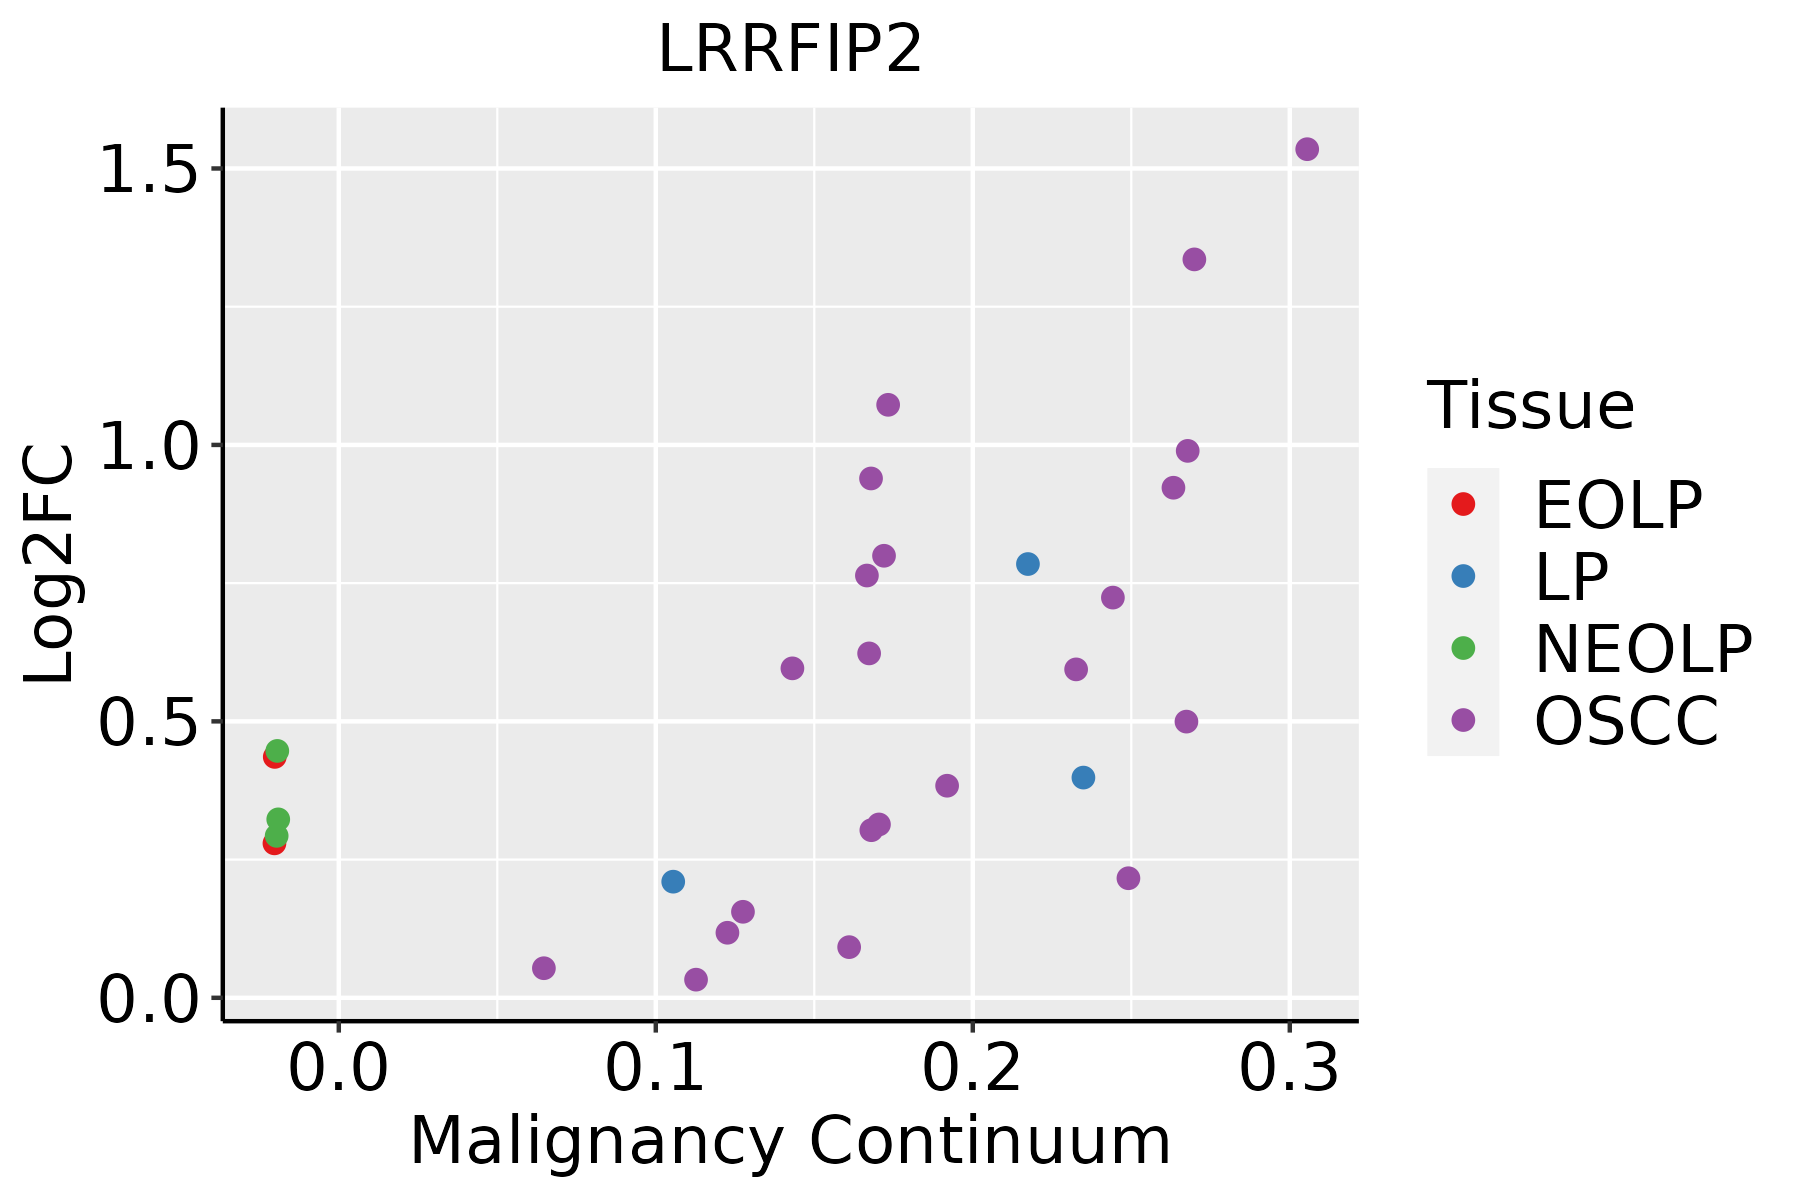 | EOLP: Erosive Oral lichen planus |
| LP: leukoplakia | ||
| NEOLP: Non-erosive oral lichen planus | ||
| OSCC: Oral squamous cell carcinoma | ||
| Prostate |  | BPH: Benign Prostatic Hyperplasia |
| Skin | 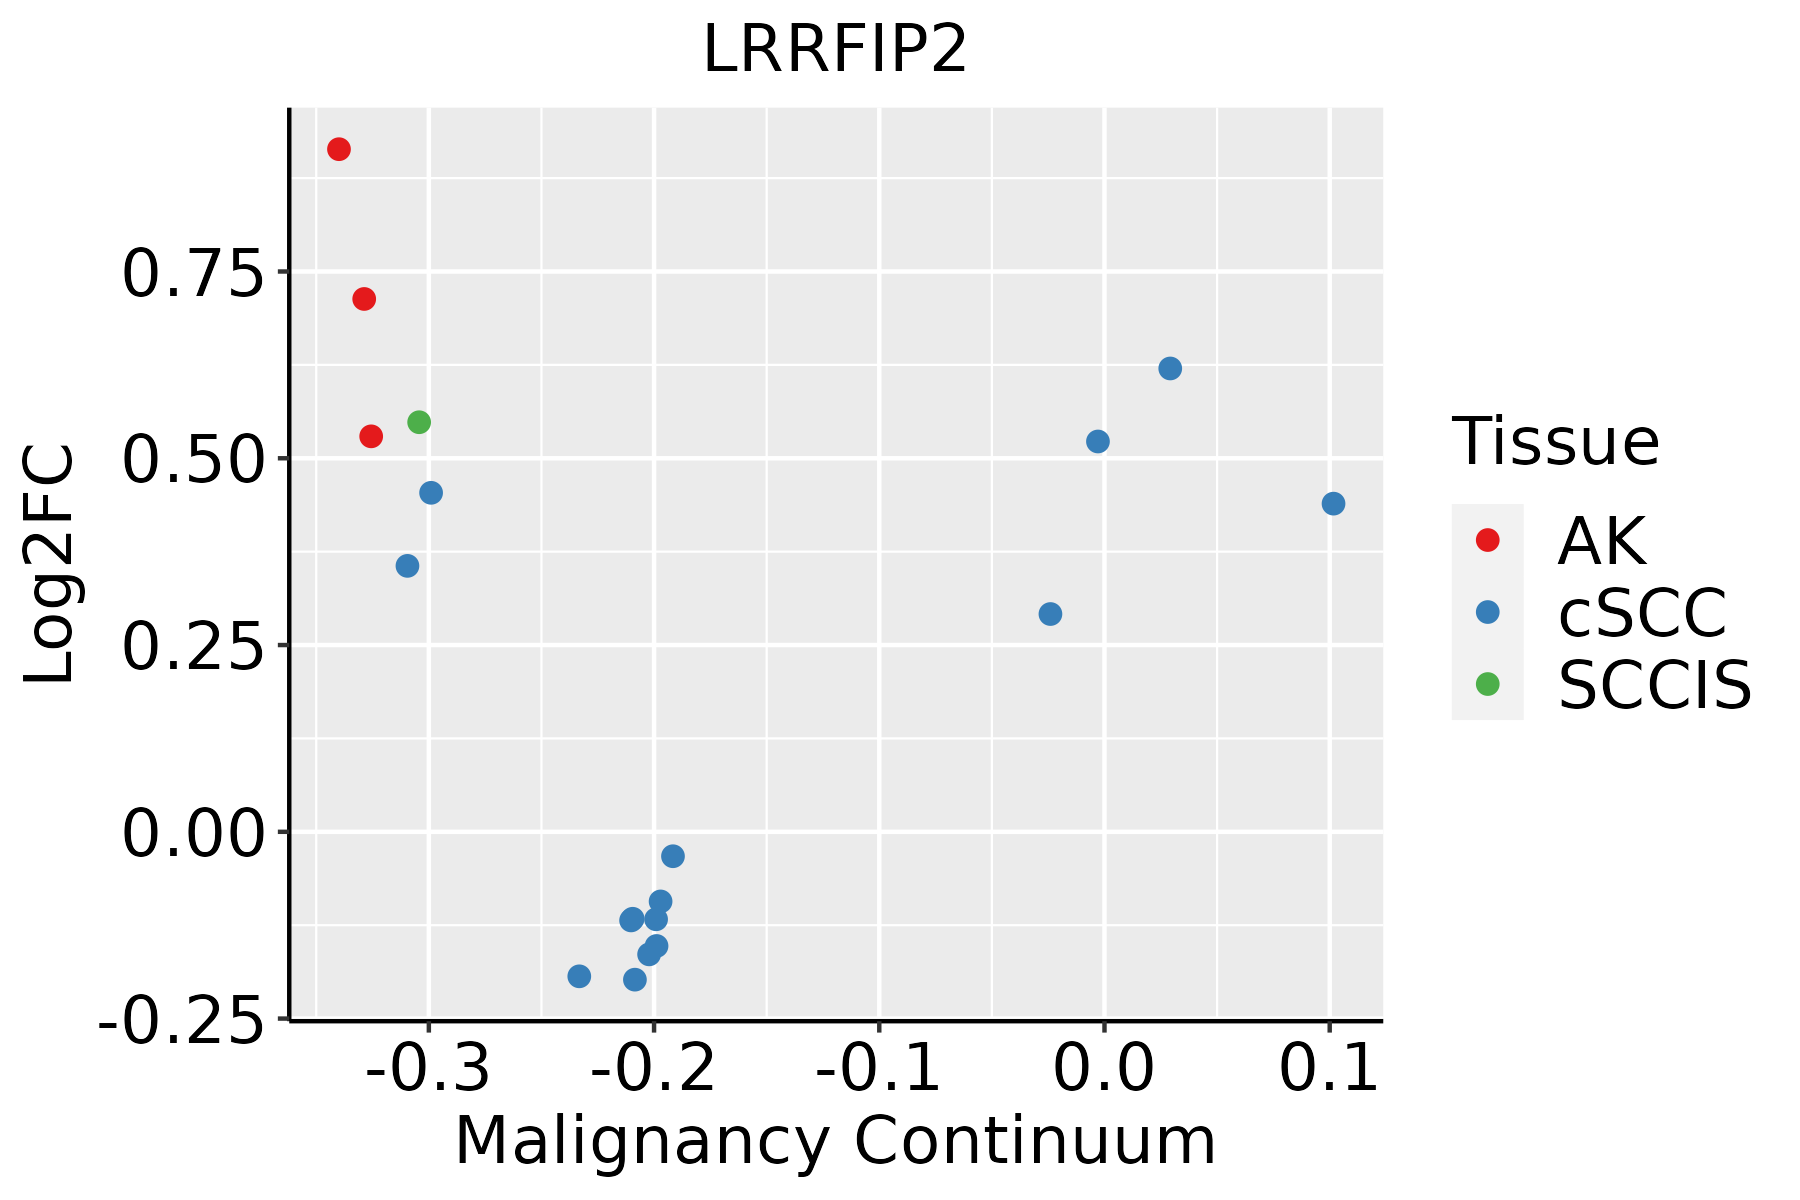 | AK: Actinic keratosis |
| cSCC: Cutaneous squamous cell carcinoma | ||
| SCCIS:squamous cell carcinoma in situ | ||
| Thyroid | 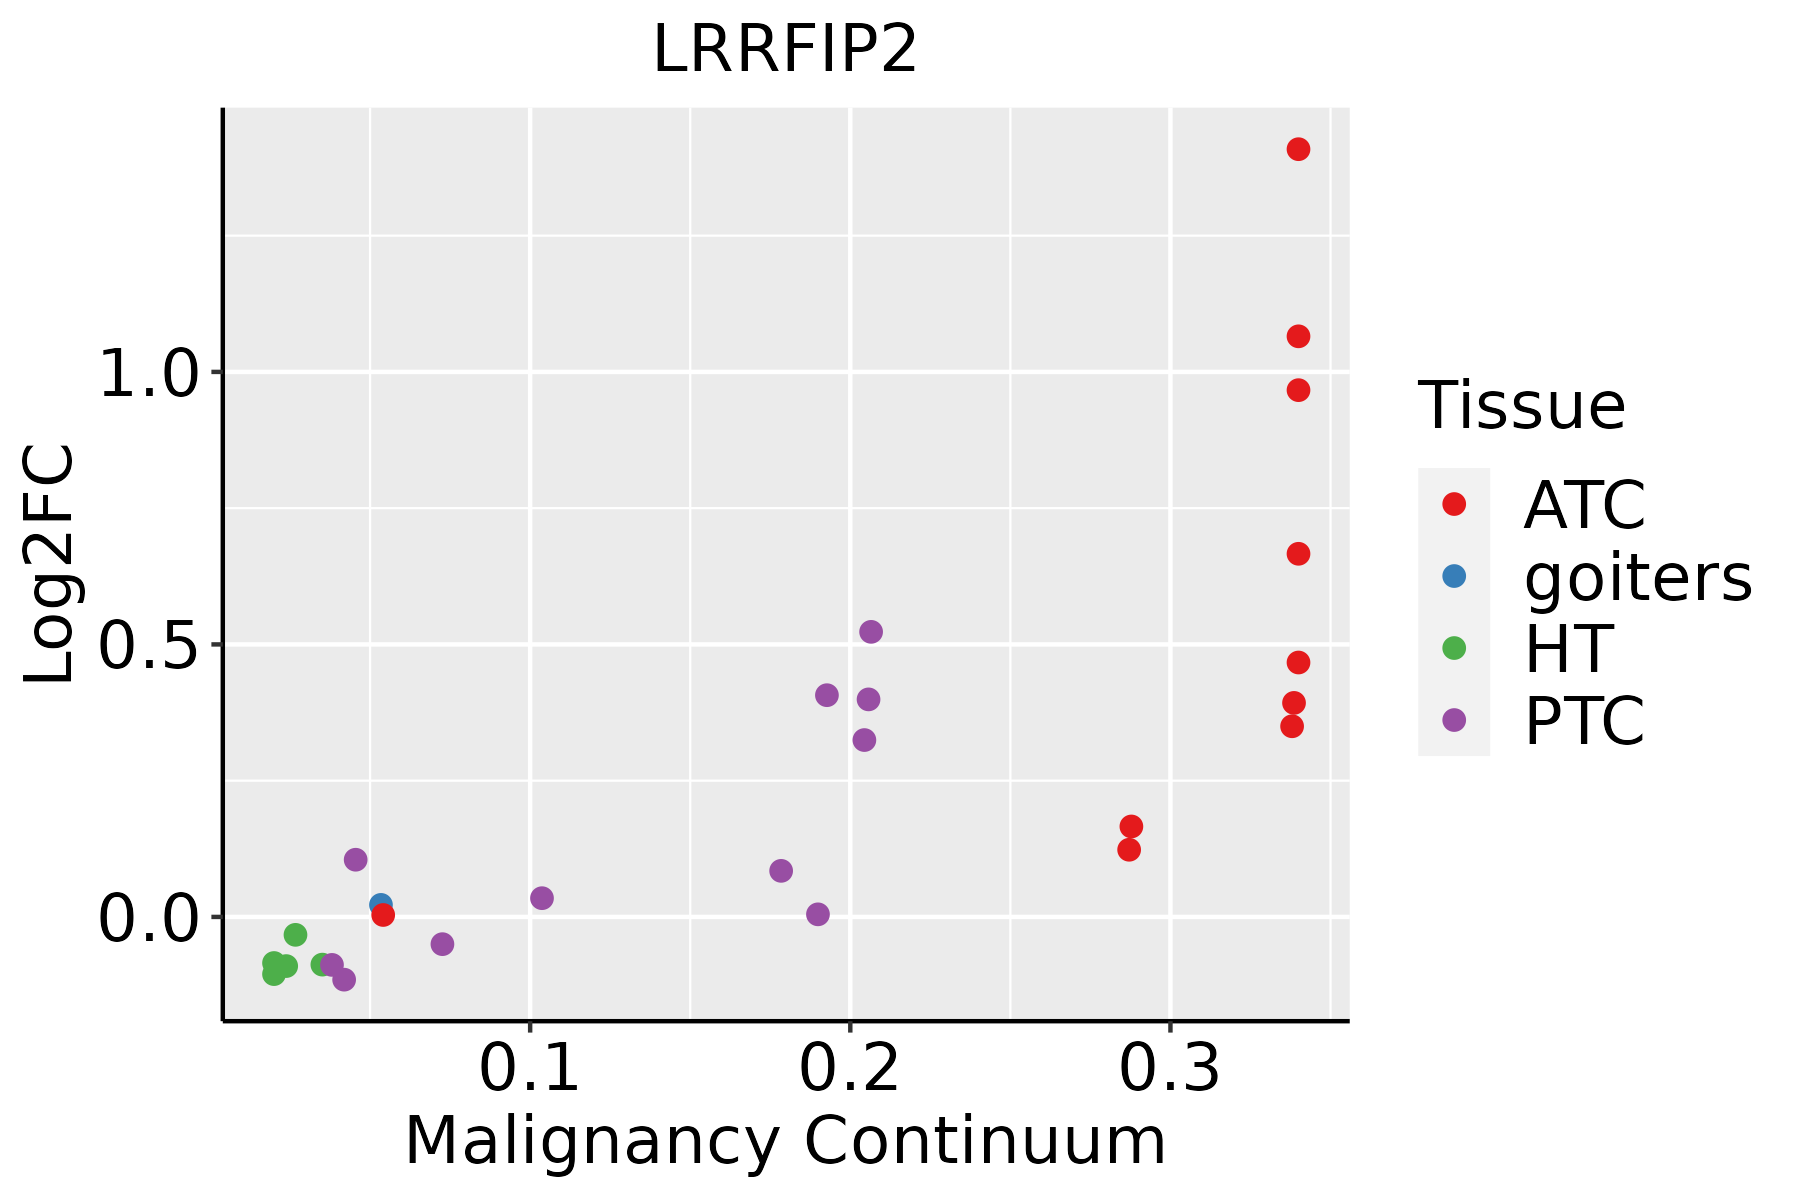 | ATC: Anaplastic thyroid cancer |
| HT: Hashimoto's thyroiditis | ||
| PTC: Papillary thyroid cancer |
| ∗log2FC in expression of this searched gene in stem-like cells from each diseased tissue sample relative to stem-like cells in normal samples in each tissue plotted against the malignancy continuum. Samples are colored based on if they are from different disease stage. |
Top |
Malignant transformation related pathway analysis |
| Find out the enriched GO biological processes and KEGG pathways involved in transition from healthy to precancer to cancer |
| Tissue | Disease Stage | Enriched GO biological Processes |
| Colorectum | AD |  |
| Colorectum | SER |  |
| Colorectum | MSS |  |
| Colorectum | MSI-H |  |
| Colorectum | FAP |  |
| ∗Top 15 enriched GO BP terms are showed in the bar plot of each disease state in each tissue. Each row represents a significant GO biological process which is colored according to the -log10(p.adjust). |
| Page: 1 2 3 4 5 6 7 8 9 |
| GO ID | Tissue | Disease Stage | Description | Gene Ratio | Bg Ratio | pvalue | p.adjust | Count |
| GO:00160557 | Cervix | CC | Wnt signaling pathway | 98/2311 | 444/18723 | 4.82e-09 | 4.65e-07 | 98 |
| GO:01987387 | Cervix | CC | cell-cell signaling by wnt | 98/2311 | 446/18723 | 6.16e-09 | 5.58e-07 | 98 |
| GO:0016055 | Colorectum | AD | Wnt signaling pathway | 130/3918 | 444/18723 | 1.60e-05 | 3.37e-04 | 130 |
| GO:0198738 | Colorectum | AD | cell-cell signaling by wnt | 130/3918 | 446/18723 | 2.02e-05 | 4.10e-04 | 130 |
| GO:00160551 | Colorectum | SER | Wnt signaling pathway | 97/2897 | 444/18723 | 2.02e-04 | 3.68e-03 | 97 |
| GO:01987381 | Colorectum | SER | cell-cell signaling by wnt | 97/2897 | 446/18723 | 2.39e-04 | 4.11e-03 | 97 |
| GO:00160552 | Colorectum | MSS | Wnt signaling pathway | 124/3467 | 444/18723 | 6.06e-07 | 2.26e-05 | 124 |
| GO:01987382 | Colorectum | MSS | cell-cell signaling by wnt | 124/3467 | 446/18723 | 7.83e-07 | 2.77e-05 | 124 |
| GO:00160553 | Colorectum | FAP | Wnt signaling pathway | 104/2622 | 444/18723 | 4.92e-08 | 3.92e-06 | 104 |
| GO:01987383 | Colorectum | FAP | cell-cell signaling by wnt | 104/2622 | 446/18723 | 6.26e-08 | 4.54e-06 | 104 |
| GO:00160554 | Colorectum | CRC | Wnt signaling pathway | 88/2078 | 444/18723 | 3.91e-08 | 5.28e-06 | 88 |
| GO:01987384 | Colorectum | CRC | cell-cell signaling by wnt | 88/2078 | 446/18723 | 4.85e-08 | 6.04e-06 | 88 |
| GO:001605517 | Esophagus | ESCC | Wnt signaling pathway | 268/8552 | 444/18723 | 2.32e-10 | 6.58e-09 | 268 |
| GO:019873817 | Esophagus | ESCC | cell-cell signaling by wnt | 269/8552 | 446/18723 | 2.41e-10 | 6.79e-09 | 269 |
| GO:00160555 | Liver | NAFLD | Wnt signaling pathway | 74/1882 | 444/18723 | 8.98e-06 | 2.96e-04 | 74 |
| GO:01987385 | Liver | NAFLD | cell-cell signaling by wnt | 74/1882 | 446/18723 | 1.05e-05 | 3.33e-04 | 74 |
| GO:001605511 | Liver | Cirrhotic | Wnt signaling pathway | 150/4634 | 444/18723 | 9.75e-06 | 1.42e-04 | 150 |
| GO:019873811 | Liver | Cirrhotic | cell-cell signaling by wnt | 150/4634 | 446/18723 | 1.28e-05 | 1.80e-04 | 150 |
| GO:019873821 | Liver | HCC | cell-cell signaling by wnt | 247/7958 | 446/18723 | 2.11e-08 | 4.96e-07 | 247 |
| GO:001605521 | Liver | HCC | Wnt signaling pathway | 245/7958 | 444/18723 | 3.68e-08 | 8.09e-07 | 245 |
| Page: 1 2 3 |
| Pathway ID | Tissue | Disease Stage | Description | Gene Ratio | Bg Ratio | pvalue | p.adjust | qvalue | Count |
| Page: 1 |
Top |
Cell-cell communication analysis |
| Identification of potential cell-cell interactions between two cell types and their ligand-receptor pairs for different disease states |
| Ligand | Receptor | LRpair | Pathway | Tissue | Disease Stage |
| Page: 1 |
Top |
Single-cell gene regulatory network inference analysis |
| Find out the significant the regulons (TFs) and the target genes of each regulon across cell types for different disease states |
| TF | Cell Type | Tissue | Disease Stage | Target Gene | RSS | Regulon Activity |
| ∗The dot plots of a searched regulon are shown for all cell subpopulations in each disease state of each tissue based on the regulon specific score inferred using pySCENIC and by calculating the average expression. |
| Page: 1 |
Top |
Somatic mutation of malignant transformation related genes |
| Annotation of somatic variants for genes involved in malignant transformation |
| Hugo Symbol | Variant Class | Variant Classification | dbSNP RS | HGVSc | HGVSp | HGVSp Short | SWISSPROT | BIOTYPE | SIFT | PolyPhen | Tumor Sample Barcode | Tissue | Histology | Sex | Age | Stage | Therapy Types | Drugs | Outcome |
| LRRFIP2 | SNV | Missense_Mutation | c.775G>C | p.Glu259Gln | p.E259Q | Q9Y608 | protein_coding | tolerated(0.1) | benign(0.147) | TCGA-A2-A0YK-01 | Breast | breast invasive carcinoma | Female | <65 | I/II | Chemotherapy | cytoxan | SD | |
| LRRFIP2 | SNV | Missense_Mutation | c.1451N>G | p.Asp484Gly | p.D484G | Q9Y608 | protein_coding | deleterious(0) | probably_damaging(0.965) | TCGA-D8-A1JB-01 | Breast | breast invasive carcinoma | Female | <65 | I/II | Chemotherapy | adriamycin | SD | |
| LRRFIP2 | insertion | Frame_Shift_Ins | novel | c.1176_1177insCCTTTAT | p.Lys393ProfsTer3 | p.K393Pfs*3 | Q9Y608 | protein_coding | TCGA-AR-A0U2-01 | Breast | breast invasive carcinoma | Female | <65 | III/IV | Hormone Therapy | tamoxiphen | PD | ||
| LRRFIP2 | SNV | Missense_Mutation | c.311N>A | p.Arg104Gln | p.R104Q | Q9Y608 | protein_coding | tolerated(0.37) | benign(0.019) | TCGA-AA-3510-01 | Colorectum | colon adenocarcinoma | Male | >=65 | I/II | Unknown | Unknown | SD | |
| LRRFIP2 | SNV | Missense_Mutation | rs139151890 | c.1784N>A | p.Arg595Gln | p.R595Q | Q9Y608 | protein_coding | tolerated(0.17) | benign(0.034) | TCGA-AA-3715-01 | Colorectum | colon adenocarcinoma | Male | >=65 | I/II | Unknown | Unknown | PD |
| LRRFIP2 | SNV | Missense_Mutation | c.143N>C | p.Ile48Thr | p.I48T | Q9Y608 | protein_coding | deleterious(0) | probably_damaging(0.998) | TCGA-AA-3864-01 | Colorectum | colon adenocarcinoma | Male | >=65 | I/II | Unknown | Unknown | SD | |
| LRRFIP2 | SNV | Missense_Mutation | c.653N>A | p.Arg218Gln | p.R218Q | Q9Y608 | protein_coding | tolerated(0.06) | benign(0.003) | TCGA-AA-3977-01 | Colorectum | colon adenocarcinoma | Male | >=65 | I/II | Unknown | Unknown | SD | |
| LRRFIP2 | SNV | Missense_Mutation | rs368439611 | c.818N>A | p.Arg273His | p.R273H | Q9Y608 | protein_coding | deleterious(0.04) | benign(0.044) | TCGA-AZ-6601-01 | Colorectum | colon adenocarcinoma | Male | >=65 | I/II | Unknown | Unknown | PD |
| LRRFIP2 | SNV | Missense_Mutation | novel | c.1457N>C | p.Lys486Thr | p.K486T | Q9Y608 | protein_coding | deleterious(0.01) | benign(0.003) | TCGA-CA-6717-01 | Colorectum | colon adenocarcinoma | Male | <65 | I/II | Chemotherapy | oxaliplatin | CR |
| LRRFIP2 | SNV | Missense_Mutation | rs762000660 | c.1712N>A | p.Arg571Gln | p.R571Q | Q9Y608 | protein_coding | deleterious(0.03) | probably_damaging(0.984) | TCGA-CA-6718-01 | Colorectum | colon adenocarcinoma | Male | <65 | I/II | Unknown | Unknown | PD |
| Page: 1 2 3 4 5 6 7 8 9 |
Top |
Related drugs of malignant transformation related genes |
| Identification of chemicals and drugs interact with genes involved in malignant transfromation |
| (DGIdb 4.0) |
| Entrez ID | Symbol | Category | Interaction Types | Drug Claim Name | Drug Name | PMIDs |
| Page: 1 |

Copyright 2023-Present -The University of Texas Health Science Center at Houston |