
|
|||||
|
 | |
| |
| |
| |
| |
| |
|
Gene: LRRC8D |
Gene summary for LRRC8D |
| Gene information | Species | Human | Gene symbol | LRRC8D | Gene ID | 55144 |
| Gene name | leucine rich repeat containing 8 VRAC subunit D | |
| Gene Alias | HsLRRC8D | |
| Cytomap | 1p22.2 | |
| Gene Type | protein-coding | GO ID | GO:0001678 | UniProtAcc | B3KRU1 |
Top |
Malignant transformation analysis |
| Identification of the aberrant gene expression in precancerous and cancerous lesions by comparing the gene expression of stem-like cells in diseased tissues with normal stem cells |
| Entrez ID | Symbol | Replicates | Species | Organ | Tissue | Adj P-value | Log2FC | Malignancy |
| 55144 | LRRC8D | LZE4T | Human | Esophagus | ESCC | 1.33e-02 | 7.31e-02 | 0.0811 |
| 55144 | LRRC8D | LZE7T | Human | Esophagus | ESCC | 1.72e-06 | 1.80e-01 | 0.0667 |
| 55144 | LRRC8D | LZE24T | Human | Esophagus | ESCC | 7.06e-10 | 9.52e-02 | 0.0596 |
| 55144 | LRRC8D | P2T-E | Human | Esophagus | ESCC | 4.74e-17 | 2.74e-01 | 0.1177 |
| 55144 | LRRC8D | P4T-E | Human | Esophagus | ESCC | 7.90e-11 | 3.06e-01 | 0.1323 |
| 55144 | LRRC8D | P5T-E | Human | Esophagus | ESCC | 1.86e-09 | 1.00e-01 | 0.1327 |
| 55144 | LRRC8D | P8T-E | Human | Esophagus | ESCC | 1.54e-08 | 1.59e-01 | 0.0889 |
| 55144 | LRRC8D | P9T-E | Human | Esophagus | ESCC | 1.80e-05 | 1.27e-01 | 0.1131 |
| 55144 | LRRC8D | P10T-E | Human | Esophagus | ESCC | 2.58e-30 | 3.23e-01 | 0.116 |
| 55144 | LRRC8D | P11T-E | Human | Esophagus | ESCC | 1.98e-02 | 3.46e-01 | 0.1426 |
| 55144 | LRRC8D | P12T-E | Human | Esophagus | ESCC | 9.67e-77 | 1.58e+00 | 0.1122 |
| 55144 | LRRC8D | P15T-E | Human | Esophagus | ESCC | 3.29e-13 | 3.07e-01 | 0.1149 |
| 55144 | LRRC8D | P16T-E | Human | Esophagus | ESCC | 6.56e-18 | 4.00e-01 | 0.1153 |
| 55144 | LRRC8D | P17T-E | Human | Esophagus | ESCC | 3.87e-02 | 2.01e-01 | 0.1278 |
| 55144 | LRRC8D | P20T-E | Human | Esophagus | ESCC | 5.46e-14 | 2.11e-01 | 0.1124 |
| 55144 | LRRC8D | P21T-E | Human | Esophagus | ESCC | 1.58e-22 | 5.75e-01 | 0.1617 |
| 55144 | LRRC8D | P22T-E | Human | Esophagus | ESCC | 8.02e-10 | 1.49e-01 | 0.1236 |
| 55144 | LRRC8D | P23T-E | Human | Esophagus | ESCC | 1.82e-14 | 3.32e-01 | 0.108 |
| 55144 | LRRC8D | P24T-E | Human | Esophagus | ESCC | 2.32e-06 | 4.41e-02 | 0.1287 |
| 55144 | LRRC8D | P26T-E | Human | Esophagus | ESCC | 8.12e-33 | 6.15e-01 | 0.1276 |
| Page: 1 2 3 4 |
| Tissue | Expression Dynamics | Abbreviation |
| Esophagus |  | ESCC: Esophageal squamous cell carcinoma |
| HGIN: High-grade intraepithelial neoplasias | ||
| LGIN: Low-grade intraepithelial neoplasias | ||
| Liver | 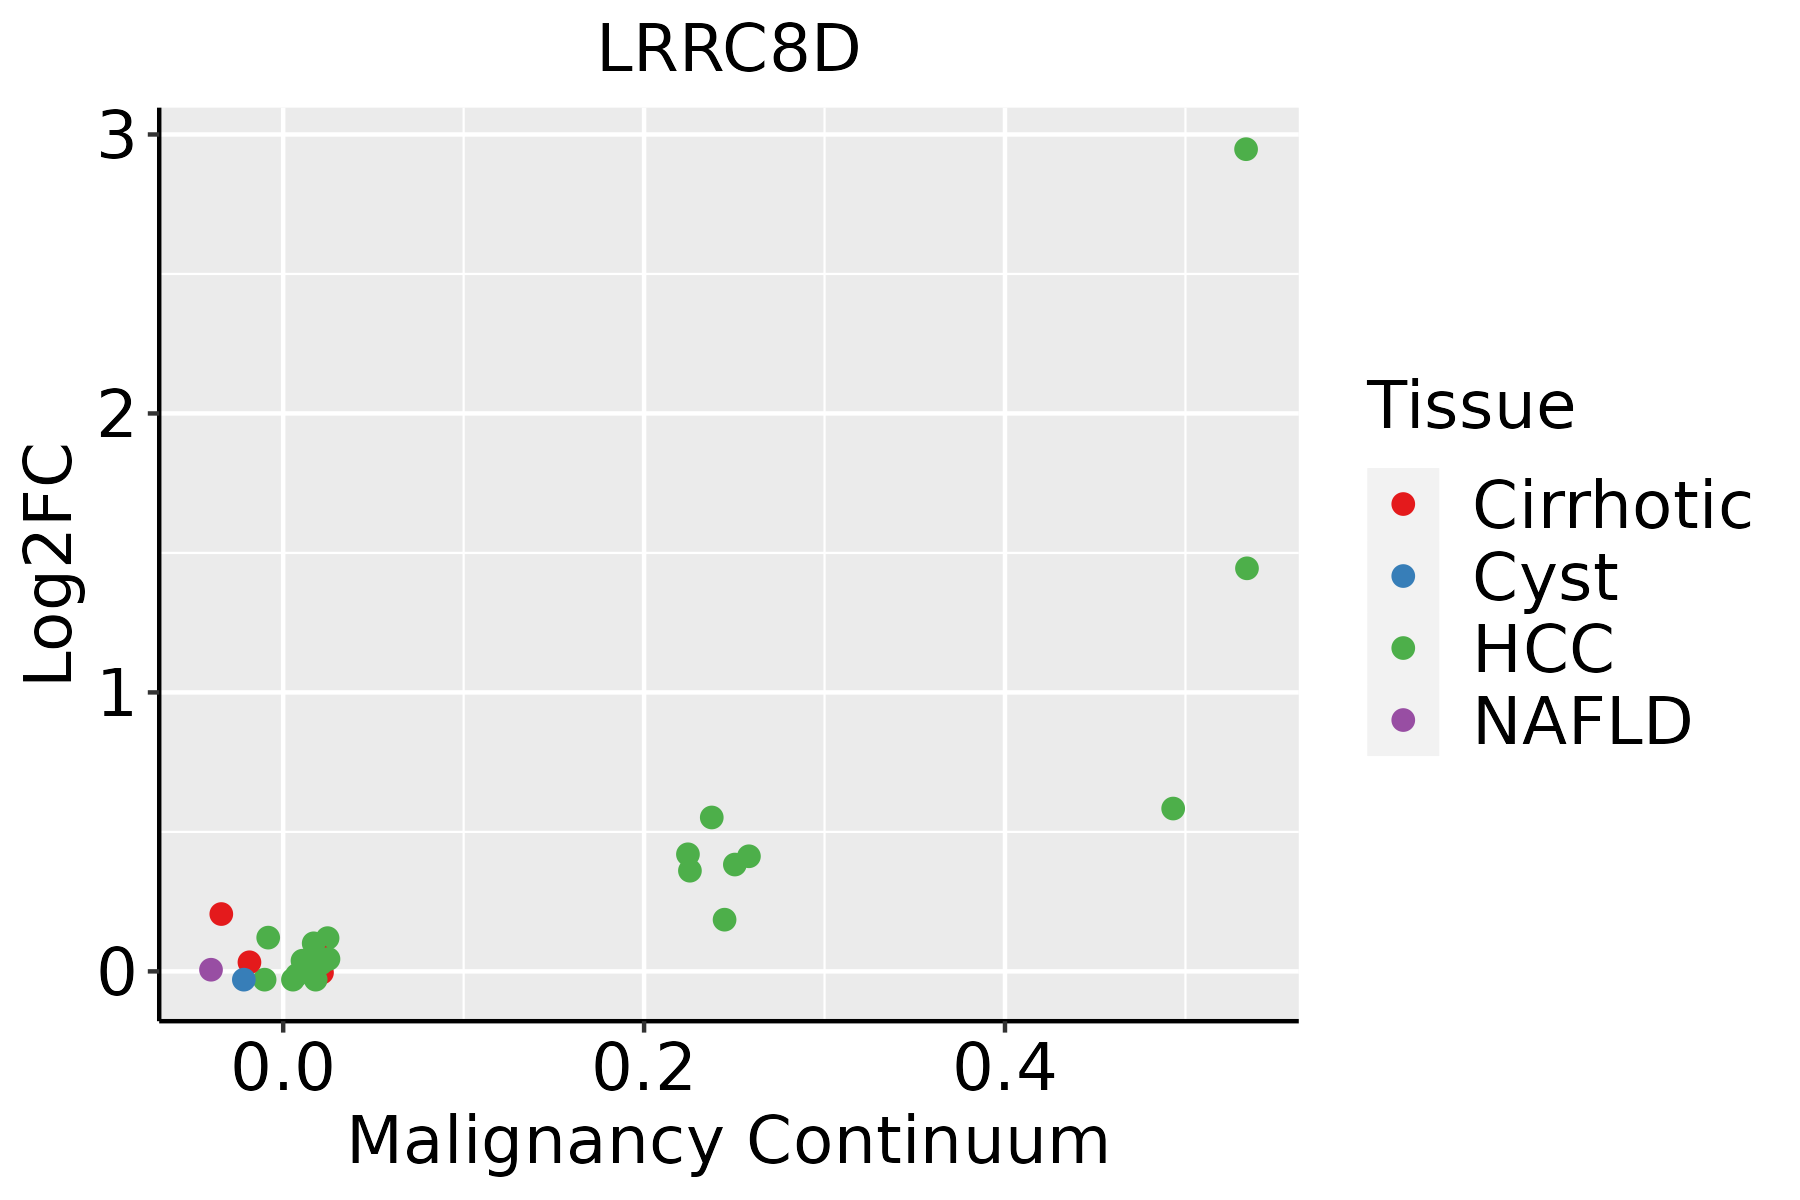 | HCC: Hepatocellular carcinoma |
| NAFLD: Non-alcoholic fatty liver disease | ||
| Oral Cavity | 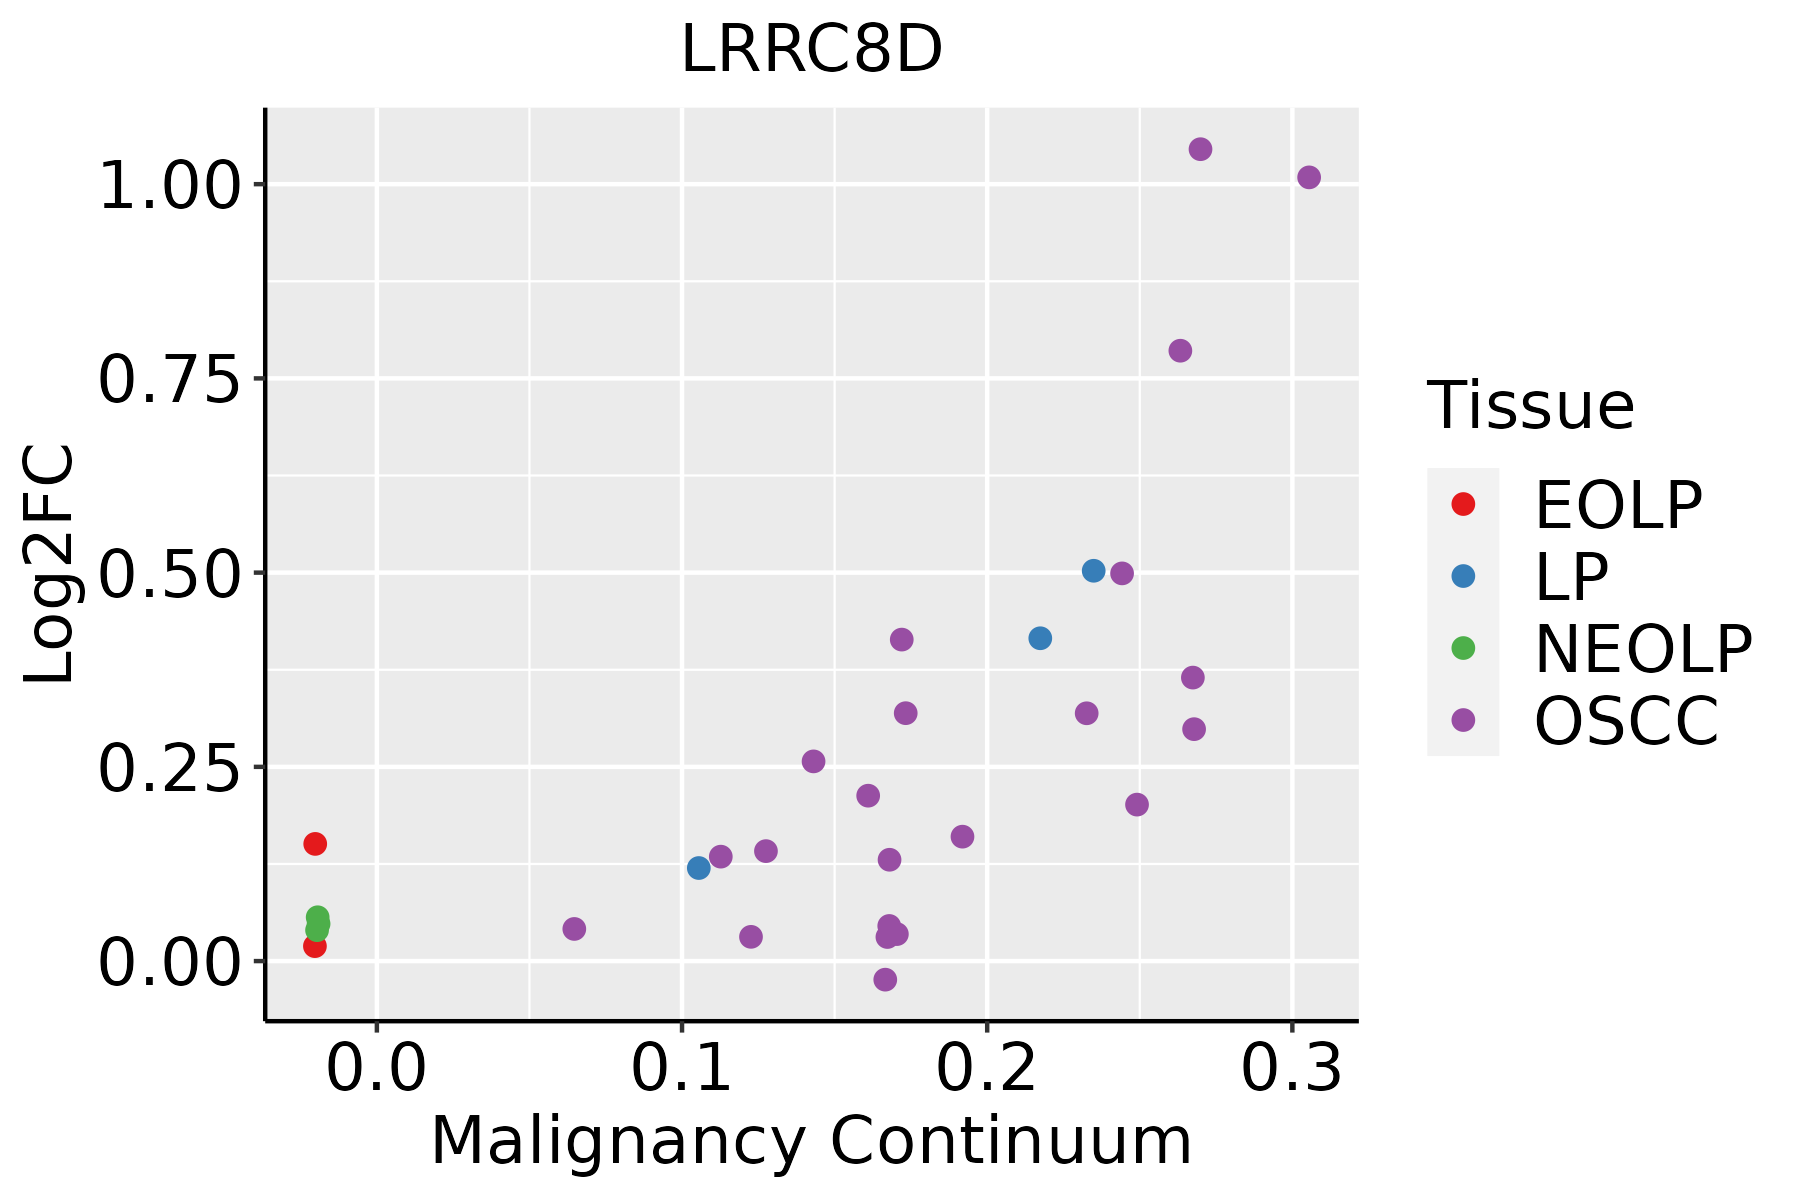 | EOLP: Erosive Oral lichen planus |
| LP: leukoplakia | ||
| NEOLP: Non-erosive oral lichen planus | ||
| OSCC: Oral squamous cell carcinoma |
| ∗log2FC in expression of this searched gene in stem-like cells from each diseased tissue sample relative to stem-like cells in normal samples in each tissue plotted against the malignancy continuum. Samples are colored based on if they are from different disease stage. |
Top |
Malignant transformation related pathway analysis |
| Find out the enriched GO biological processes and KEGG pathways involved in transition from healthy to precancer to cancer |
| Tissue | Disease Stage | Enriched GO biological Processes |
| Colorectum | AD |  |
| Colorectum | SER |  |
| Colorectum | MSS |  |
| Colorectum | MSI-H |  |
| Colorectum | FAP |  |
| ∗Top 15 enriched GO BP terms are showed in the bar plot of each disease state in each tissue. Each row represents a significant GO biological process which is colored according to the -log10(p.adjust). |
| Page: 1 2 3 4 5 6 7 8 9 |
| GO ID | Tissue | Disease Stage | Description | Gene Ratio | Bg Ratio | pvalue | p.adjust | Count |
| GO:0062197111 | Esophagus | ESCC | cellular response to chemical stress | 234/8552 | 337/18723 | 5.37e-19 | 5.97e-17 | 234 |
| GO:007121419 | Esophagus | ESCC | cellular response to abiotic stimulus | 206/8552 | 331/18723 | 7.52e-10 | 1.88e-08 | 206 |
| GO:010400419 | Esophagus | ESCC | cellular response to environmental stimulus | 206/8552 | 331/18723 | 7.52e-10 | 1.88e-08 | 206 |
| GO:00069707 | Esophagus | ESCC | response to osmotic stress | 57/8552 | 84/18723 | 3.26e-05 | 2.70e-04 | 57 |
| GO:00714707 | Esophagus | ESCC | cellular response to osmotic stress | 31/8552 | 41/18723 | 9.32e-05 | 6.68e-04 | 31 |
| GO:00512592 | Esophagus | ESCC | protein complex oligomerization | 130/8552 | 238/18723 | 3.29e-03 | 1.36e-02 | 130 |
| GO:006219722 | Liver | HCC | cellular response to chemical stress | 216/7958 | 337/18723 | 6.86e-16 | 5.44e-14 | 216 |
| GO:007121421 | Liver | HCC | cellular response to abiotic stimulus | 183/7958 | 331/18723 | 1.59e-06 | 2.26e-05 | 183 |
| GO:010400421 | Liver | HCC | cellular response to environmental stimulus | 183/7958 | 331/18723 | 1.59e-06 | 2.26e-05 | 183 |
| GO:00069702 | Liver | HCC | response to osmotic stress | 52/7958 | 84/18723 | 2.58e-04 | 1.92e-03 | 52 |
| GO:004259322 | Liver | HCC | glucose homeostasis | 137/7958 | 258/18723 | 3.59e-04 | 2.49e-03 | 137 |
| GO:003350022 | Liver | HCC | carbohydrate homeostasis | 137/7958 | 259/18723 | 4.45e-04 | 2.98e-03 | 137 |
| GO:000167822 | Liver | HCC | cellular glucose homeostasis | 95/7958 | 172/18723 | 4.95e-04 | 3.24e-03 | 95 |
| GO:00714701 | Liver | HCC | cellular response to osmotic stress | 28/7958 | 41/18723 | 7.54e-04 | 4.55e-03 | 28 |
| GO:006219720 | Oral cavity | OSCC | cellular response to chemical stress | 204/7305 | 337/18723 | 6.89e-16 | 5.19e-14 | 204 |
| GO:007121416 | Oral cavity | OSCC | cellular response to abiotic stimulus | 186/7305 | 331/18723 | 1.38e-10 | 4.10e-09 | 186 |
| GO:010400416 | Oral cavity | OSCC | cellular response to environmental stimulus | 186/7305 | 331/18723 | 1.38e-10 | 4.10e-09 | 186 |
| GO:00069706 | Oral cavity | OSCC | response to osmotic stress | 50/7305 | 84/18723 | 1.11e-04 | 8.15e-04 | 50 |
| GO:0051259 | Oral cavity | OSCC | protein complex oligomerization | 121/7305 | 238/18723 | 1.29e-04 | 9.21e-04 | 121 |
| GO:000167816 | Oral cavity | OSCC | cellular glucose homeostasis | 88/7305 | 172/18723 | 7.74e-04 | 4.22e-03 | 88 |
| Page: 1 2 |
| Pathway ID | Tissue | Disease Stage | Description | Gene Ratio | Bg Ratio | pvalue | p.adjust | qvalue | Count |
| Page: 1 |
Top |
Cell-cell communication analysis |
| Identification of potential cell-cell interactions between two cell types and their ligand-receptor pairs for different disease states |
| Ligand | Receptor | LRpair | Pathway | Tissue | Disease Stage |
| Page: 1 |
Top |
Single-cell gene regulatory network inference analysis |
| Find out the significant the regulons (TFs) and the target genes of each regulon across cell types for different disease states |
| TF | Cell Type | Tissue | Disease Stage | Target Gene | RSS | Regulon Activity |
| ∗The dot plots of a searched regulon are shown for all cell subpopulations in each disease state of each tissue based on the regulon specific score inferred using pySCENIC and by calculating the average expression. |
| Page: 1 |
Top |
Somatic mutation of malignant transformation related genes |
| Annotation of somatic variants for genes involved in malignant transformation |
| Hugo Symbol | Variant Class | Variant Classification | dbSNP RS | HGVSc | HGVSp | HGVSp Short | SWISSPROT | BIOTYPE | SIFT | PolyPhen | Tumor Sample Barcode | Tissue | Histology | Sex | Age | Stage | Therapy Types | Drugs | Outcome |
| LRRC8D | SNV | Missense_Mutation | c.296C>T | p.Ser99Phe | p.S99F | Q7L1W4 | protein_coding | tolerated(0.08) | benign(0.03) | TCGA-AC-A3QQ-01 | Breast | breast invasive carcinoma | Female | <65 | I/II | Unknown | Unknown | SD | |
| LRRC8D | SNV | Missense_Mutation | c.1187C>A | p.Ser396Tyr | p.S396Y | Q7L1W4 | protein_coding | deleterious(0.02) | possibly_damaging(0.882) | TCGA-AN-A046-01 | Breast | breast invasive carcinoma | Female | >=65 | I/II | Unknown | Unknown | SD | |
| LRRC8D | SNV | Missense_Mutation | c.844N>C | p.Glu282Gln | p.E282Q | Q7L1W4 | protein_coding | deleterious(0) | probably_damaging(1) | TCGA-BH-A0BF-01 | Breast | breast invasive carcinoma | Female | <65 | I/II | Unknown | Unknown | SD | |
| LRRC8D | SNV | Missense_Mutation | rs756646478 | c.2012N>A | p.Arg671His | p.R671H | Q7L1W4 | protein_coding | tolerated(0.05) | benign(0.187) | TCGA-BH-A0GY-01 | Breast | breast invasive carcinoma | Female | >=65 | I/II | Chemotherapy | cyotxan | SD |
| LRRC8D | SNV | Missense_Mutation | rs771012964 | c.2104A>G | p.Ile702Val | p.I702V | Q7L1W4 | protein_coding | tolerated(0.07) | possibly_damaging(0.735) | TCGA-D8-A1XQ-01 | Breast | breast invasive carcinoma | Female | >=65 | I/II | Unknown | Unknown | SD |
| LRRC8D | insertion | In_Frame_Ins | novel | c.1408_1409insCTTTTGCCATTAAAAGTAGTGGCAAAAACTGCAATCACTTTC | p.Asp470delinsAlaPheAlaIleLysSerSerGlyLysAsnCysAsnHisPheHis | p.D470delinsAFAIKSSGKNCNHFH | Q7L1W4 | protein_coding | TCGA-A8-A09M-01 | Breast | breast invasive carcinoma | Female | >=65 | III/IV | Chemotherapy | paclitaxel | CR | ||
| LRRC8D | insertion | Frame_Shift_Ins | novel | c.294_295insA | p.Ser99IlefsTer10 | p.S99Ifs*10 | Q7L1W4 | protein_coding | TCGA-AC-A3QQ-01 | Breast | breast invasive carcinoma | Female | <65 | I/II | Unknown | Unknown | SD | ||
| LRRC8D | insertion | Frame_Shift_Ins | novel | c.294_295insATTCTAGAGA | p.Ser99IlefsTer13 | p.S99Ifs*13 | Q7L1W4 | protein_coding | TCGA-AR-A0U0-01 | Breast | breast invasive carcinoma | Female | >=65 | I/II | Unknown | Unknown | SD | ||
| LRRC8D | SNV | Missense_Mutation | novel | c.1516C>T | p.Pro506Ser | p.P506S | Q7L1W4 | protein_coding | tolerated(0.21) | benign(0.035) | TCGA-C5-A8ZZ-01 | Cervix | cervical & endocervical cancer | Female | <65 | I/II | Unspecific | Cisplatin | SD |
| LRRC8D | SNV | Missense_Mutation | rs773687858 | c.278G>A | p.Arg93Gln | p.R93Q | Q7L1W4 | protein_coding | tolerated(0.72) | benign(0) | TCGA-A6-5665-01 | Colorectum | colon adenocarcinoma | Female | >=65 | I/II | Unknown | Unknown | PD |
| Page: 1 2 3 4 5 6 7 8 9 |
Top |
Related drugs of malignant transformation related genes |
| Identification of chemicals and drugs interact with genes involved in malignant transfromation |
| (DGIdb 4.0) |
| Entrez ID | Symbol | Category | Interaction Types | Drug Claim Name | Drug Name | PMIDs |
| Page: 1 |

Copyright 2023-Present -The University of Texas Health Science Center at Houston |