
|
|||||
|
 | |
| |
| |
| |
| |
| |
|
Gene: LRRC8B |
Gene summary for LRRC8B |
| Gene information | Species | Human | Gene symbol | LRRC8B | Gene ID | 23507 |
| Gene name | leucine rich repeat containing 8 VRAC subunit B | |
| Gene Alias | TA-LRRP | |
| Cytomap | 1p22.2 | |
| Gene Type | protein-coding | GO ID | GO:0006810 | UniProtAcc | Q6P9F7 |
Top |
Malignant transformation analysis |
| Identification of the aberrant gene expression in precancerous and cancerous lesions by comparing the gene expression of stem-like cells in diseased tissues with normal stem cells |
| Entrez ID | Symbol | Replicates | Species | Organ | Tissue | Adj P-value | Log2FC | Malignancy |
| 23507 | LRRC8B | LZE4T | Human | Esophagus | ESCC | 1.06e-04 | 9.98e-02 | 0.0811 |
| 23507 | LRRC8B | LZE22T | Human | Esophagus | ESCC | 2.26e-02 | 1.50e-01 | 0.068 |
| 23507 | LRRC8B | LZE24T | Human | Esophagus | ESCC | 3.69e-05 | 1.33e-01 | 0.0596 |
| 23507 | LRRC8B | P2T-E | Human | Esophagus | ESCC | 8.02e-12 | 1.62e-01 | 0.1177 |
| 23507 | LRRC8B | P4T-E | Human | Esophagus | ESCC | 5.49e-09 | 1.37e-01 | 0.1323 |
| 23507 | LRRC8B | P5T-E | Human | Esophagus | ESCC | 1.47e-06 | 1.31e-01 | 0.1327 |
| 23507 | LRRC8B | P8T-E | Human | Esophagus | ESCC | 1.48e-05 | 6.48e-02 | 0.0889 |
| 23507 | LRRC8B | P9T-E | Human | Esophagus | ESCC | 4.29e-03 | 1.23e-01 | 0.1131 |
| 23507 | LRRC8B | P10T-E | Human | Esophagus | ESCC | 7.40e-06 | 9.31e-02 | 0.116 |
| 23507 | LRRC8B | P11T-E | Human | Esophagus | ESCC | 6.57e-03 | 7.42e-02 | 0.1426 |
| 23507 | LRRC8B | P12T-E | Human | Esophagus | ESCC | 1.02e-65 | 1.29e+00 | 0.1122 |
| 23507 | LRRC8B | P15T-E | Human | Esophagus | ESCC | 1.63e-11 | 2.22e-01 | 0.1149 |
| 23507 | LRRC8B | P16T-E | Human | Esophagus | ESCC | 2.83e-05 | 1.35e-02 | 0.1153 |
| 23507 | LRRC8B | P20T-E | Human | Esophagus | ESCC | 1.71e-07 | 1.30e-01 | 0.1124 |
| 23507 | LRRC8B | P22T-E | Human | Esophagus | ESCC | 1.97e-02 | -1.84e-02 | 0.1236 |
| 23507 | LRRC8B | P23T-E | Human | Esophagus | ESCC | 1.54e-15 | 2.83e-01 | 0.108 |
| 23507 | LRRC8B | P24T-E | Human | Esophagus | ESCC | 1.62e-04 | 1.95e-02 | 0.1287 |
| 23507 | LRRC8B | P26T-E | Human | Esophagus | ESCC | 5.87e-12 | 3.10e-01 | 0.1276 |
| 23507 | LRRC8B | P27T-E | Human | Esophagus | ESCC | 2.82e-06 | 1.13e-01 | 0.1055 |
| 23507 | LRRC8B | P28T-E | Human | Esophagus | ESCC | 3.15e-11 | 1.87e-01 | 0.1149 |
| Page: 1 2 3 |
| Tissue | Expression Dynamics | Abbreviation |
| Esophagus |  | ESCC: Esophageal squamous cell carcinoma |
| HGIN: High-grade intraepithelial neoplasias | ||
| LGIN: Low-grade intraepithelial neoplasias | ||
| Lung | 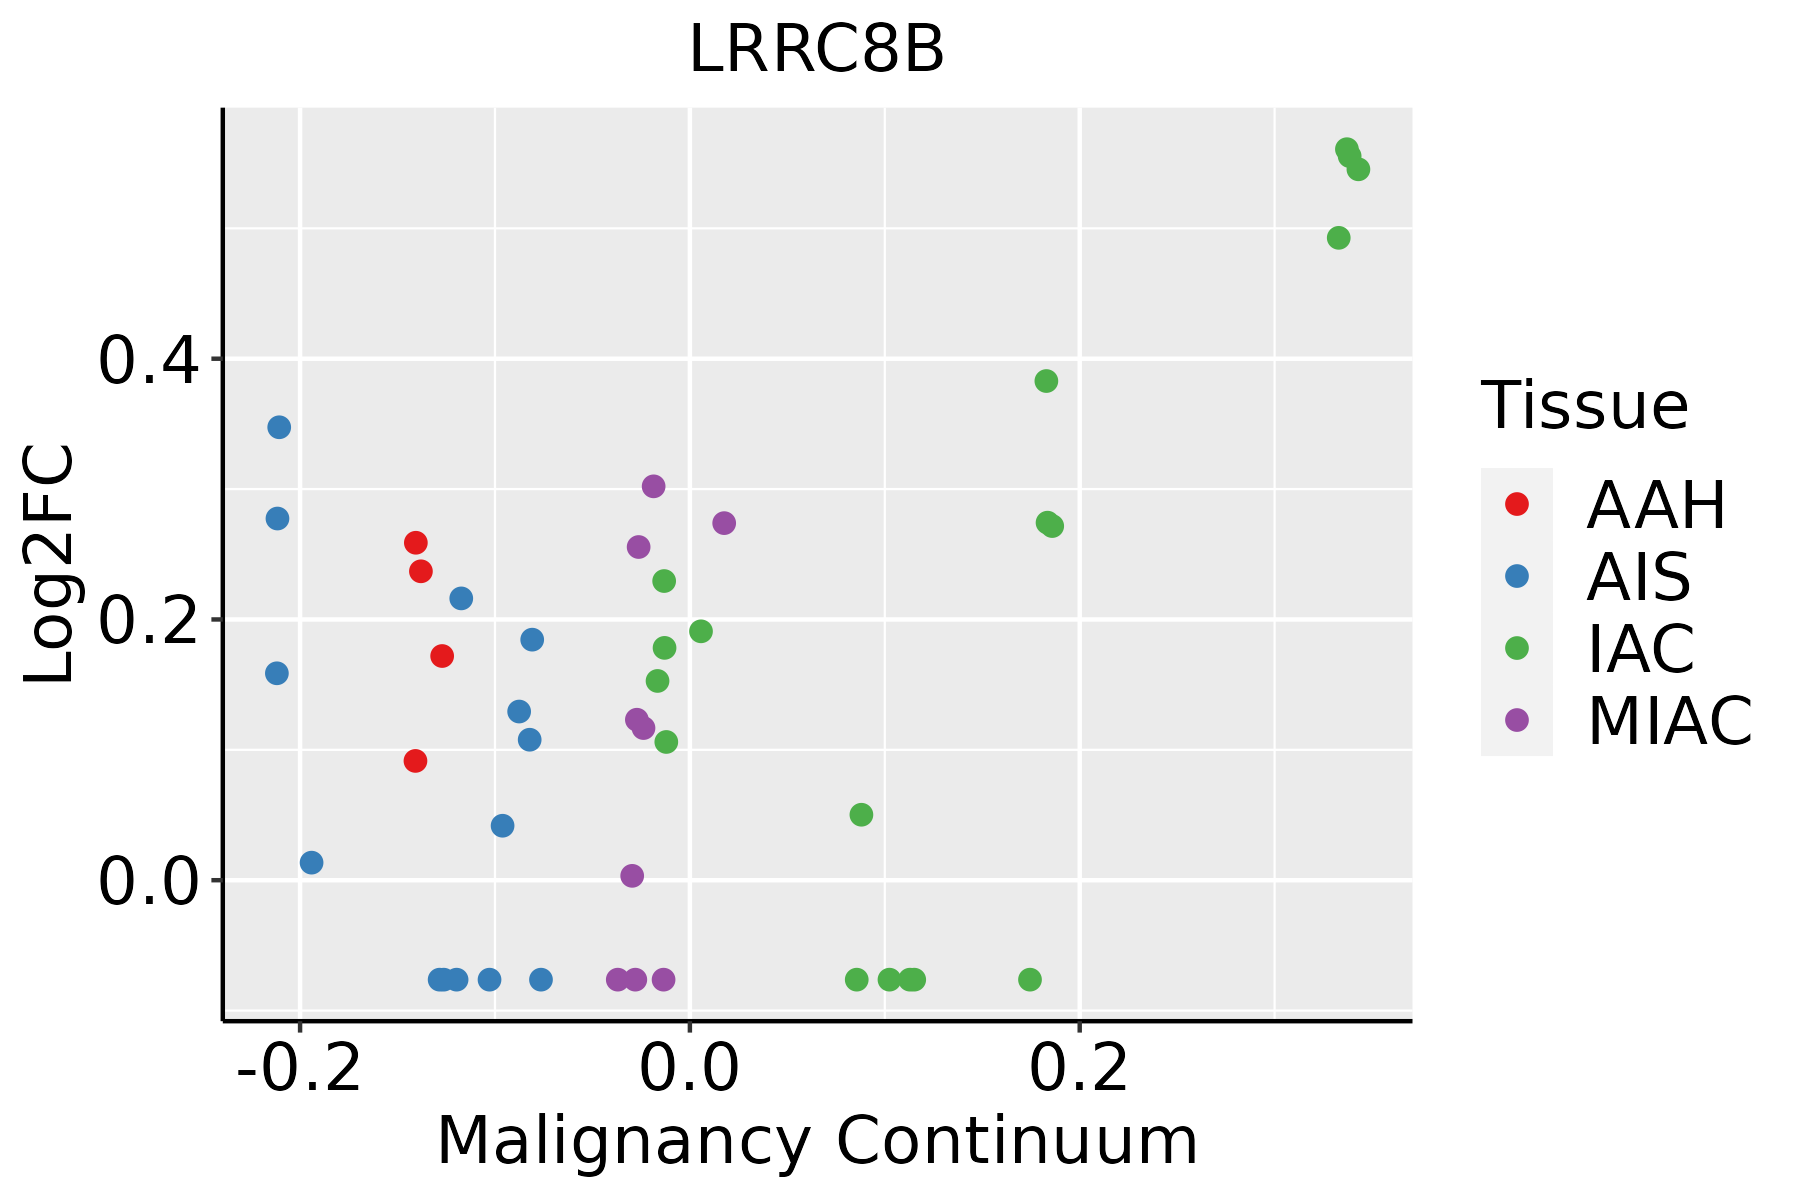 | AAH: Atypical adenomatous hyperplasia |
| AIS: Adenocarcinoma in situ | ||
| IAC: Invasive lung adenocarcinoma | ||
| MIA: Minimally invasive adenocarcinoma |
| ∗log2FC in expression of this searched gene in stem-like cells from each diseased tissue sample relative to stem-like cells in normal samples in each tissue plotted against the malignancy continuum. Samples are colored based on if they are from different disease stage. |
Top |
Malignant transformation related pathway analysis |
| Find out the enriched GO biological processes and KEGG pathways involved in transition from healthy to precancer to cancer |
| Tissue | Disease Stage | Enriched GO biological Processes |
| Colorectum | AD |  |
| Colorectum | SER |  |
| Colorectum | MSS |  |
| Colorectum | MSI-H |  |
| Colorectum | FAP |  |
| ∗Top 15 enriched GO BP terms are showed in the bar plot of each disease state in each tissue. Each row represents a significant GO biological process which is colored according to the -log10(p.adjust). |
| Page: 1 2 3 4 5 6 7 8 9 |
| GO ID | Tissue | Disease Stage | Description | Gene Ratio | Bg Ratio | pvalue | p.adjust | Count |
| Page: 1 |
| Pathway ID | Tissue | Disease Stage | Description | Gene Ratio | Bg Ratio | pvalue | p.adjust | qvalue | Count |
| Page: 1 |
Top |
Cell-cell communication analysis |
| Identification of potential cell-cell interactions between two cell types and their ligand-receptor pairs for different disease states |
| Ligand | Receptor | LRpair | Pathway | Tissue | Disease Stage |
| Page: 1 |
Top |
Single-cell gene regulatory network inference analysis |
| Find out the significant the regulons (TFs) and the target genes of each regulon across cell types for different disease states |
| TF | Cell Type | Tissue | Disease Stage | Target Gene | RSS | Regulon Activity |
| ∗The dot plots of a searched regulon are shown for all cell subpopulations in each disease state of each tissue based on the regulon specific score inferred using pySCENIC and by calculating the average expression. |
| Page: 1 |
Top |
Somatic mutation of malignant transformation related genes |
| Annotation of somatic variants for genes involved in malignant transformation |
| Hugo Symbol | Variant Class | Variant Classification | dbSNP RS | HGVSc | HGVSp | HGVSp Short | SWISSPROT | BIOTYPE | SIFT | PolyPhen | Tumor Sample Barcode | Tissue | Histology | Sex | Age | Stage | Therapy Types | Drugs | Outcome |
| LRRC8B | SNV | Missense_Mutation | c.929N>C | p.Glu310Ala | p.E310A | protein_coding | tolerated(0.29) | benign(0.011) | TCGA-A2-A0SW-01 | Breast | breast invasive carcinoma | Female | >=65 | III/IV | Hormone Therapy | arimidex | PD | ||
| LRRC8B | insertion | Frame_Shift_Ins | novel | c.1186_1187insTCCATATTTT | p.Lys397HisfsTer10 | p.K397Hfs*10 | protein_coding | TCGA-A8-A08H-01 | Breast | breast invasive carcinoma | Female | >=65 | I/II | Unknown | Unknown | SD | |||
| LRRC8B | insertion | Frame_Shift_Ins | novel | c.301_302insCTATAGTTTCAAATGAAACCAGAAGACTTATGTGCCCCTT | p.Gln101ProfsTer19 | p.Q101Pfs*19 | protein_coding | TCGA-B6-A0IM-01 | Breast | breast invasive carcinoma | Female | >=65 | I/II | Unknown | Unknown | SD | |||
| LRRC8B | SNV | Missense_Mutation | rs745355386 | c.1652G>A | p.Arg551Gln | p.R551Q | protein_coding | deleterious(0.01) | possibly_damaging(0.449) | TCGA-2W-A8YY-01 | Cervix | cervical & endocervical cancer | Female | <65 | I/II | Chemotherapy | cisplatin | CR | |
| LRRC8B | SNV | Missense_Mutation | c.587C>T | p.Ser196Leu | p.S196L | protein_coding | tolerated(0.13) | benign(0) | TCGA-C5-A1BE-01 | Cervix | cervical & endocervical cancer | Female | <65 | I/II | Chemotherapy | cisplatin | PD | ||
| LRRC8B | SNV | Missense_Mutation | c.920C>G | p.Ser307Cys | p.S307C | protein_coding | tolerated(0.06) | possibly_damaging(0.79) | TCGA-C5-A1BE-01 | Cervix | cervical & endocervical cancer | Female | <65 | I/II | Chemotherapy | cisplatin | PD | ||
| LRRC8B | SNV | Missense_Mutation | c.2281N>A | p.Glu761Lys | p.E761K | protein_coding | tolerated(0.09) | probably_damaging(0.992) | TCGA-EK-A3GK-01 | Cervix | cervical & endocervical cancer | Female | <65 | I/II | Unknown | Unknown | SD | ||
| LRRC8B | SNV | Missense_Mutation | c.892N>C | p.Gly298Arg | p.G298R | protein_coding | deleterious(0) | probably_damaging(0.998) | TCGA-A6-4107-01 | Colorectum | colon adenocarcinoma | Female | <65 | III/IV | Chemotherapy | 5 | SD | ||
| LRRC8B | SNV | Missense_Mutation | c.1148N>A | p.Arg383His | p.R383H | protein_coding | deleterious(0.03) | probably_damaging(0.991) | TCGA-A6-5666-01 | Colorectum | colon adenocarcinoma | Male | >=65 | I/II | Unknown | Unknown | PD | ||
| LRRC8B | SNV | Missense_Mutation | c.92T>A | p.Ile31Asn | p.I31N | protein_coding | deleterious(0) | benign(0.404) | TCGA-AA-3510-01 | Colorectum | colon adenocarcinoma | Male | >=65 | I/II | Unknown | Unknown | SD |
| Page: 1 2 3 4 5 6 7 8 |
Top |
Related drugs of malignant transformation related genes |
| Identification of chemicals and drugs interact with genes involved in malignant transfromation |
| (DGIdb 4.0) |
| Entrez ID | Symbol | Category | Interaction Types | Drug Claim Name | Drug Name | PMIDs |
| Page: 1 |

Copyright 2023-Present -The University of Texas Health Science Center at Houston |