Schematic overview of the cellular and molecular mechanisms involved in the cancer progression, including the proposed cellular and molecular mechanisms in cancer cells trajectory. AT1: alveolar type 1 cells; AT2: alveolar type 2 cells; AAH: atypical adenomatous hyperplasia; AIS: adenocarcinoma in situ; MIA: minimally invasive adenocarcinoma; IA: invasive adenocarcinoma; EMT: epithelial-mesenchymal transition

Home

Download

Statistics

Help

Contact

Center for Computational Systems Medicine
leaf

Gene summary

leaf

Malignant transformation analysis

leaf

Malignant transformation related pathway analysis

leaf

Cell-cell communication analysis

leaf

Single-cell gene regulatory network inference analysis

leaf

Somatic mutation of malignant transformation related genes

leaf

Related drugs of malignant transformation related genes

Gene: LRRC8A

Gene summary for LRRC8A

check button Gene summary.

Gene informationSpeciesHuman
Gene symbol

LRRC8A

Gene ID

56262

Gene nameleucine rich repeat containing 8 VRAC subunit A
Gene AliasAGM5
Cytomap9q34.11
Gene Typeprotein-coding
GO ID

GO:0000003

UniProtAcc

A0A024R892


Top

Malignant transformation analysis

check button Identification of the aberrant gene expression in precancerous and cancerous lesions by comparing the gene expression of stem-like cells in diseased tissues with normal stem cells
check button Malignant transformation involving gene list.
Entrez IDSymbolReplicatesSpeciesOrganTissueAdj P-valueLog2FCMalignancy
56262LRRC8ALZE2DHumanEsophagusHGIN3.20e-02-3.10e-010.0642
56262LRRC8ALZE4THumanEsophagusESCC2.67e-08-2.65e-010.0811
56262LRRC8ALZE5THumanEsophagusESCC1.76e-05-8.30e-020.0514
56262LRRC8ALZE7THumanEsophagusESCC2.47e-043.24e-020.0667
56262LRRC8ALZE22D1HumanEsophagusHGIN1.38e-05-3.73e-010.0595
56262LRRC8ALZE24THumanEsophagusESCC2.18e-052.77e-010.0596
56262LRRC8AP2T-EHumanEsophagusESCC4.38e-131.91e-020.1177
56262LRRC8AP4T-EHumanEsophagusESCC1.44e-076.09e-020.1323
56262LRRC8AP5T-EHumanEsophagusESCC4.42e-14-1.81e-010.1327
56262LRRC8AP8T-EHumanEsophagusESCC1.88e-152.98e-010.0889
56262LRRC8AP9T-EHumanEsophagusESCC7.57e-082.05e-010.1131
56262LRRC8AP10T-EHumanEsophagusESCC1.79e-113.23e-010.116
56262LRRC8AP12T-EHumanEsophagusESCC1.39e-032.68e-010.1122
56262LRRC8AP15T-EHumanEsophagusESCC4.03e-155.87e-010.1149
56262LRRC8AP16T-EHumanEsophagusESCC6.39e-19-4.31e-010.1153
56262LRRC8AP17T-EHumanEsophagusESCC2.98e-03-1.72e-010.1278
56262LRRC8AP19T-EHumanEsophagusESCC5.76e-09-2.28e-010.1662
56262LRRC8AP20T-EHumanEsophagusESCC1.58e-11-1.51e-010.1124
56262LRRC8AP21T-EHumanEsophagusESCC3.71e-052.62e-010.1617
56262LRRC8AP22T-EHumanEsophagusESCC8.20e-09-2.73e-020.1236
Page: 1 2 3 4 5 6 

check button Transcriptomic changes along malignancy continuum.
TissueExpression DynamicsAbbreviation
EsophagusThe image shows the transcriptomic changes along malignancy continuum.log2FC in expression of this searched gene in stem-like cells from each diseased tissue sample relative to stem-like cells in normal samples in each tissue plotted against the malignancy continuum. Samples are colored based on if they are from different disease stage.
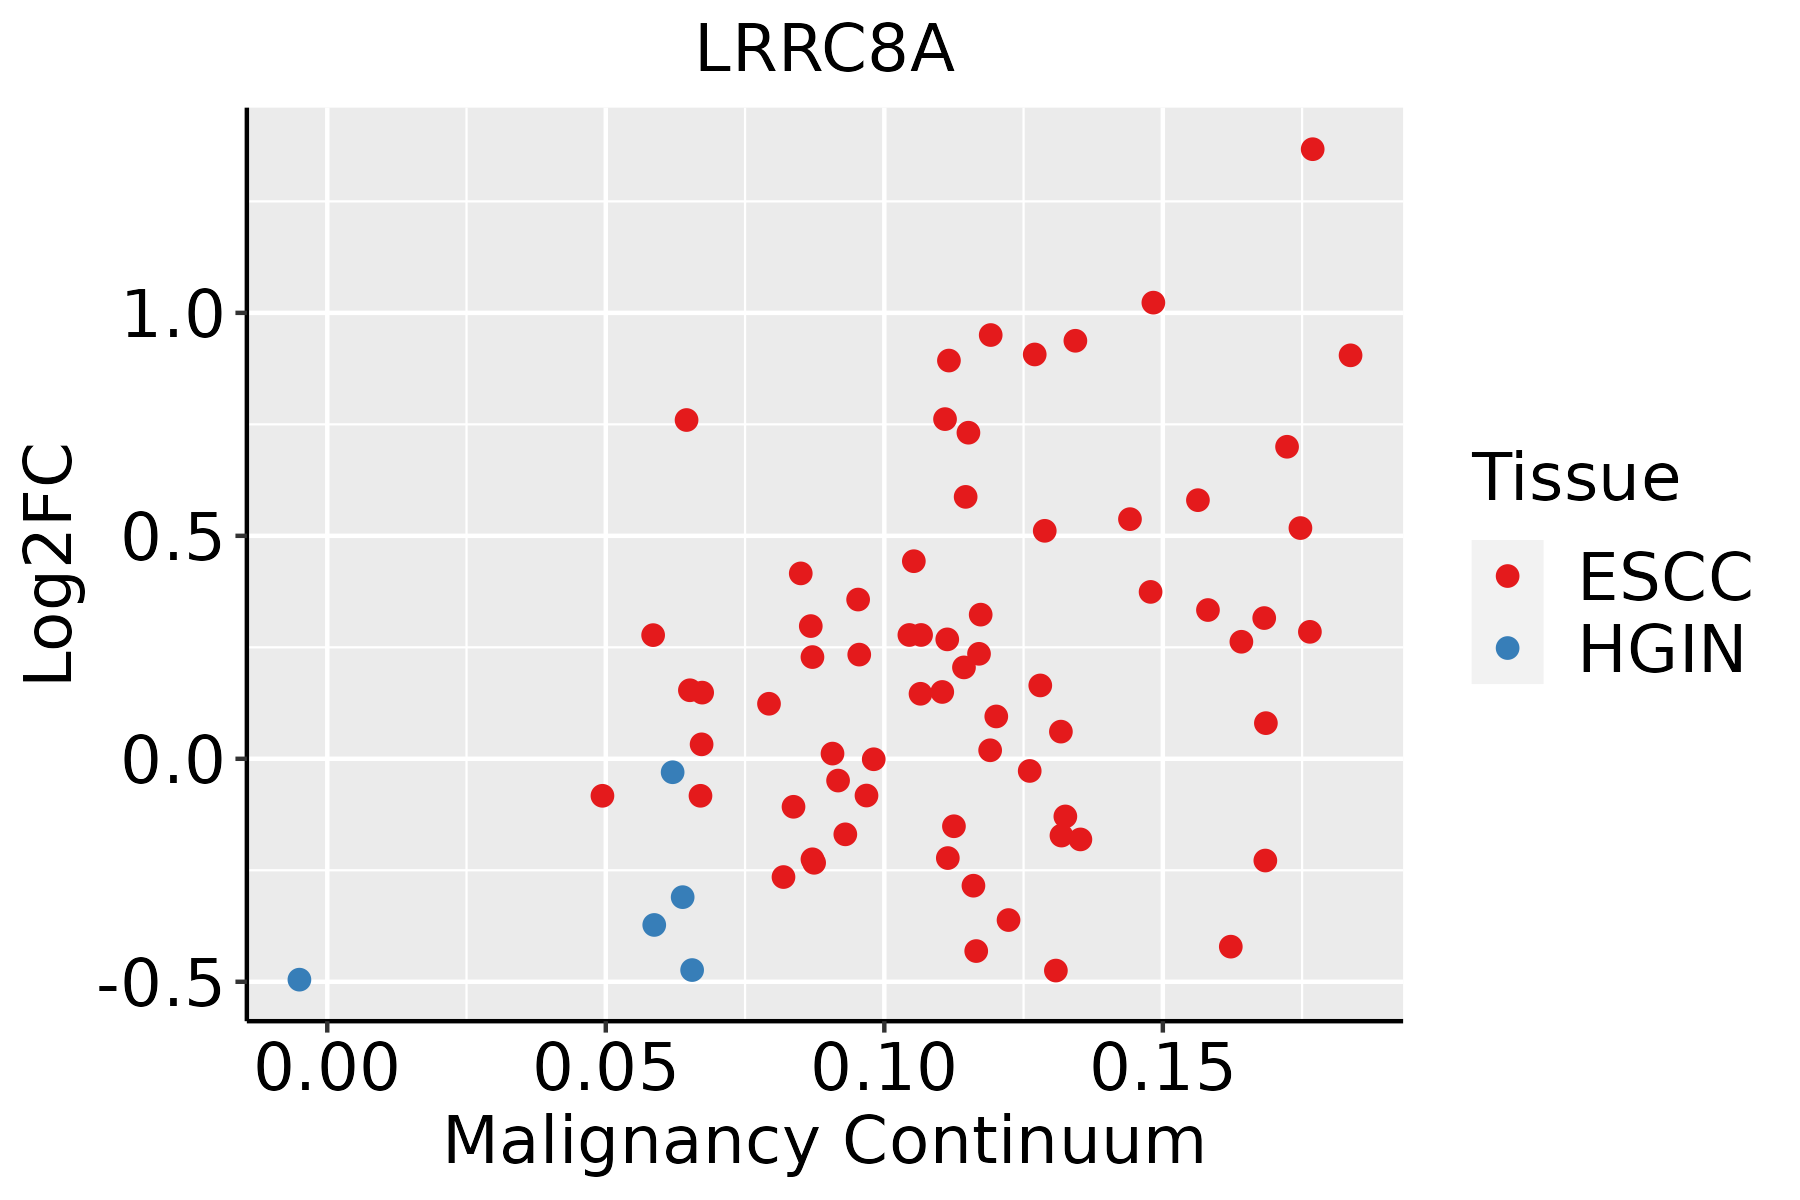
ESCC: Esophageal squamous cell carcinoma
HGIN: High-grade intraepithelial neoplasias
LGIN: Low-grade intraepithelial neoplasias
LiverThe image shows the transcriptomic changes along malignancy continuum.log2FC in expression of this searched gene in stem-like cells from each diseased tissue sample relative to stem-like cells in normal samples in each tissue plotted against the malignancy continuum. Samples are colored based on if they are from different disease stage.
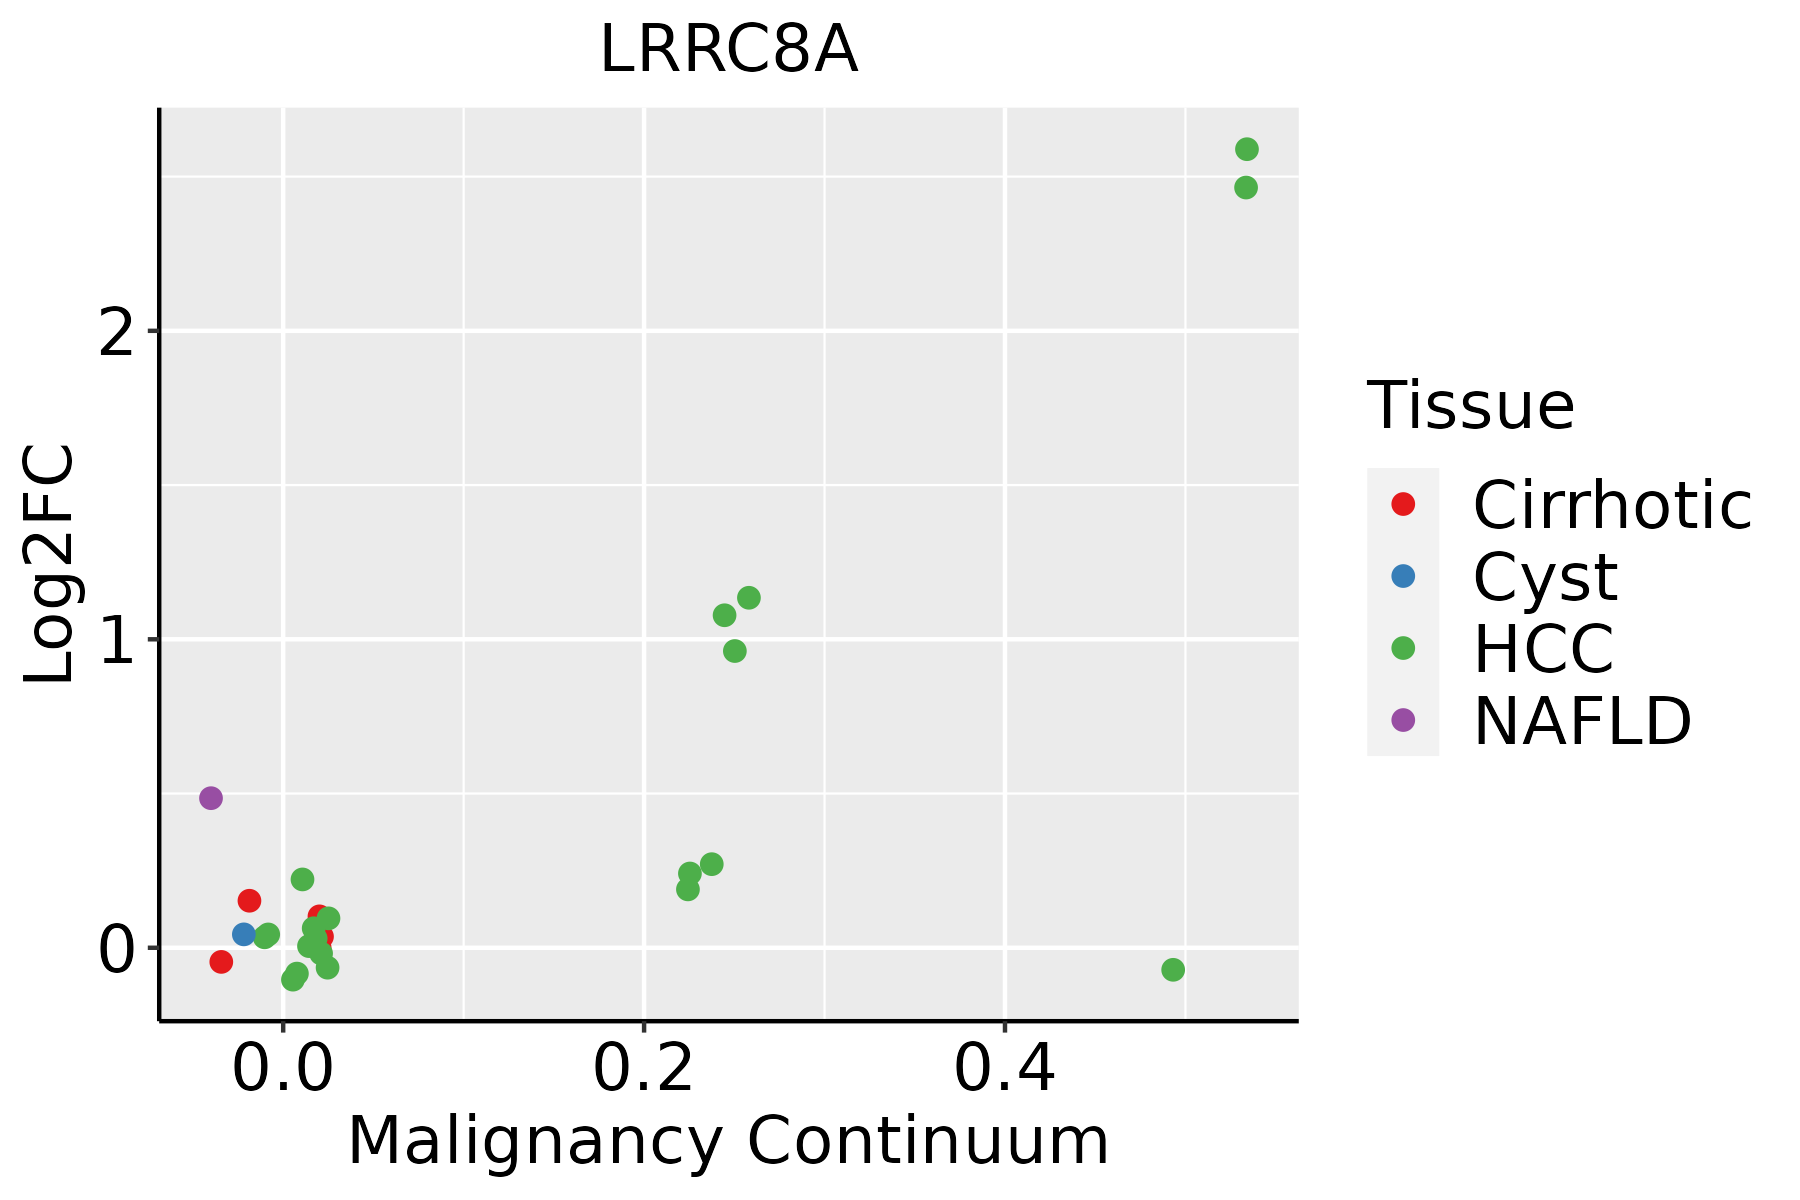
HCC: Hepatocellular carcinoma
NAFLD: Non-alcoholic fatty liver disease
Oral CavityThe image shows the transcriptomic changes along malignancy continuum.log2FC in expression of this searched gene in stem-like cells from each diseased tissue sample relative to stem-like cells in normal samples in each tissue plotted against the malignancy continuum. Samples are colored based on if they are from different disease stage.
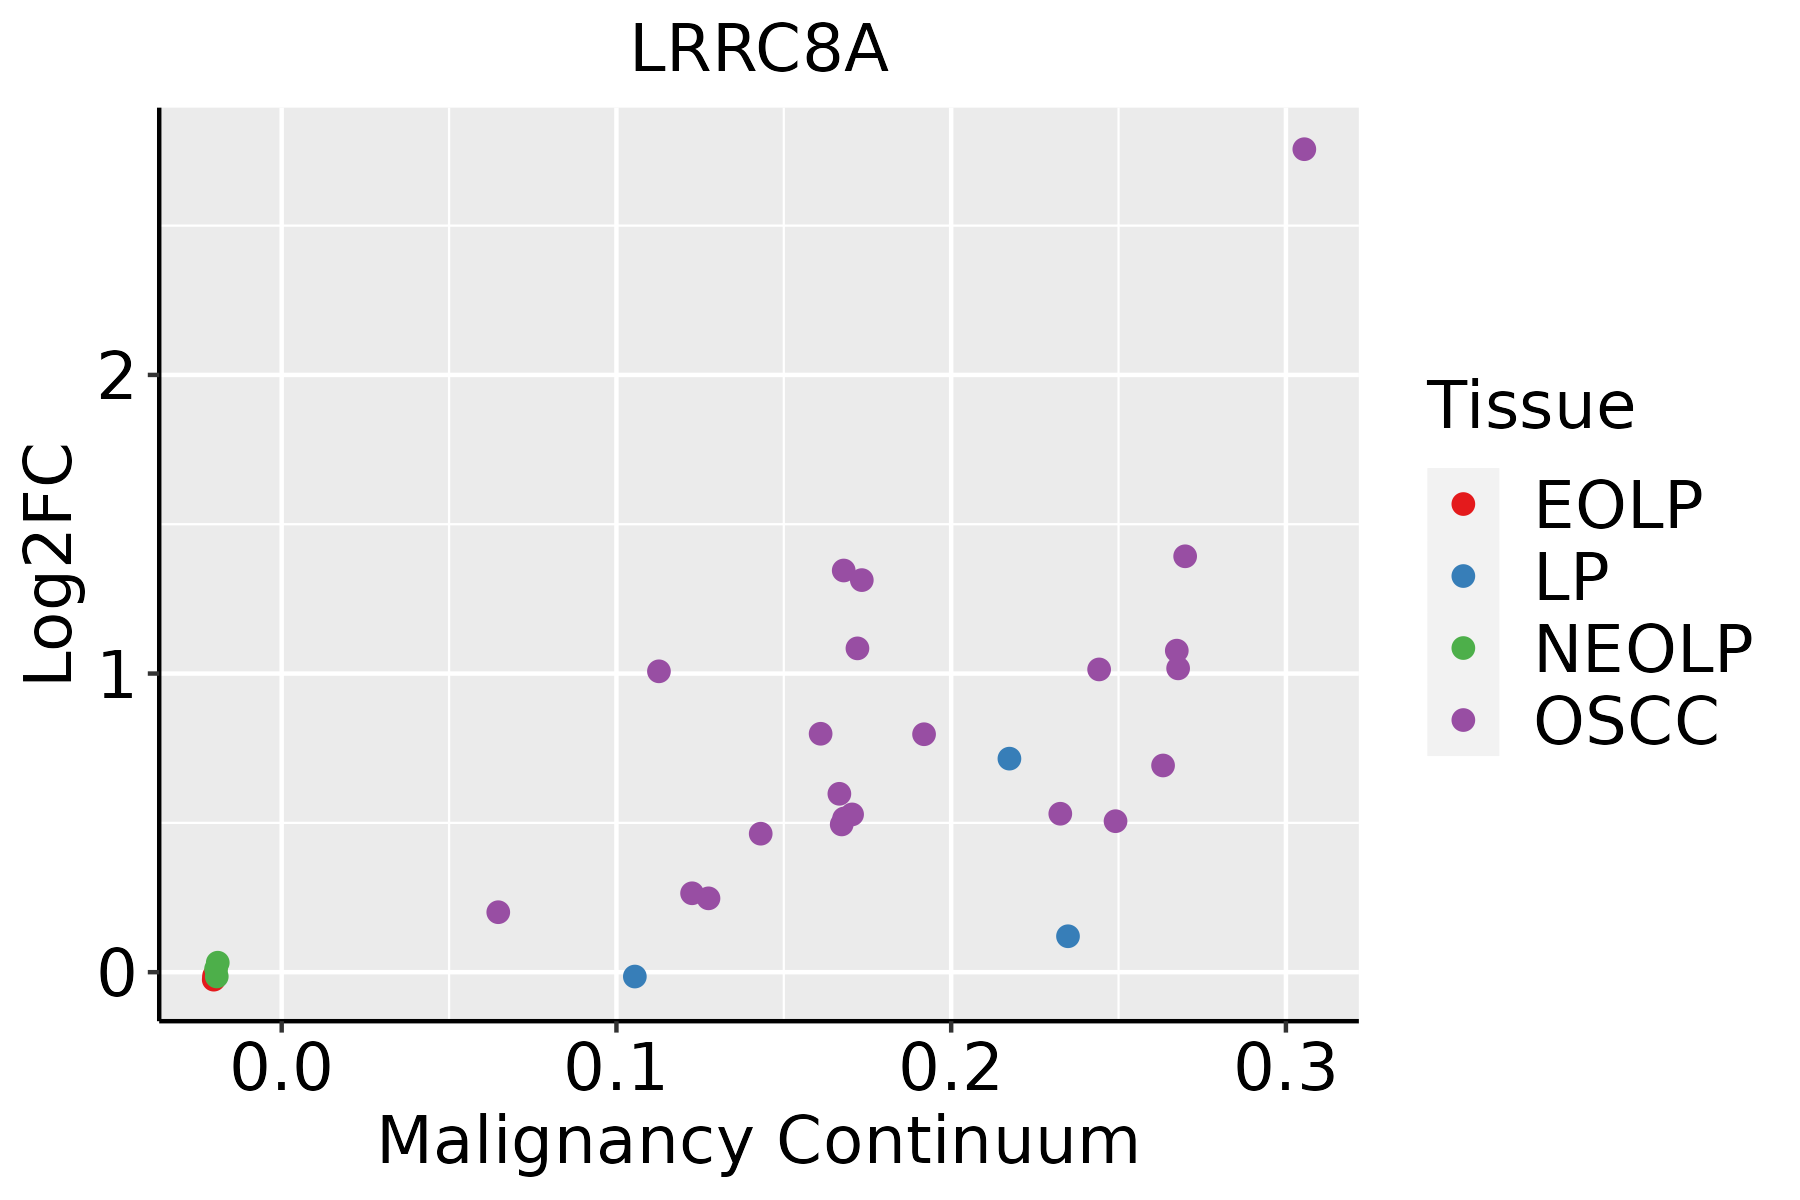
EOLP: Erosive Oral lichen planus
LP: leukoplakia
NEOLP: Non-erosive oral lichen planus
OSCC: Oral squamous cell carcinoma
ThyroidThe image shows the transcriptomic changes along malignancy continuum.log2FC in expression of this searched gene in stem-like cells from each diseased tissue sample relative to stem-like cells in normal samples in each tissue plotted against the malignancy continuum. Samples are colored based on if they are from different disease stage.
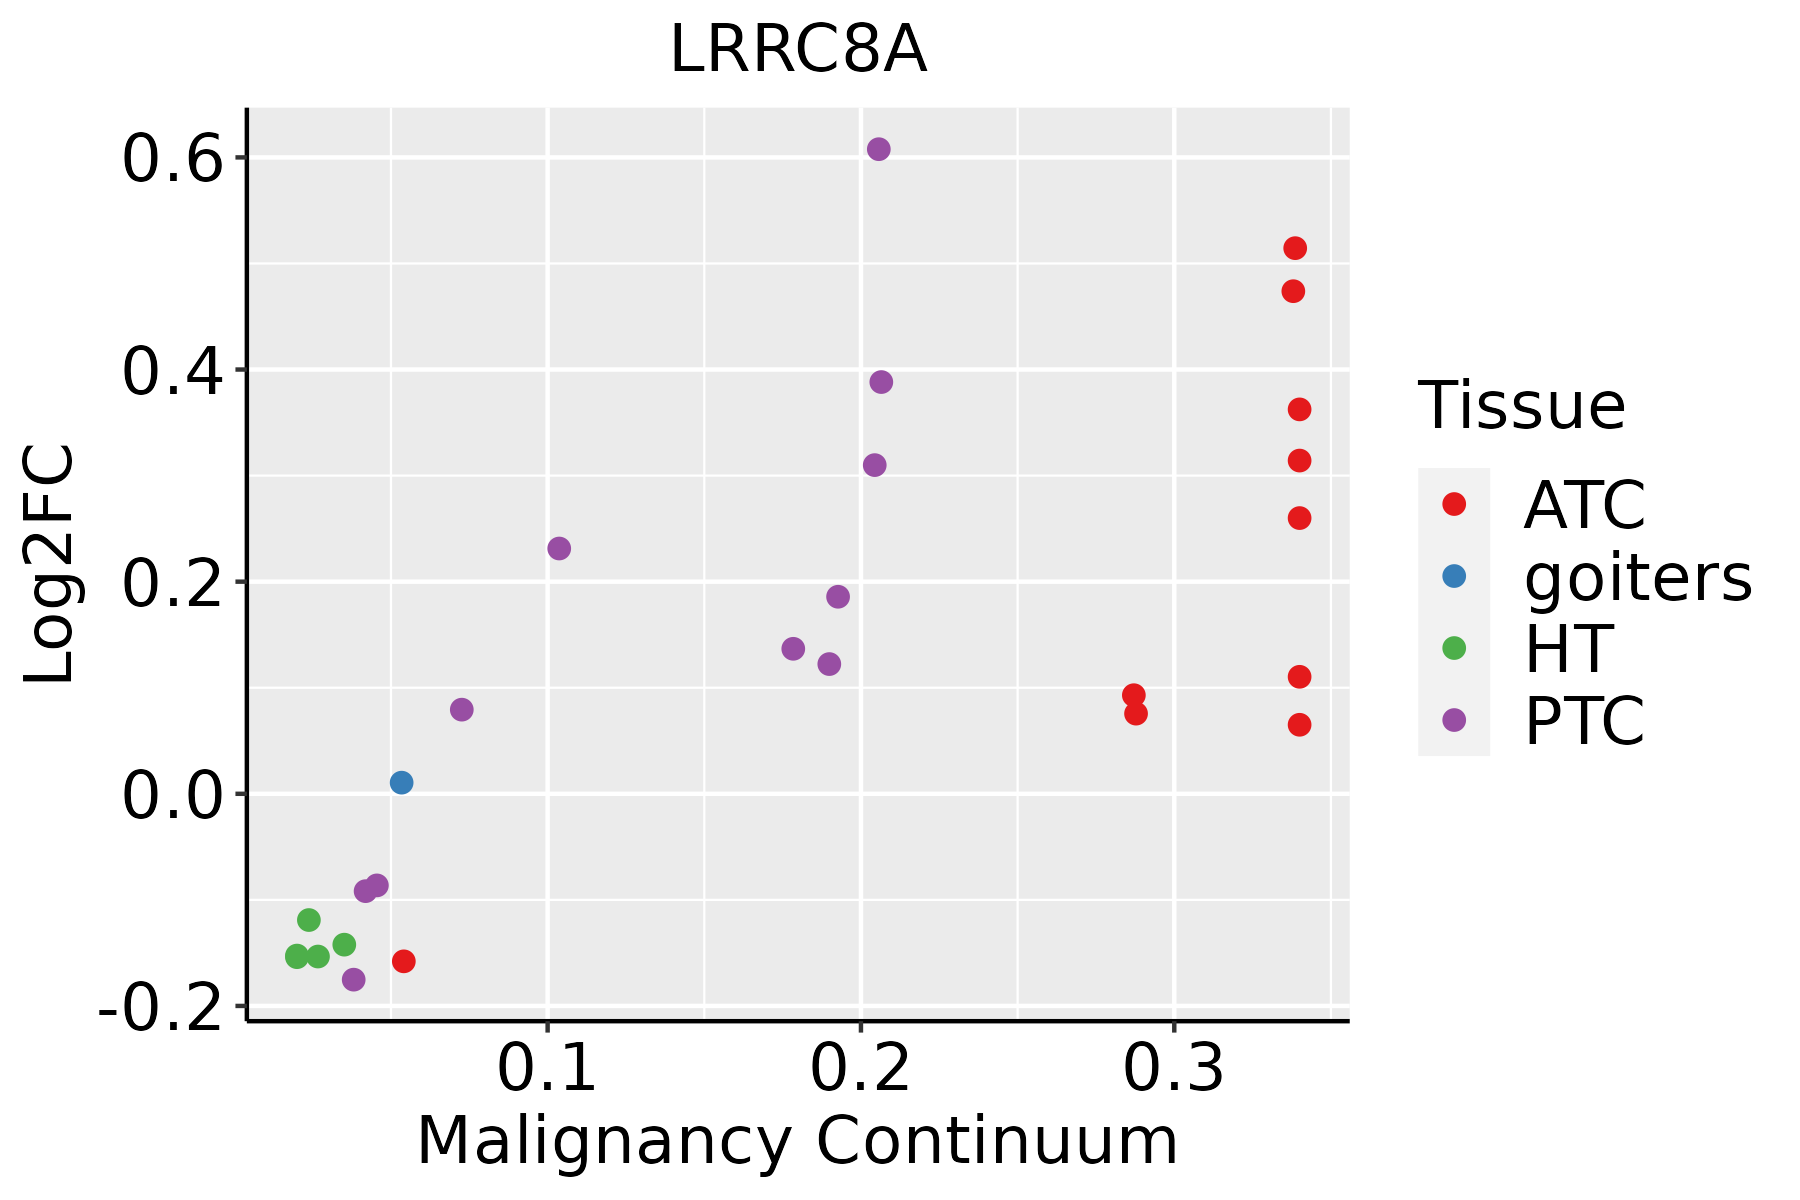
ATC: Anaplastic thyroid cancer
HT: Hashimoto's thyroiditis
PTC: Papillary thyroid cancer
∗log2FC in expression of this searched gene in stem-like cells from each diseased tissue sample relative to stem-like cells in normal samples in each tissue plotted against the malignancy continuum. Samples are colored based on if they are from different disease stage.

Top

Malignant transformation related pathway analysis

check buttonFind out the enriched GO biological processes and KEGG pathways involved in transition from healthy to precancer to cancer
check button Figure of enriched GO biological processes.
TissueDisease StageEnriched GO biological Processes
ColorectumADGO analysis - Figure of enriched GO biological processes: Top 15 enriched GO BP terms are showed in the bar plot of each disease state in each tissue. Each row represents a significant GO biological process which is colored according to the -log10(p.adjust).
ColorectumSERGO analysis - Figure of enriched GO biological processes: Top 15 enriched GO BP terms are showed in the bar plot of each disease state in each tissue. Each row represents a significant GO biological process which is colored according to the -log10(p.adjust).
ColorectumMSSGO analysis - Figure of enriched GO biological processes: Top 15 enriched GO BP terms are showed in the bar plot of each disease state in each tissue. Each row represents a significant GO biological process which is colored according to the -log10(p.adjust).
ColorectumMSI-HGO analysis - Figure of enriched GO biological processes: Top 15 enriched GO BP terms are showed in the bar plot of each disease state in each tissue. Each row represents a significant GO biological process which is colored according to the -log10(p.adjust).
ColorectumFAPGO analysis - Figure of enriched GO biological processes: Top 15 enriched GO BP terms are showed in the bar plot of each disease state in each tissue. Each row represents a significant GO biological process which is colored according to the -log10(p.adjust).
∗Top 15 enriched GO BP terms are showed in the bar plot of each disease state in each tissue. Each row represents a significant GO biological process which is colored according to the -log10(p.adjust).
Page: 1 2 3 4 5 6 7 8 9 

check button Enriched GO biological processes.
GO IDTissueDisease StageDescriptionGene RatioBg Ratiopvaluep.adjustCount
GO:001593116EsophagusHGINnucleobase-containing compound transport57/2587222/187231.76e-066.52e-0557
GO:190495120EsophagusHGINpositive regulation of establishment of protein localization73/2587319/187236.99e-062.14e-0473
GO:005122220EsophagusHGINpositive regulation of protein transport67/2587303/187235.13e-051.22e-0367
GO:001593117EsophagusESCCnucleobase-containing compound transport162/8552222/187239.87e-177.93e-15162
GO:1904951111EsophagusESCCpositive regulation of establishment of protein localization216/8552319/187231.01e-156.86e-14216
GO:0051222111EsophagusESCCpositive regulation of protein transport204/8552303/187231.56e-148.38e-13204
GO:003253520EsophagusESCCregulation of cellular component size227/8552383/187234.77e-088.60e-07227
GO:00069707EsophagusESCCresponse to osmotic stress57/855284/187233.26e-052.70e-0457
GO:00083619EsophagusESCCregulation of cell size107/8552181/187231.81e-041.16e-03107
GO:19031317EsophagusESCCmononuclear cell differentiation226/8552426/187231.20e-035.88e-03226
GO:00454454EsophagusESCCmyoblast differentiation52/855284/187231.98e-038.90e-0352
GO:000930617EsophagusESCCprotein secretion190/8552359/187233.22e-031.34e-02190
GO:00512592EsophagusESCCprotein complex oligomerization130/8552238/187233.29e-031.36e-02130
GO:003559217EsophagusESCCestablishment of protein localization to extracellular region190/8552360/187233.77e-031.53e-02190
GO:007169210EsophagusESCCprotein localization to extracellular region193/8552368/187235.01e-031.92e-02193
GO:005070810EsophagusESCCregulation of protein secretion142/8552268/187239.31e-033.24e-02142
GO:005071416EsophagusESCCpositive regulation of protein secretion76/8552137/187231.32e-024.31e-0276
GO:00300984EsophagusESCClymphocyte differentiation192/8552374/187231.52e-024.93e-02192
GO:00512227LiverNAFLDpositive regulation of protein transport55/1882303/187231.07e-053.35e-0455
GO:19049517LiverNAFLDpositive regulation of establishment of protein localization55/1882319/187234.79e-051.14e-0355
Page: 1 2 3 4 5 

check button Enriched KEGG pathways.
Pathway IDTissueDisease StageDescriptionGene RatioBg Ratiopvaluep.adjustqvalueCount
Page: 1 

Top

Cell-cell communication analysis

check buttonIdentification of potential cell-cell interactions between two cell types and their ligand-receptor pairs for different disease states
LigandReceptorLRpairPathwayTissueDisease Stage
Page: 1 

Top

Single-cell gene regulatory network inference analysis

check buttonFind out the significant the regulons (TFs) and the target genes of each regulon across cell types for different disease states
TFCell TypeTissueDisease StageTarget GeneRSSRegulon Activity
∗The dot plots of a searched regulon are shown for all cell subpopulations in each disease state of each tissue based on the regulon specific score inferred using pySCENIC and by calculating the average expression.
Page: 1 

Top

Somatic mutation of malignant transformation related genes

check buttonAnnotation of somatic variants for genes involved in malignant transformation
Hugo SymbolVariant ClassVariant ClassificationdbSNP RSHGVScHGVSpHGVSp ShortSWISSPROTBIOTYPESIFTPolyPhenTumor Sample BarcodeTissueHistologySexAgeStageTherapy TypesDrugsOutcome
LRRC8ASNVMissense_Mutationnovelc.706N>Ap.Glu236Lysp.E236KQ8IWT6protein_codingdeleterious(0)probably_damaging(0.993)TCGA-3C-AALI-01Breastbreast invasive carcinomaFemale<65I/IIUnspecificPoly EComplete Response
LRRC8ASNVMissense_Mutationc.1826C>Gp.Ser609Cysp.S609CQ8IWT6protein_codingdeleterious(0)probably_damaging(0.999)TCGA-A1-A0SH-01Breastbreast invasive carcinomaFemale<65I/IIChemotherapytcSD
LRRC8ASNVMissense_Mutationnovelc.1346A>Gp.Glu449Glyp.E449GQ8IWT6protein_codingdeleterious(0)possibly_damaging(0.787)TCGA-AO-A128-01Breastbreast invasive carcinomaFemale<65I/IIChemotherapydoxorubicinSD
LRRC8ASNVMissense_Mutationc.1784A>Cp.Glu595Alap.E595AQ8IWT6protein_codingtolerated(0.18)benign(0.195)TCGA-AO-A128-01Breastbreast invasive carcinomaFemale<65I/IIChemotherapydoxorubicinSD
LRRC8ASNVMissense_Mutationc.1789N>Cp.Glu597Glnp.E597QQ8IWT6protein_codingdeleterious(0)benign(0.209)TCGA-AR-A1AO-01Breastbreast invasive carcinomaFemale<65I/IIChemotherapydoxorubicinSD
LRRC8AinsertionFrame_Shift_Insnovelc.402_403insTTTTp.Ile135PhefsTer70p.I135Ffs*70Q8IWT6protein_codingTCGA-A8-A06Q-01Breastbreast invasive carcinomaFemale<65III/IVUnknownUnknownSD
LRRC8AinsertionFrame_Shift_Insnovelc.403_404insGGCTGAGACTGAGGTTTp.Ile135ArgfsTer33p.I135Rfs*33Q8IWT6protein_codingTCGA-A8-A06Q-01Breastbreast invasive carcinomaFemale<65III/IVUnknownUnknownSD
LRRC8AinsertionFrame_Shift_Insnovelc.110_111insTCCCAp.Met37IlefsTer18p.M37Ifs*18Q8IWT6protein_codingTCGA-BH-A0HX-01Breastbreast invasive carcinomaFemale<65I/IIChemotherapyadrimycinSD
LRRC8AinsertionNonsense_Mutationnovelc.111_112insTGAACTGGGAGTTTTAAATGTGTCCCTCTGGTCAp.Ile38Terp.I38*Q8IWT6protein_codingTCGA-BH-A0HX-01Breastbreast invasive carcinomaFemale<65I/IIChemotherapyadrimycinSD
LRRC8ASNVMissense_Mutationc.1416N>Tp.Lys472Asnp.K472NQ8IWT6protein_codingdeleterious(0.01)benign(0.006)TCGA-C5-A7UE-01Cervixcervical & endocervical cancerFemale<65I/IIChemotherapycisplatinSD
Page: 1 2 3 4 5 6 7 8 9 10 

Top

Related drugs of malignant transformation related genes

check buttonIdentification of chemicals and drugs interact with genes involved in malignant transfromation
(DGIdb 4.0)
Entrez IDSymbolCategoryInteraction TypesDrug Claim NameDrug NamePMIDs
Page: 1