
|
|||||
|
 | |
| |
| |
| |
| |
| |
|
Gene: LRRC75B |
Gene summary for LRRC75B |
| Gene information | Species | Human | Gene symbol | LRRC75B | Gene ID | 388886 |
| Gene name | leucine rich repeat containing 75B | |
| Gene Alias | C22orf36 | |
| Cytomap | 22q11.23 | |
| Gene Type | protein-coding | GO ID | GO:0005575 | UniProtAcc | Q2VPJ9 |
Top |
Malignant transformation analysis |
| Identification of the aberrant gene expression in precancerous and cancerous lesions by comparing the gene expression of stem-like cells in diseased tissues with normal stem cells |
| Entrez ID | Symbol | Replicates | Species | Organ | Tissue | Adj P-value | Log2FC | Malignancy |
| 388886 | LRRC75B | male-WTA | Human | Thyroid | PTC | 8.49e-21 | 2.00e-01 | 0.1037 |
| 388886 | LRRC75B | PTC01 | Human | Thyroid | PTC | 1.41e-10 | 1.66e-01 | 0.1899 |
| 388886 | LRRC75B | PTC04 | Human | Thyroid | PTC | 1.16e-08 | 1.03e-01 | 0.1927 |
| 388886 | LRRC75B | PTC05 | Human | Thyroid | PTC | 1.42e-04 | 1.93e-01 | 0.2065 |
| 388886 | LRRC75B | PTC06 | Human | Thyroid | PTC | 3.65e-16 | 3.75e-01 | 0.2057 |
| 388886 | LRRC75B | PTC07 | Human | Thyroid | PTC | 6.27e-35 | 2.02e-01 | 0.2044 |
| 388886 | LRRC75B | ATC12 | Human | Thyroid | ATC | 5.27e-10 | 5.35e-02 | 0.34 |
| 388886 | LRRC75B | ATC13 | Human | Thyroid | ATC | 1.13e-16 | 2.62e-01 | 0.34 |
| 388886 | LRRC75B | ATC4 | Human | Thyroid | ATC | 4.39e-04 | 5.48e-02 | 0.34 |
| 388886 | LRRC75B | ATC5 | Human | Thyroid | ATC | 3.49e-16 | 2.90e-01 | 0.34 |
| Page: 1 |
| Tissue | Expression Dynamics | Abbreviation |
| Thyroid | 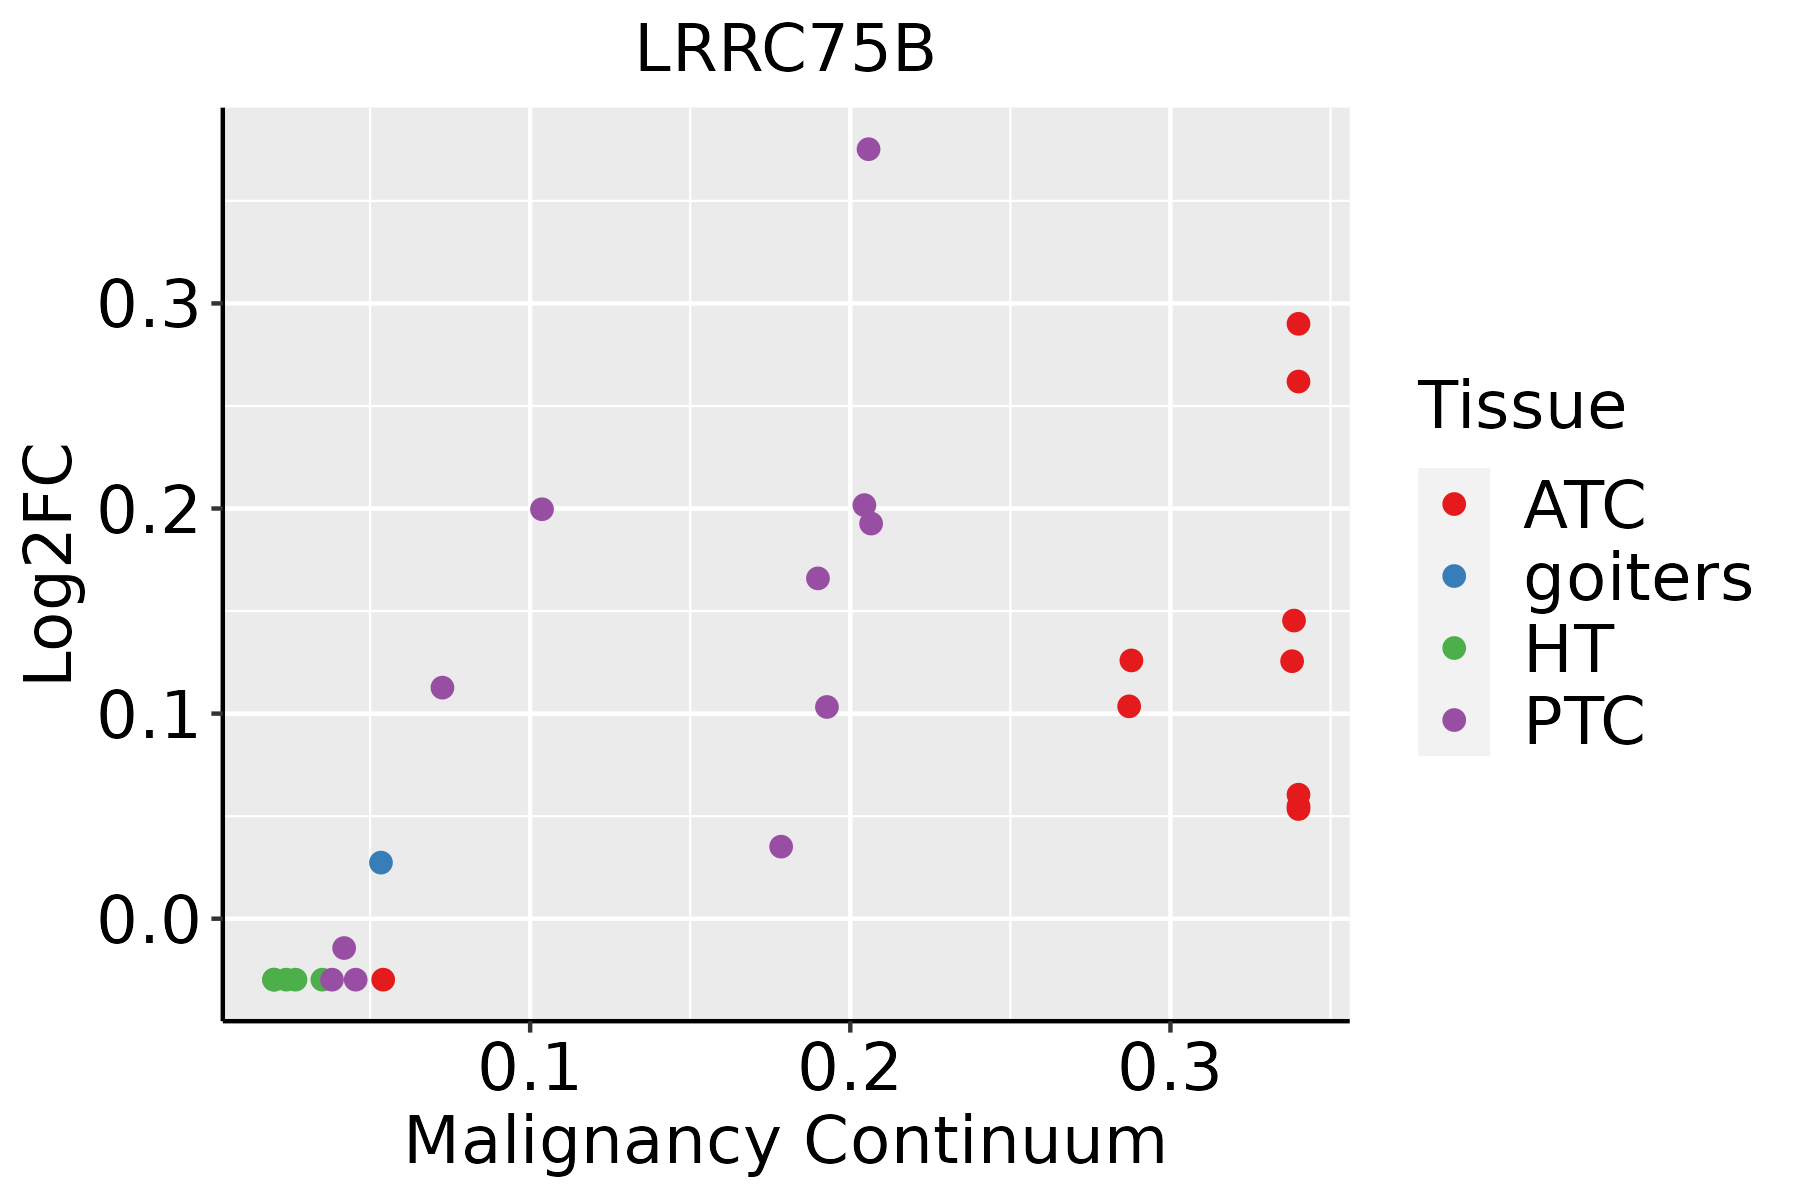 | ATC: Anaplastic thyroid cancer |
| HT: Hashimoto's thyroiditis | ||
| PTC: Papillary thyroid cancer |
| ∗log2FC in expression of this searched gene in stem-like cells from each diseased tissue sample relative to stem-like cells in normal samples in each tissue plotted against the malignancy continuum. Samples are colored based on if they are from different disease stage. |
Top |
Malignant transformation related pathway analysis |
| Find out the enriched GO biological processes and KEGG pathways involved in transition from healthy to precancer to cancer |
| Tissue | Disease Stage | Enriched GO biological Processes |
| Colorectum | AD |  |
| Colorectum | SER |  |
| Colorectum | MSS |  |
| Colorectum | MSI-H |  |
| Colorectum | FAP |  |
| ∗Top 15 enriched GO BP terms are showed in the bar plot of each disease state in each tissue. Each row represents a significant GO biological process which is colored according to the -log10(p.adjust). |
| Page: 1 2 3 4 5 6 7 8 9 |
| GO ID | Tissue | Disease Stage | Description | Gene Ratio | Bg Ratio | pvalue | p.adjust | Count |
| Page: 1 |
| Pathway ID | Tissue | Disease Stage | Description | Gene Ratio | Bg Ratio | pvalue | p.adjust | qvalue | Count |
| Page: 1 |
Top |
Cell-cell communication analysis |
| Identification of potential cell-cell interactions between two cell types and their ligand-receptor pairs for different disease states |
| Ligand | Receptor | LRpair | Pathway | Tissue | Disease Stage |
| Page: 1 |
Top |
Single-cell gene regulatory network inference analysis |
| Find out the significant the regulons (TFs) and the target genes of each regulon across cell types for different disease states |
| TF | Cell Type | Tissue | Disease Stage | Target Gene | RSS | Regulon Activity |
| ∗The dot plots of a searched regulon are shown for all cell subpopulations in each disease state of each tissue based on the regulon specific score inferred using pySCENIC and by calculating the average expression. |
| Page: 1 |
Top |
Somatic mutation of malignant transformation related genes |
| Annotation of somatic variants for genes involved in malignant transformation |
| Hugo Symbol | Variant Class | Variant Classification | dbSNP RS | HGVSc | HGVSp | HGVSp Short | SWISSPROT | BIOTYPE | SIFT | PolyPhen | Tumor Sample Barcode | Tissue | Histology | Sex | Age | Stage | Therapy Types | Drugs | Outcome |
| LRRC75B | SNV | Missense_Mutation | rs202133451 | c.400N>T | p.Arg134Cys | p.R134C | Q2VPJ9 | protein_coding | tolerated(0.12) | benign(0) | TCGA-2W-A8YY-01 | Cervix | cervical & endocervical cancer | Female | <65 | I/II | Chemotherapy | cisplatin | CR |
| LRRC75B | SNV | Missense_Mutation | c.411G>C | p.Lys137Asn | p.K137N | Q2VPJ9 | protein_coding | deleterious(0) | possibly_damaging(0.714) | TCGA-IR-A3LH-01 | Cervix | cervical & endocervical cancer | Female | <65 | I/II | Chemotherapy | cisplatin | CR | |
| LRRC75B | SNV | Missense_Mutation | rs369950570 | c.617N>T | p.Ala206Val | p.A206V | Q2VPJ9 | protein_coding | tolerated(0.15) | benign(0.001) | TCGA-A6-6780-01 | Colorectum | colon adenocarcinoma | Male | >=65 | I/II | Unknown | Unknown | SD |
| LRRC75B | SNV | Missense_Mutation | novel | c.187N>A | p.Leu63Ile | p.L63I | Q2VPJ9 | protein_coding | deleterious(0.03) | probably_damaging(0.937) | TCGA-AA-A010-01 | Colorectum | colon adenocarcinoma | Female | <65 | I/II | Chemotherapy | folinic | CR |
| LRRC75B | SNV | Missense_Mutation | c.715N>T | p.Pro239Ser | p.P239S | Q2VPJ9 | protein_coding | tolerated(0.05) | benign(0.134) | TCGA-AD-6895-01 | Colorectum | colon adenocarcinoma | Male | >=65 | III/IV | Unknown | Unknown | SD | |
| LRRC75B | SNV | Missense_Mutation | c.838N>A | p.Leu280Met | p.L280M | Q2VPJ9 | protein_coding | tolerated(0.06) | benign(0.052) | TCGA-F4-6570-01 | Colorectum | colon adenocarcinoma | Female | >=65 | I/II | Unknown | Unknown | SD | |
| LRRC75B | SNV | Missense_Mutation | rs577321478 | c.517C>T | p.Arg173Cys | p.R173C | Q2VPJ9 | protein_coding | tolerated(0.18) | benign(0.311) | TCGA-A5-A0G2-01 | Endometrium | uterine corpus endometrioid carcinoma | Female | <65 | III/IV | Unknown | Unknown | SD |
| LRRC75B | SNV | Missense_Mutation | c.650N>A | p.Gly217Asp | p.G217D | Q2VPJ9 | protein_coding | deleterious(0) | probably_damaging(0.995) | TCGA-AP-A051-01 | Endometrium | uterine corpus endometrioid carcinoma | Female | >=65 | I/II | Unknown | Unknown | SD | |
| LRRC75B | SNV | Missense_Mutation | c.650G>A | p.Gly217Asp | p.G217D | Q2VPJ9 | protein_coding | deleterious(0) | probably_damaging(0.995) | TCGA-AP-A056-01 | Endometrium | uterine corpus endometrioid carcinoma | Female | <65 | I/II | Unknown | Unknown | SD | |
| LRRC75B | SNV | Missense_Mutation | c.908C>A | p.Ala303Asp | p.A303D | Q2VPJ9 | protein_coding | deleterious(0.03) | possibly_damaging(0.651) | TCGA-AX-A2HD-01 | Endometrium | uterine corpus endometrioid carcinoma | Female | >=65 | III/IV | Unknown | Unknown | SD |
| Page: 1 2 3 |
Top |
Related drugs of malignant transformation related genes |
| Identification of chemicals and drugs interact with genes involved in malignant transfromation |
| (DGIdb 4.0) |
| Entrez ID | Symbol | Category | Interaction Types | Drug Claim Name | Drug Name | PMIDs |
| Page: 1 |

Copyright 2023-Present -The University of Texas Health Science Center at Houston |