
|
|||||
|
 | |
| |
| |
| |
| |
| |
|
Gene: LRRC75A |
Gene summary for LRRC75A |
| Gene information | Species | Human | Gene symbol | LRRC75A | Gene ID | 388341 |
| Gene name | leucine rich repeat containing 75A | |
| Gene Alias | C17orf76 | |
| Cytomap | 17p11.2 | |
| Gene Type | protein-coding | GO ID | GO:0005575 | UniProtAcc | B7ZMA3 |
Top |
Malignant transformation analysis |
| Identification of the aberrant gene expression in precancerous and cancerous lesions by comparing the gene expression of stem-like cells in diseased tissues with normal stem cells |
| Entrez ID | Symbol | Replicates | Species | Organ | Tissue | Adj P-value | Log2FC | Malignancy |
| 388341 | LRRC75A | GSM4909286 | Human | Breast | IDC | 3.28e-04 | 2.62e-01 | 0.1081 |
| 388341 | LRRC75A | GSM4909287 | Human | Breast | IDC | 1.67e-02 | 3.02e-01 | 0.2057 |
| 388341 | LRRC75A | GSM4909293 | Human | Breast | IDC | 8.39e-26 | 5.86e-01 | 0.1581 |
| 388341 | LRRC75A | GSM4909297 | Human | Breast | IDC | 2.42e-10 | 3.41e-01 | 0.1517 |
| 388341 | LRRC75A | GSM4909303 | Human | Breast | IDC | 5.83e-03 | 4.58e-01 | 0.0438 |
| 388341 | LRRC75A | GSM4909311 | Human | Breast | IDC | 1.73e-04 | -1.45e-01 | 0.1534 |
| 388341 | LRRC75A | GSM4909312 | Human | Breast | IDC | 1.09e-02 | -1.70e-01 | 0.1552 |
| 388341 | LRRC75A | GSM4909319 | Human | Breast | IDC | 3.66e-05 | -2.07e-01 | 0.1563 |
| 388341 | LRRC75A | NCCBC2 | Human | Breast | DCIS | 2.38e-02 | 1.62e-01 | 0.1554 |
| 388341 | LRRC75A | NCCBC3 | Human | Breast | DCIS | 1.64e-34 | 8.28e-01 | 0.1198 |
| 388341 | LRRC75A | P1 | Human | Breast | IDC | 6.86e-05 | 1.56e-02 | 0.1527 |
| 388341 | LRRC75A | DCIS2 | Human | Breast | DCIS | 5.90e-26 | 2.00e-01 | 0.0085 |
| 388341 | LRRC75A | GSM5252137_BPH556PrGA2_Fcol | Human | Prostate | BPH | 1.53e-04 | 3.11e-01 | -0.23 |
| 388341 | LRRC75A | 047563_1562-all-cells | Human | Prostate | BPH | 1.72e-12 | 5.00e-01 | 0.0791 |
| 388341 | LRRC75A | Dong_P1 | Human | Prostate | Tumor | 1.87e-04 | 5.33e-02 | 0.035 |
| 388341 | LRRC75A | Dong_P3 | Human | Prostate | Tumor | 6.46e-05 | 1.21e-01 | 0.0278 |
| 388341 | LRRC75A | P7 | Human | Prostate | Tumor | 7.64e-03 | 5.70e-01 | -0.1025 |
| 388341 | LRRC75A | P10 | Human | Prostate | Tumor | 1.74e-03 | 3.94e-01 | -0.0902 |
| 388341 | LRRC75A | male-WTA | Human | Thyroid | PTC | 7.32e-16 | 8.29e-02 | 0.1037 |
| 388341 | LRRC75A | PTC01 | Human | Thyroid | PTC | 3.60e-03 | 5.33e-02 | 0.1899 |
| Page: 1 2 |
| Tissue | Expression Dynamics | Abbreviation |
| Breast | 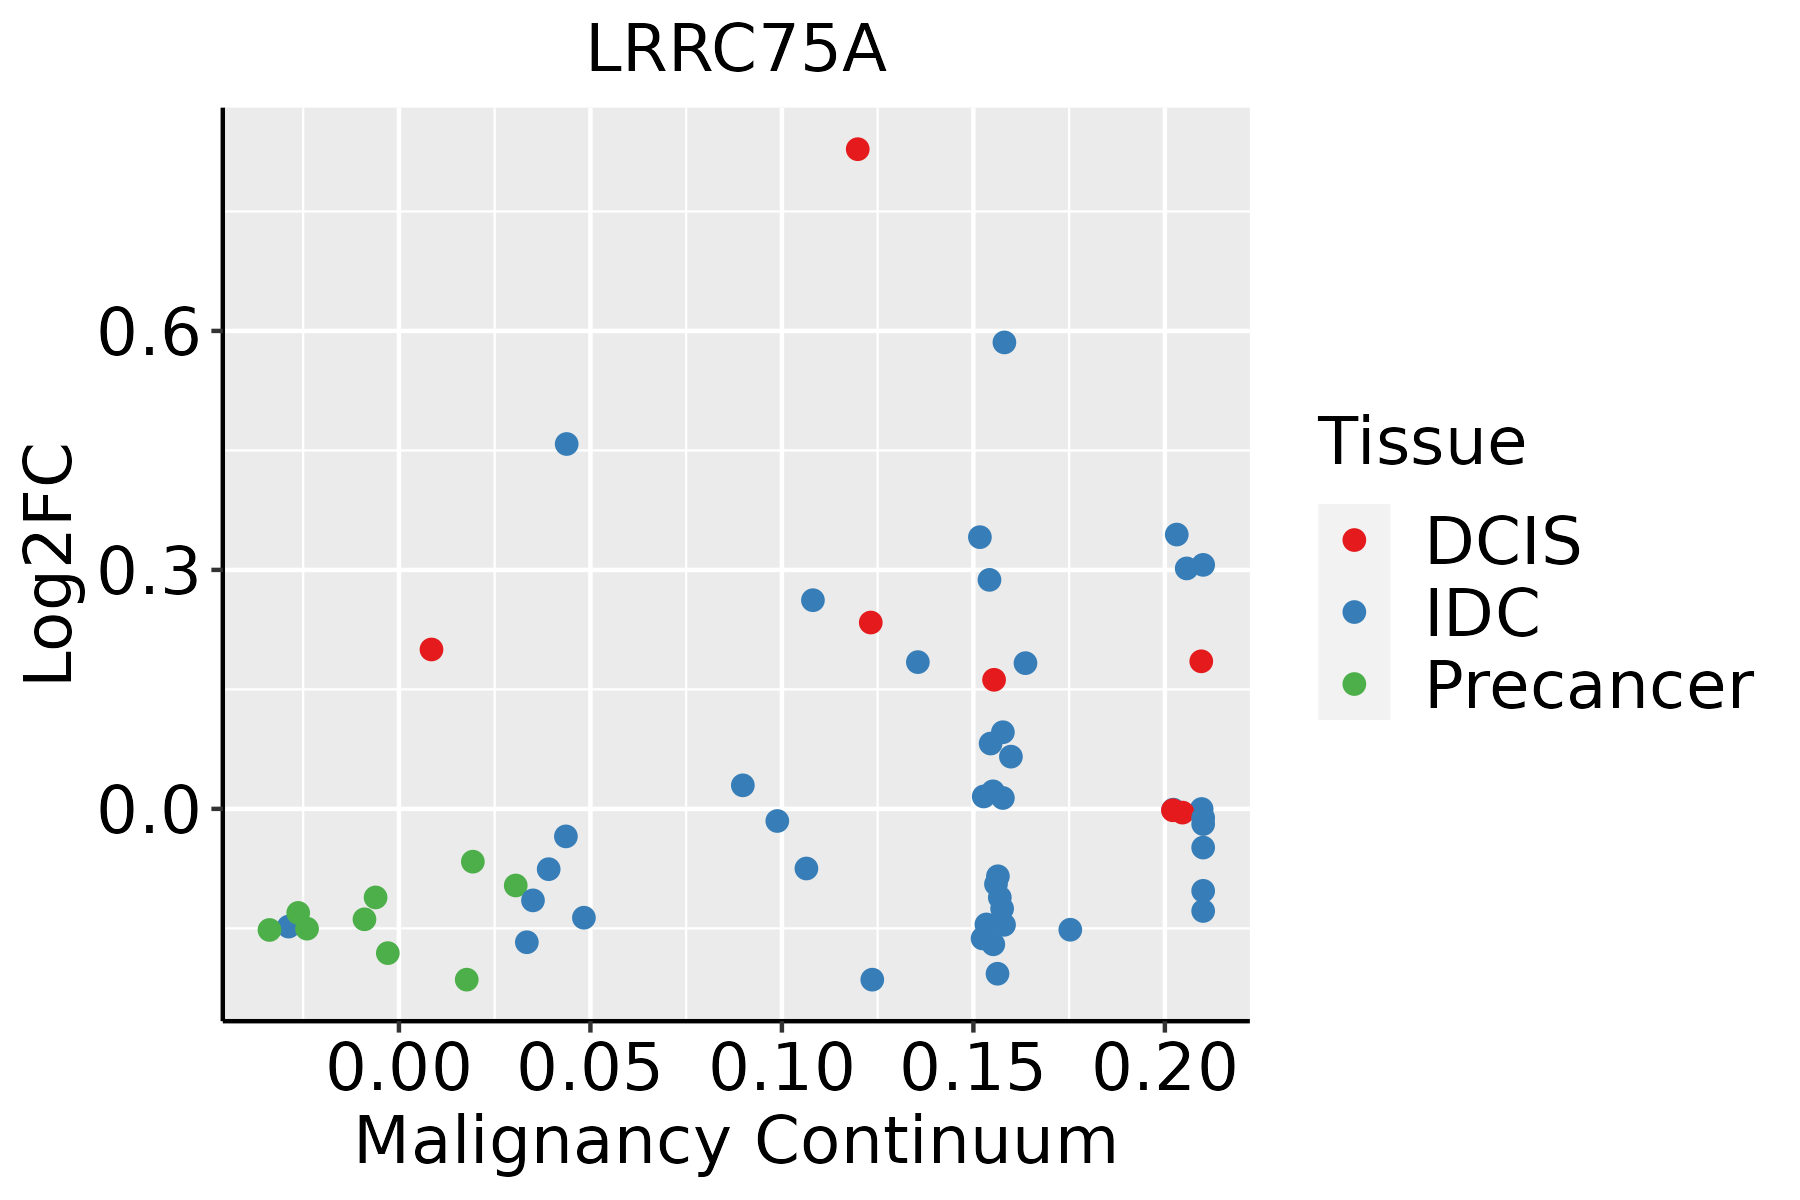 | IDC: Invasive ductal carcinoma |
| DCIS: Ductal carcinoma in situ | ||
| Precancer(BRCA1-mut): Precancerous lesion from BRCA1 mutation carriers | ||
| Prostate |  | BPH: Benign Prostatic Hyperplasia |
| Thyroid | 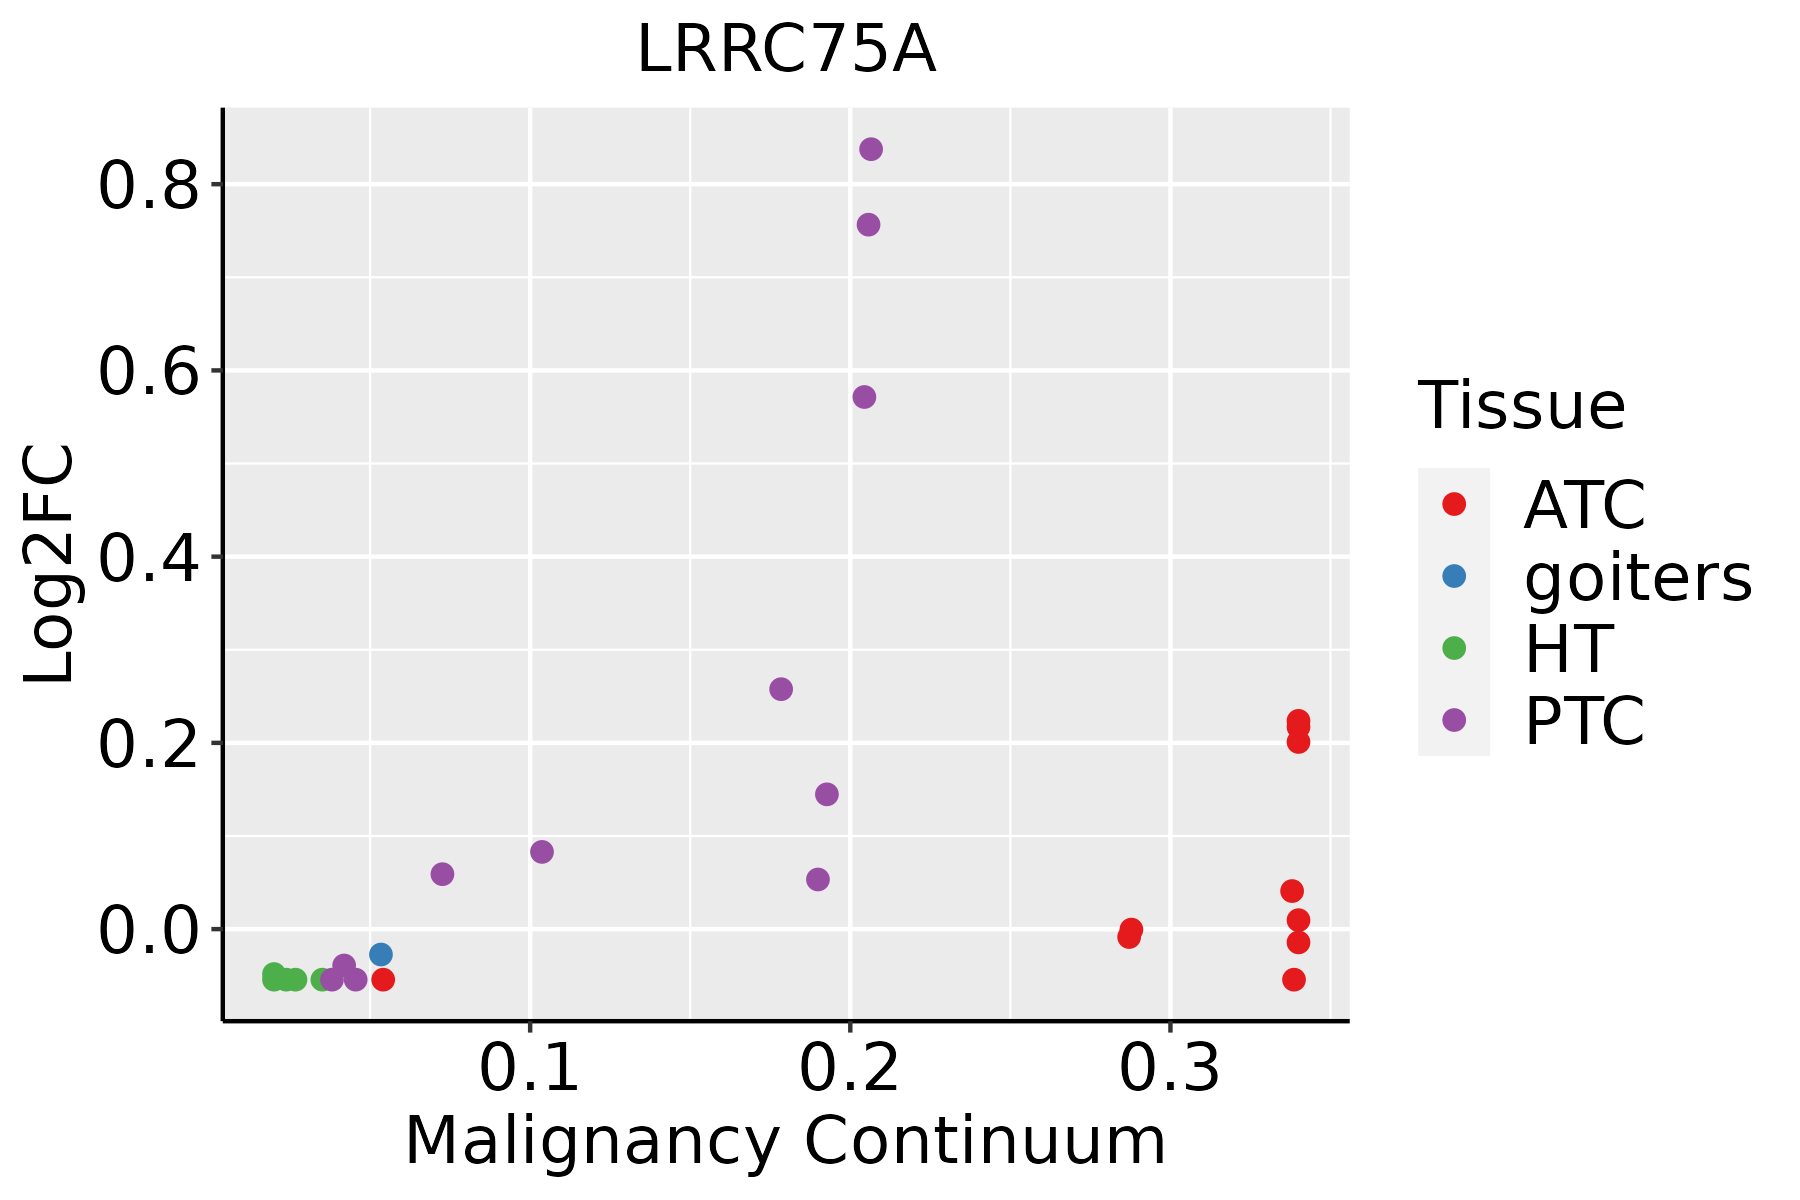 | ATC: Anaplastic thyroid cancer |
| HT: Hashimoto's thyroiditis | ||
| PTC: Papillary thyroid cancer |
| ∗log2FC in expression of this searched gene in stem-like cells from each diseased tissue sample relative to stem-like cells in normal samples in each tissue plotted against the malignancy continuum. Samples are colored based on if they are from different disease stage. |
Top |
Malignant transformation related pathway analysis |
| Find out the enriched GO biological processes and KEGG pathways involved in transition from healthy to precancer to cancer |
| Tissue | Disease Stage | Enriched GO biological Processes |
| Colorectum | AD |  |
| Colorectum | SER |  |
| Colorectum | MSS |  |
| Colorectum | MSI-H |  |
| Colorectum | FAP |  |
| ∗Top 15 enriched GO BP terms are showed in the bar plot of each disease state in each tissue. Each row represents a significant GO biological process which is colored according to the -log10(p.adjust). |
| Page: 1 2 3 4 5 6 7 8 9 |
| GO ID | Tissue | Disease Stage | Description | Gene Ratio | Bg Ratio | pvalue | p.adjust | Count |
| Page: 1 |
| Pathway ID | Tissue | Disease Stage | Description | Gene Ratio | Bg Ratio | pvalue | p.adjust | qvalue | Count |
| Page: 1 |
Top |
Cell-cell communication analysis |
| Identification of potential cell-cell interactions between two cell types and their ligand-receptor pairs for different disease states |
| Ligand | Receptor | LRpair | Pathway | Tissue | Disease Stage |
| Page: 1 |
Top |
Single-cell gene regulatory network inference analysis |
| Find out the significant the regulons (TFs) and the target genes of each regulon across cell types for different disease states |
| TF | Cell Type | Tissue | Disease Stage | Target Gene | RSS | Regulon Activity |
| ∗The dot plots of a searched regulon are shown for all cell subpopulations in each disease state of each tissue based on the regulon specific score inferred using pySCENIC and by calculating the average expression. |
| Page: 1 |
Top |
Somatic mutation of malignant transformation related genes |
| Annotation of somatic variants for genes involved in malignant transformation |
| Hugo Symbol | Variant Class | Variant Classification | dbSNP RS | HGVSc | HGVSp | HGVSp Short | SWISSPROT | BIOTYPE | SIFT | PolyPhen | Tumor Sample Barcode | Tissue | Histology | Sex | Age | Stage | Therapy Types | Drugs | Outcome |
| LRRC75A | SNV | Missense_Mutation | c.628N>T | p.Gly210Cys | p.G210C | Q8NAA5 | protein_coding | tolerated(0.21) | benign(0.067) | TCGA-EK-A2PG-01 | Cervix | cervical & endocervical cancer | Female | >=65 | I/II | Unknown | Unknown | SD | |
| LRRC75A | SNV | Missense_Mutation | c.843N>G | p.Phe281Leu | p.F281L | Q8NAA5 | protein_coding | tolerated(1) | probably_damaging(0.987) | TCGA-CM-5348-01 | Colorectum | colon adenocarcinoma | Male | >=65 | III/IV | Unknown | Unknown | SD | |
| LRRC75A | SNV | Missense_Mutation | c.310N>A | p.Leu104Met | p.L104M | Q8NAA5 | protein_coding | deleterious(0.02) | probably_damaging(0.998) | TCGA-G4-6309-01 | Colorectum | colon adenocarcinoma | Female | <65 | III/IV | Chemotherapy | xeloda | PD | |
| LRRC75A | SNV | Missense_Mutation | novel | c.740N>C | p.Leu247Pro | p.L247P | Q8NAA5 | protein_coding | deleterious(0.01) | probably_damaging(0.999) | TCGA-NH-A5IV-01 | Colorectum | colon adenocarcinoma | Female | >=65 | I/II | Unknown | Unknown | SD |
| LRRC75A | SNV | Missense_Mutation | novel | c.595N>A | p.Arg199Ser | p.R199S | Q8NAA5 | protein_coding | tolerated(1) | benign(0.061) | TCGA-AG-A00Y-01 | Colorectum | rectum adenocarcinoma | Male | >=65 | I/II | Unknown | Unknown | PD |
| LRRC75A | SNV | Missense_Mutation | novel | c.643N>G | p.Thr215Ala | p.T215A | Q8NAA5 | protein_coding | deleterious(0.01) | probably_damaging(0.994) | TCGA-AP-A059-01 | Endometrium | uterine corpus endometrioid carcinoma | Female | >=65 | I/II | Unknown | Unknown | SD |
| LRRC75A | SNV | Missense_Mutation | c.857G>A | p.Arg286His | p.R286H | Q8NAA5 | protein_coding | deleterious(0) | probably_damaging(0.938) | TCGA-AP-A0LM-01 | Endometrium | uterine corpus endometrioid carcinoma | Female | <65 | III/IV | Chemotherapy | cisplatin | SD | |
| LRRC75A | SNV | Missense_Mutation | novel | c.943N>G | p.Thr315Ala | p.T315A | Q8NAA5 | protein_coding | tolerated(0.45) | benign(0) | TCGA-AP-A1DV-01 | Endometrium | uterine corpus endometrioid carcinoma | Female | <65 | I/II | Unknown | Unknown | SD |
| LRRC75A | SNV | Missense_Mutation | rs746850666 | c.863N>A | p.Arg288His | p.R288H | Q8NAA5 | protein_coding | deleterious(0) | probably_damaging(0.998) | TCGA-AX-A0J1-01 | Endometrium | uterine corpus endometrioid carcinoma | Female | >=65 | I/II | Unknown | Unknown | SD |
| LRRC75A | SNV | Missense_Mutation | novel | c.986C>T | p.Ala329Val | p.A329V | Q8NAA5 | protein_coding | tolerated_low_confidence(0.11) | benign(0.015) | TCGA-AX-A2HC-01 | Endometrium | uterine corpus endometrioid carcinoma | Female | <65 | III/IV | Chemotherapy | paclitaxel | PD |
| Page: 1 2 3 |
Top |
Related drugs of malignant transformation related genes |
| Identification of chemicals and drugs interact with genes involved in malignant transfromation |
| (DGIdb 4.0) |
| Entrez ID | Symbol | Category | Interaction Types | Drug Claim Name | Drug Name | PMIDs |
| Page: 1 |

Copyright 2023-Present -The University of Texas Health Science Center at Houston |