
|
|||||
|
 | |
| |
| |
| |
| |
| |
|
Gene: LRRC61 |
Gene summary for LRRC61 |
| Gene information | Species | Human | Gene symbol | LRRC61 | Gene ID | 65999 |
| Gene name | leucine rich repeat containing 61 | |
| Gene Alias | HSPC295 | |
| Cytomap | 7q36.1 | |
| Gene Type | protein-coding | GO ID | GO:0005575 | UniProtAcc | A0A090N7W5 |
Top |
Malignant transformation analysis |
| Identification of the aberrant gene expression in precancerous and cancerous lesions by comparing the gene expression of stem-like cells in diseased tissues with normal stem cells |
| Entrez ID | Symbol | Replicates | Species | Organ | Tissue | Adj P-value | Log2FC | Malignancy |
| 65999 | LRRC61 | LZE24T | Human | Esophagus | ESCC | 2.01e-03 | 8.10e-02 | 0.0596 |
| 65999 | LRRC61 | P4T-E | Human | Esophagus | ESCC | 3.84e-20 | 4.77e-01 | 0.1323 |
| 65999 | LRRC61 | P5T-E | Human | Esophagus | ESCC | 1.30e-02 | 9.48e-02 | 0.1327 |
| 65999 | LRRC61 | P8T-E | Human | Esophagus | ESCC | 6.89e-22 | 2.72e-01 | 0.0889 |
| 65999 | LRRC61 | P9T-E | Human | Esophagus | ESCC | 3.32e-12 | 2.59e-01 | 0.1131 |
| 65999 | LRRC61 | P10T-E | Human | Esophagus | ESCC | 3.67e-30 | 5.05e-01 | 0.116 |
| 65999 | LRRC61 | P11T-E | Human | Esophagus | ESCC | 6.16e-09 | 3.24e-01 | 0.1426 |
| 65999 | LRRC61 | P12T-E | Human | Esophagus | ESCC | 8.57e-38 | 7.14e-01 | 0.1122 |
| 65999 | LRRC61 | P15T-E | Human | Esophagus | ESCC | 1.62e-21 | 4.74e-01 | 0.1149 |
| 65999 | LRRC61 | P16T-E | Human | Esophagus | ESCC | 1.98e-23 | 4.65e-01 | 0.1153 |
| 65999 | LRRC61 | P19T-E | Human | Esophagus | ESCC | 7.75e-05 | 4.66e-01 | 0.1662 |
| 65999 | LRRC61 | P20T-E | Human | Esophagus | ESCC | 2.60e-08 | 1.21e-01 | 0.1124 |
| 65999 | LRRC61 | P21T-E | Human | Esophagus | ESCC | 4.19e-12 | 2.51e-01 | 0.1617 |
| 65999 | LRRC61 | P23T-E | Human | Esophagus | ESCC | 8.51e-09 | 2.10e-01 | 0.108 |
| 65999 | LRRC61 | P24T-E | Human | Esophagus | ESCC | 4.02e-20 | 3.69e-01 | 0.1287 |
| 65999 | LRRC61 | P26T-E | Human | Esophagus | ESCC | 2.57e-12 | 1.90e-01 | 0.1276 |
| 65999 | LRRC61 | P27T-E | Human | Esophagus | ESCC | 8.60e-24 | 3.89e-01 | 0.1055 |
| 65999 | LRRC61 | P28T-E | Human | Esophagus | ESCC | 1.21e-13 | 2.70e-01 | 0.1149 |
| 65999 | LRRC61 | P31T-E | Human | Esophagus | ESCC | 1.18e-20 | 3.24e-01 | 0.1251 |
| 65999 | LRRC61 | P36T-E | Human | Esophagus | ESCC | 7.18e-07 | 1.53e-01 | 0.1187 |
| Page: 1 2 3 4 |
| Tissue | Expression Dynamics | Abbreviation |
| Esophagus | 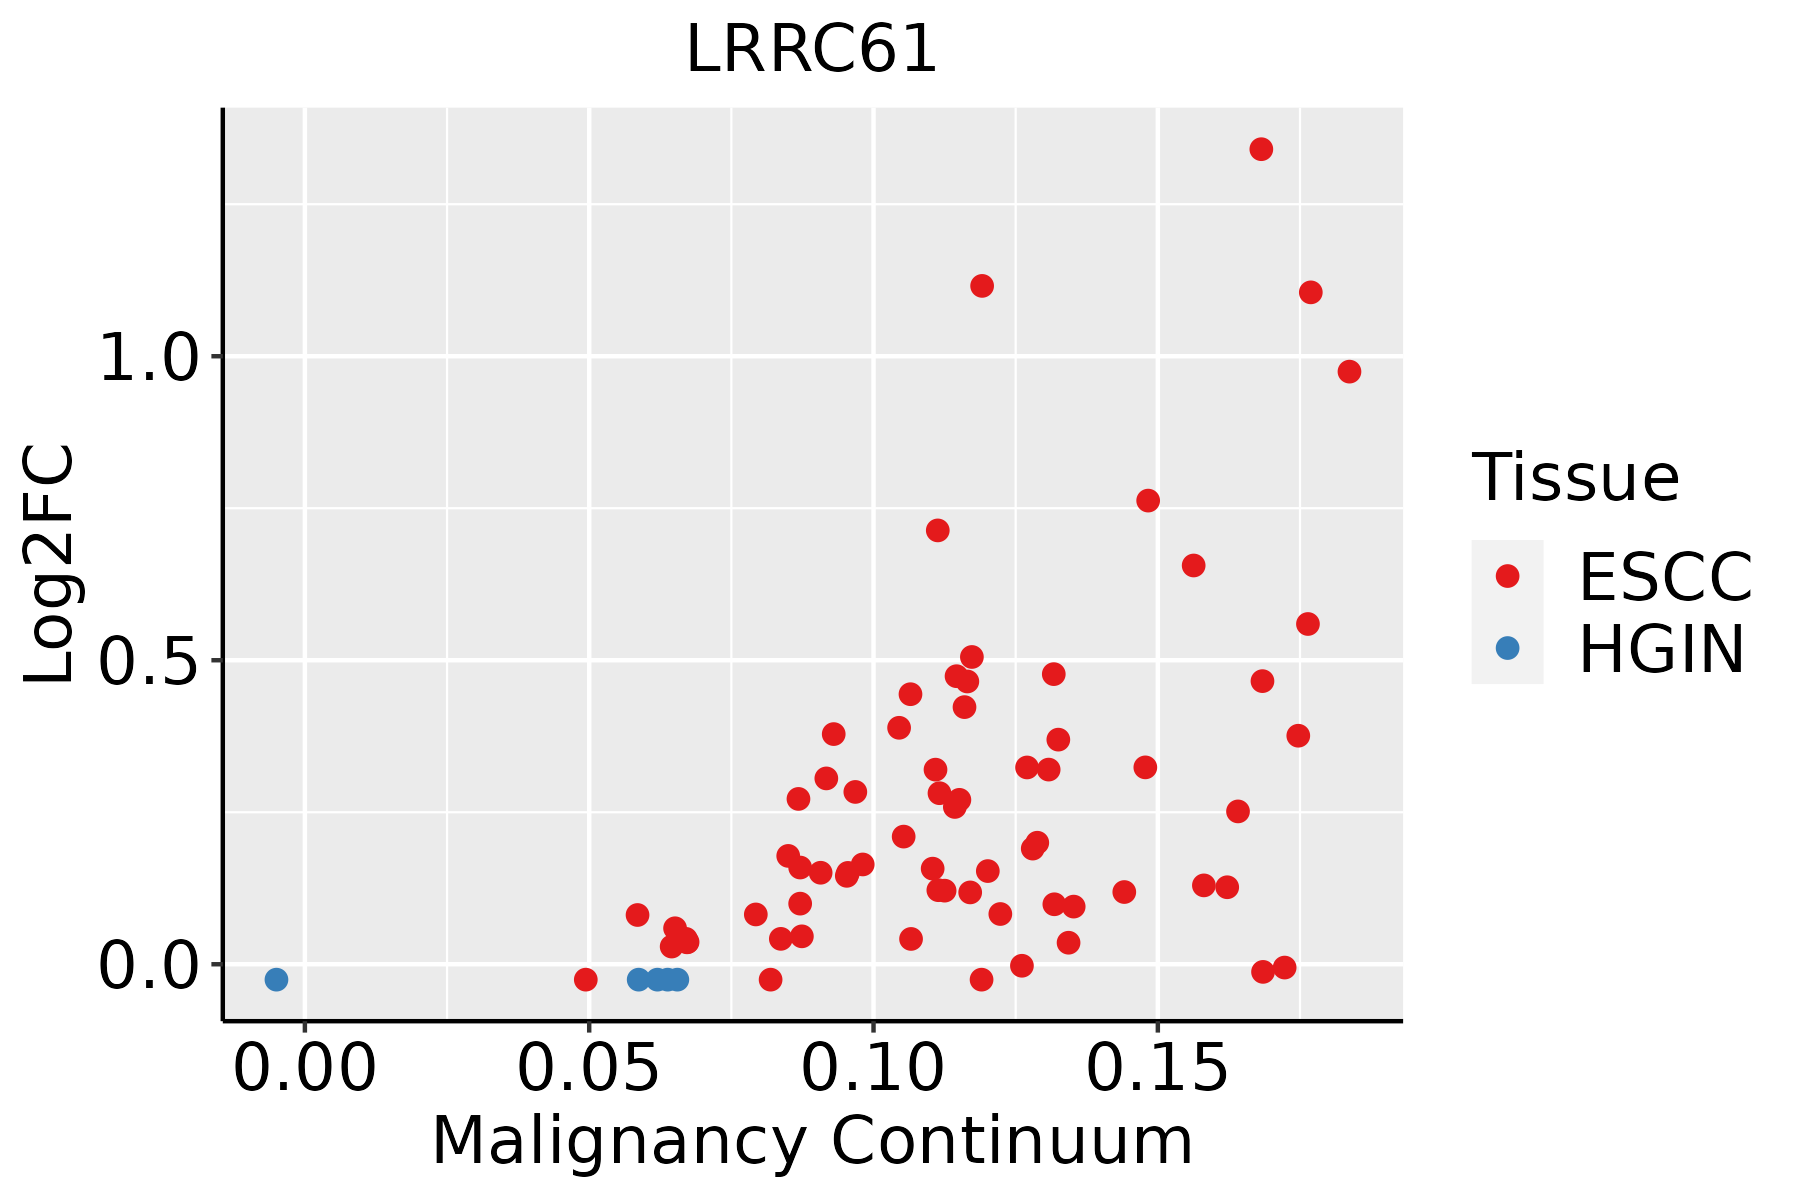 | ESCC: Esophageal squamous cell carcinoma |
| HGIN: High-grade intraepithelial neoplasias | ||
| LGIN: Low-grade intraepithelial neoplasias | ||
| Liver | 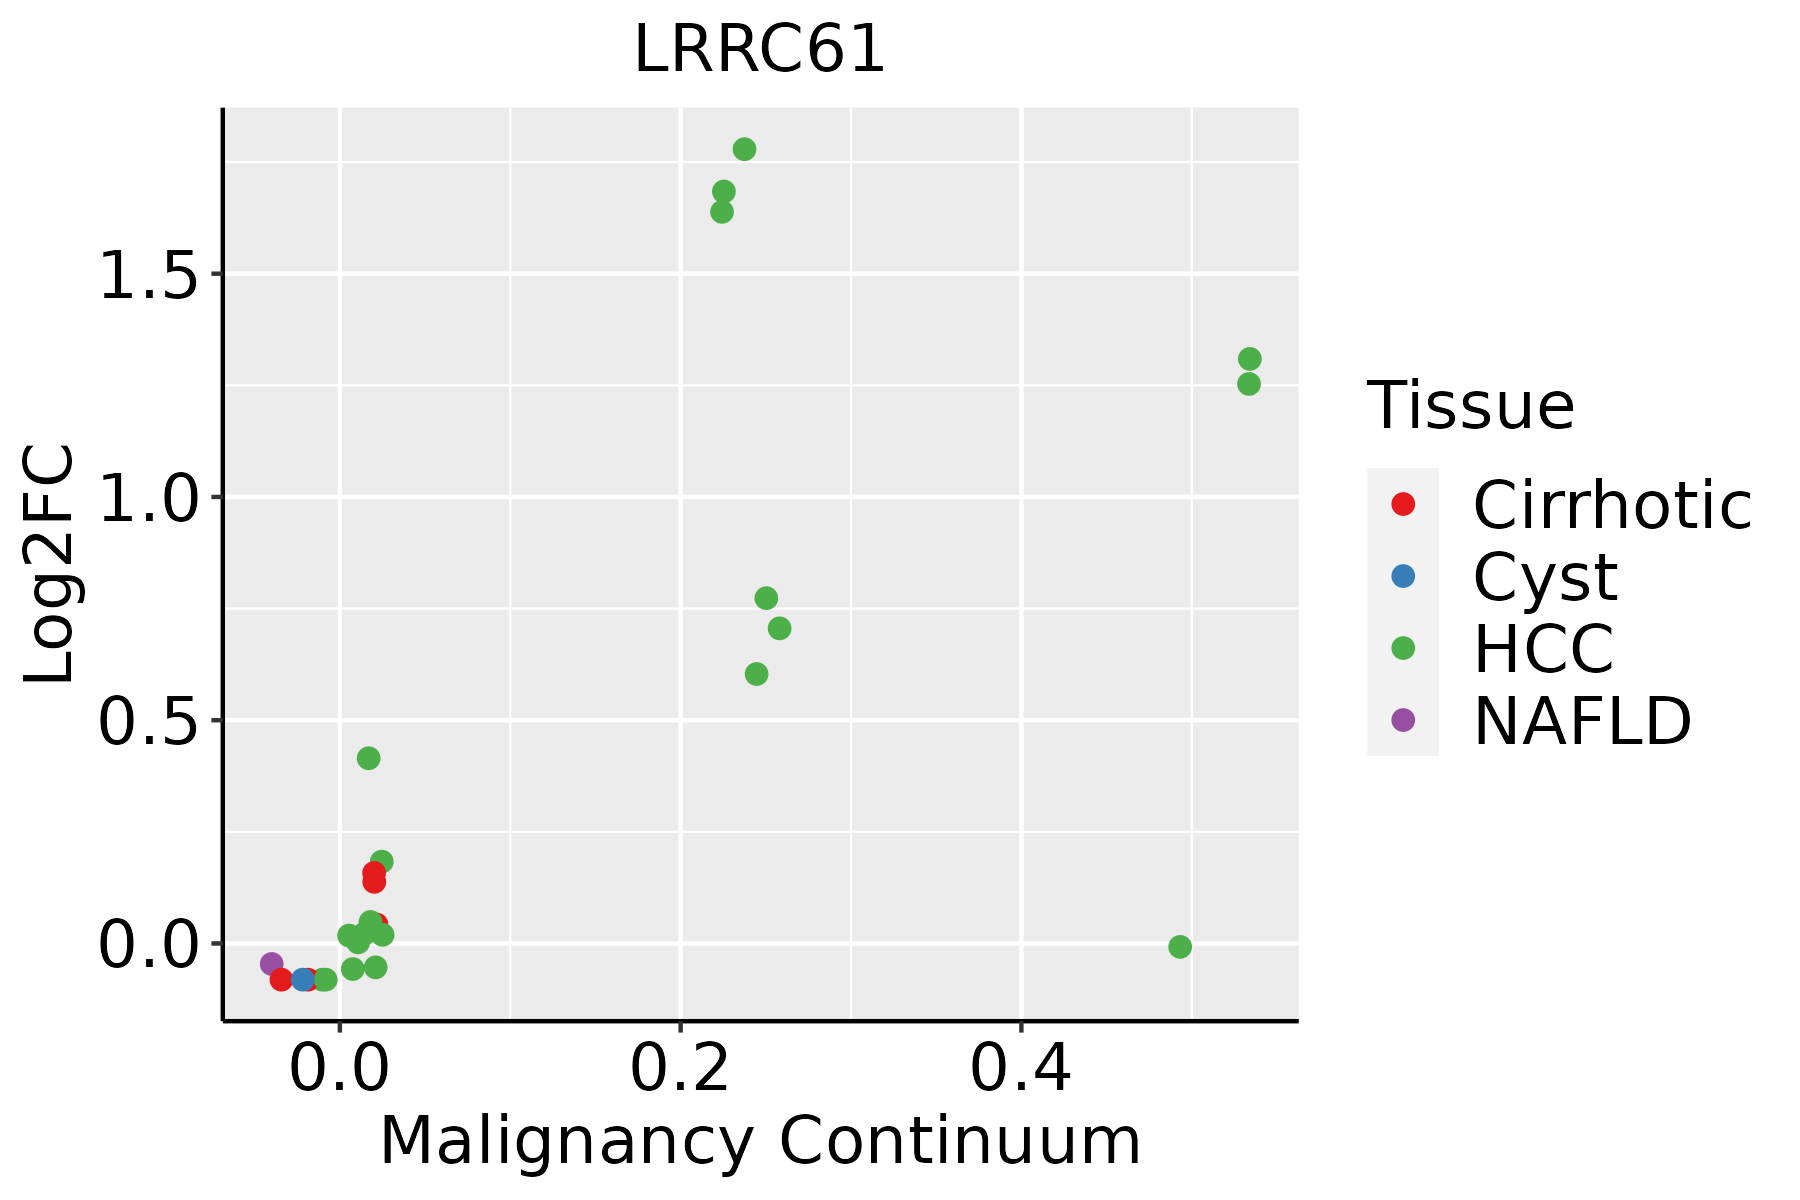 | HCC: Hepatocellular carcinoma |
| NAFLD: Non-alcoholic fatty liver disease | ||
| Oral Cavity | 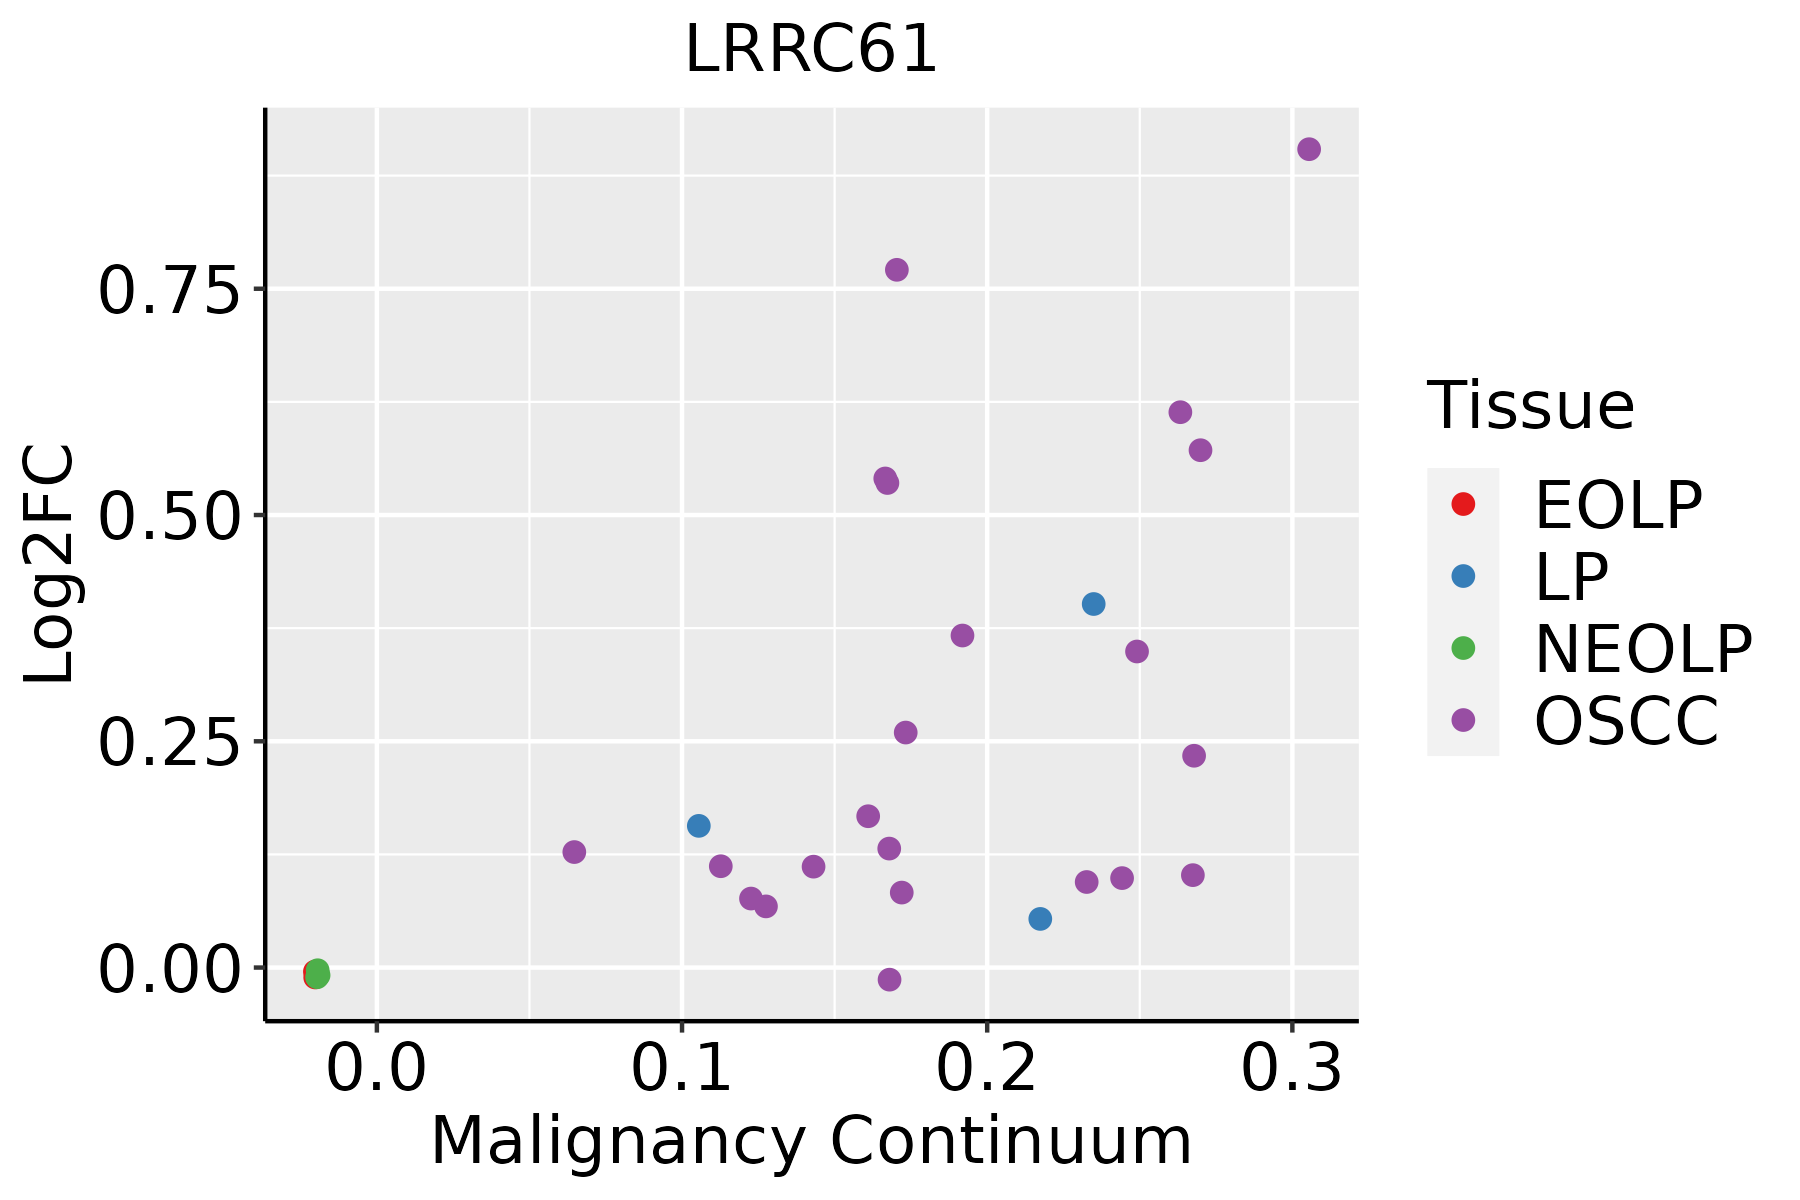 | EOLP: Erosive Oral lichen planus |
| LP: leukoplakia | ||
| NEOLP: Non-erosive oral lichen planus | ||
| OSCC: Oral squamous cell carcinoma |
| ∗log2FC in expression of this searched gene in stem-like cells from each diseased tissue sample relative to stem-like cells in normal samples in each tissue plotted against the malignancy continuum. Samples are colored based on if they are from different disease stage. |
Top |
Malignant transformation related pathway analysis |
| Find out the enriched GO biological processes and KEGG pathways involved in transition from healthy to precancer to cancer |
| Tissue | Disease Stage | Enriched GO biological Processes |
| Colorectum | AD |  |
| Colorectum | SER |  |
| Colorectum | MSS |  |
| Colorectum | MSI-H |  |
| Colorectum | FAP |  |
| ∗Top 15 enriched GO BP terms are showed in the bar plot of each disease state in each tissue. Each row represents a significant GO biological process which is colored according to the -log10(p.adjust). |
| Page: 1 2 3 4 5 6 7 8 9 |
| GO ID | Tissue | Disease Stage | Description | Gene Ratio | Bg Ratio | pvalue | p.adjust | Count |
| Page: 1 |
| Pathway ID | Tissue | Disease Stage | Description | Gene Ratio | Bg Ratio | pvalue | p.adjust | qvalue | Count |
| Page: 1 |
Top |
Cell-cell communication analysis |
| Identification of potential cell-cell interactions between two cell types and their ligand-receptor pairs for different disease states |
| Ligand | Receptor | LRpair | Pathway | Tissue | Disease Stage |
| Page: 1 |
Top |
Single-cell gene regulatory network inference analysis |
| Find out the significant the regulons (TFs) and the target genes of each regulon across cell types for different disease states |
| TF | Cell Type | Tissue | Disease Stage | Target Gene | RSS | Regulon Activity |
| ∗The dot plots of a searched regulon are shown for all cell subpopulations in each disease state of each tissue based on the regulon specific score inferred using pySCENIC and by calculating the average expression. |
| Page: 1 |
Top |
Somatic mutation of malignant transformation related genes |
| Annotation of somatic variants for genes involved in malignant transformation |
| Hugo Symbol | Variant Class | Variant Classification | dbSNP RS | HGVSc | HGVSp | HGVSp Short | SWISSPROT | BIOTYPE | SIFT | PolyPhen | Tumor Sample Barcode | Tissue | Histology | Sex | Age | Stage | Therapy Types | Drugs | Outcome |
| LRRC61 | SNV | Missense_Mutation | novel | c.83N>G | p.Phe28Cys | p.F28C | Q9BV99 | protein_coding | deleterious(0) | probably_damaging(0.995) | TCGA-B6-A0RE-01 | Breast | breast invasive carcinoma | Female | <65 | I/II | Unknown | Unknown | SD |
| LRRC61 | SNV | Missense_Mutation | rs765026130 | c.452N>A | p.Arg151Gln | p.R151Q | Q9BV99 | protein_coding | tolerated(0.31) | benign(0) | TCGA-D8-A27K-01 | Breast | breast invasive carcinoma | Female | <65 | I/II | Chemotherapy | adriamycin+cyclophosphamid | SD |
| LRRC61 | insertion | In_Frame_Ins | novel | c.393_394insAATGTT | p.Asp131_Pro132insAsnVal | p.D131_P132insNV | Q9BV99 | protein_coding | TCGA-A8-A06Q-01 | Breast | breast invasive carcinoma | Female | <65 | III/IV | Unknown | Unknown | SD | ||
| LRRC61 | SNV | Missense_Mutation | rs149743914 | c.335C>T | p.Pro112Leu | p.P112L | Q9BV99 | protein_coding | tolerated(0.62) | benign(0.006) | TCGA-AA-3492-01 | Colorectum | colon adenocarcinoma | Female | >=65 | I/II | Unknown | Unknown | SD |
| LRRC61 | SNV | Missense_Mutation | c.416C>T | p.Pro139Leu | p.P139L | Q9BV99 | protein_coding | deleterious(0) | probably_damaging(0.995) | TCGA-AA-3950-01 | Colorectum | colon adenocarcinoma | Female | >=65 | I/II | Unknown | Unknown | SD | |
| LRRC61 | SNV | Missense_Mutation | c.304N>T | p.Leu102Phe | p.L102F | Q9BV99 | protein_coding | deleterious(0) | probably_damaging(0.996) | TCGA-AA-A010-01 | Colorectum | colon adenocarcinoma | Female | <65 | I/II | Chemotherapy | folinic | CR | |
| LRRC61 | SNV | Missense_Mutation | rs573247336 | c.724N>A | p.Ala242Thr | p.A242T | Q9BV99 | protein_coding | tolerated(0.07) | probably_damaging(0.992) | TCGA-G4-6304-01 | Colorectum | colon adenocarcinoma | Female | >=65 | I/II | Chemotherapy | fluorouracil | PD |
| LRRC61 | SNV | Missense_Mutation | c.304C>T | p.Leu102Phe | p.L102F | Q9BV99 | protein_coding | deleterious(0) | probably_damaging(0.996) | TCGA-A5-A0G2-01 | Endometrium | uterine corpus endometrioid carcinoma | Female | <65 | III/IV | Unknown | Unknown | SD | |
| LRRC61 | SNV | Missense_Mutation | rs759257308 | c.451N>T | p.Arg151Trp | p.R151W | Q9BV99 | protein_coding | tolerated(0.18) | benign(0) | TCGA-AP-A0LE-01 | Endometrium | uterine corpus endometrioid carcinoma | Female | <65 | I/II | Unknown | Unknown | SD |
| LRRC61 | SNV | Missense_Mutation | novel | c.539N>G | p.Asp180Gly | p.D180G | Q9BV99 | protein_coding | deleterious(0) | probably_damaging(0.992) | TCGA-AP-A1DV-01 | Endometrium | uterine corpus endometrioid carcinoma | Female | <65 | I/II | Unknown | Unknown | SD |
| Page: 1 2 3 |
Top |
Related drugs of malignant transformation related genes |
| Identification of chemicals and drugs interact with genes involved in malignant transfromation |
| (DGIdb 4.0) |
| Entrez ID | Symbol | Category | Interaction Types | Drug Claim Name | Drug Name | PMIDs |
| Page: 1 |

Copyright 2023-Present -The University of Texas Health Science Center at Houston |