Schematic overview of the cellular and molecular mechanisms involved in the cancer progression, including the proposed cellular and molecular mechanisms in cancer cells trajectory. AT1: alveolar type 1 cells; AT2: alveolar type 2 cells; AAH: atypical adenomatous hyperplasia; AIS: adenocarcinoma in situ; MIA: minimally invasive adenocarcinoma; IA: invasive adenocarcinoma; EMT: epithelial-mesenchymal transition

Home

Download

Statistics

Help

Contact

Center for Computational Systems Medicine
leaf

Gene summary

leaf

Malignant transformation analysis

leaf

Malignant transformation related pathway analysis

leaf

Cell-cell communication analysis

leaf

Single-cell gene regulatory network inference analysis

leaf

Somatic mutation of malignant transformation related genes

leaf

Related drugs of malignant transformation related genes

Gene: LRRC59

Gene summary for LRRC59

check button Gene summary.

Gene informationSpeciesHuman
Gene symbol

LRRC59

Gene ID

55379

Gene nameleucine rich repeat containing 59
Gene AliasPRO1855
Cytomap17q21.33
Gene Typeprotein-coding
GO ID

GO:0007154

UniProtAcc

Q96AG4


Top

Malignant transformation analysis

check button Identification of the aberrant gene expression in precancerous and cancerous lesions by comparing the gene expression of stem-like cells in diseased tissues with normal stem cells
check button Malignant transformation involving gene list.
Entrez IDSymbolReplicatesSpeciesOrganTissueAdj P-valueLog2FCMalignancy
55379LRRC59GSM4909282HumanBreastIDC1.11e-16-2.98e-01-0.0288
55379LRRC59GSM4909290HumanBreastIDC5.08e-053.72e-010.2096
55379LRRC59GSM4909291HumanBreastIDC8.06e-419.53e-010.1753
55379LRRC59GSM4909294HumanBreastIDC2.09e-02-1.88e-010.2022
55379LRRC59GSM4909296HumanBreastIDC4.89e-10-2.35e-010.1524
55379LRRC59GSM4909297HumanBreastIDC3.91e-08-1.72e-010.1517
55379LRRC59GSM4909301HumanBreastIDC3.33e-02-1.75e-010.1577
55379LRRC59GSM4909311HumanBreastIDC3.27e-17-2.08e-010.1534
55379LRRC59GSM4909312HumanBreastIDC1.68e-051.14e-020.1552
55379LRRC59GSM4909319HumanBreastIDC4.90e-23-2.03e-010.1563
55379LRRC59GSM4909320HumanBreastIDC2.12e-02-1.82e-010.1575
55379LRRC59GSM4909321HumanBreastIDC5.81e-09-1.74e-010.1559
55379LRRC59brca1HumanBreastPrecancer3.54e-185.81e-01-0.0338
55379LRRC59brca2HumanBreastPrecancer2.04e-083.58e-01-0.024
55379LRRC59brca3HumanBreastPrecancer4.89e-072.89e-01-0.0263
55379LRRC59M2HumanBreastIDC3.65e-032.56e-010.21
55379LRRC59NCCBC14HumanBreastDCIS6.27e-041.61e-010.2021
55379LRRC59NCCBC3HumanBreastDCIS1.66e-02-8.19e-020.1198
55379LRRC59P1HumanBreastIDC9.22e-115.19e-020.1527
55379LRRC59P2HumanBreastIDC4.79e-166.68e-010.21
Page: 1 2 3 4 5 6 7 8 

check button Transcriptomic changes along malignancy continuum.
TissueExpression DynamicsAbbreviation
BreastThe image shows the transcriptomic changes along malignancy continuum.log2FC in expression of this searched gene in stem-like cells from each diseased tissue sample relative to stem-like cells in normal samples in each tissue plotted against the malignancy continuum. Samples are colored based on if they are from different disease stage.
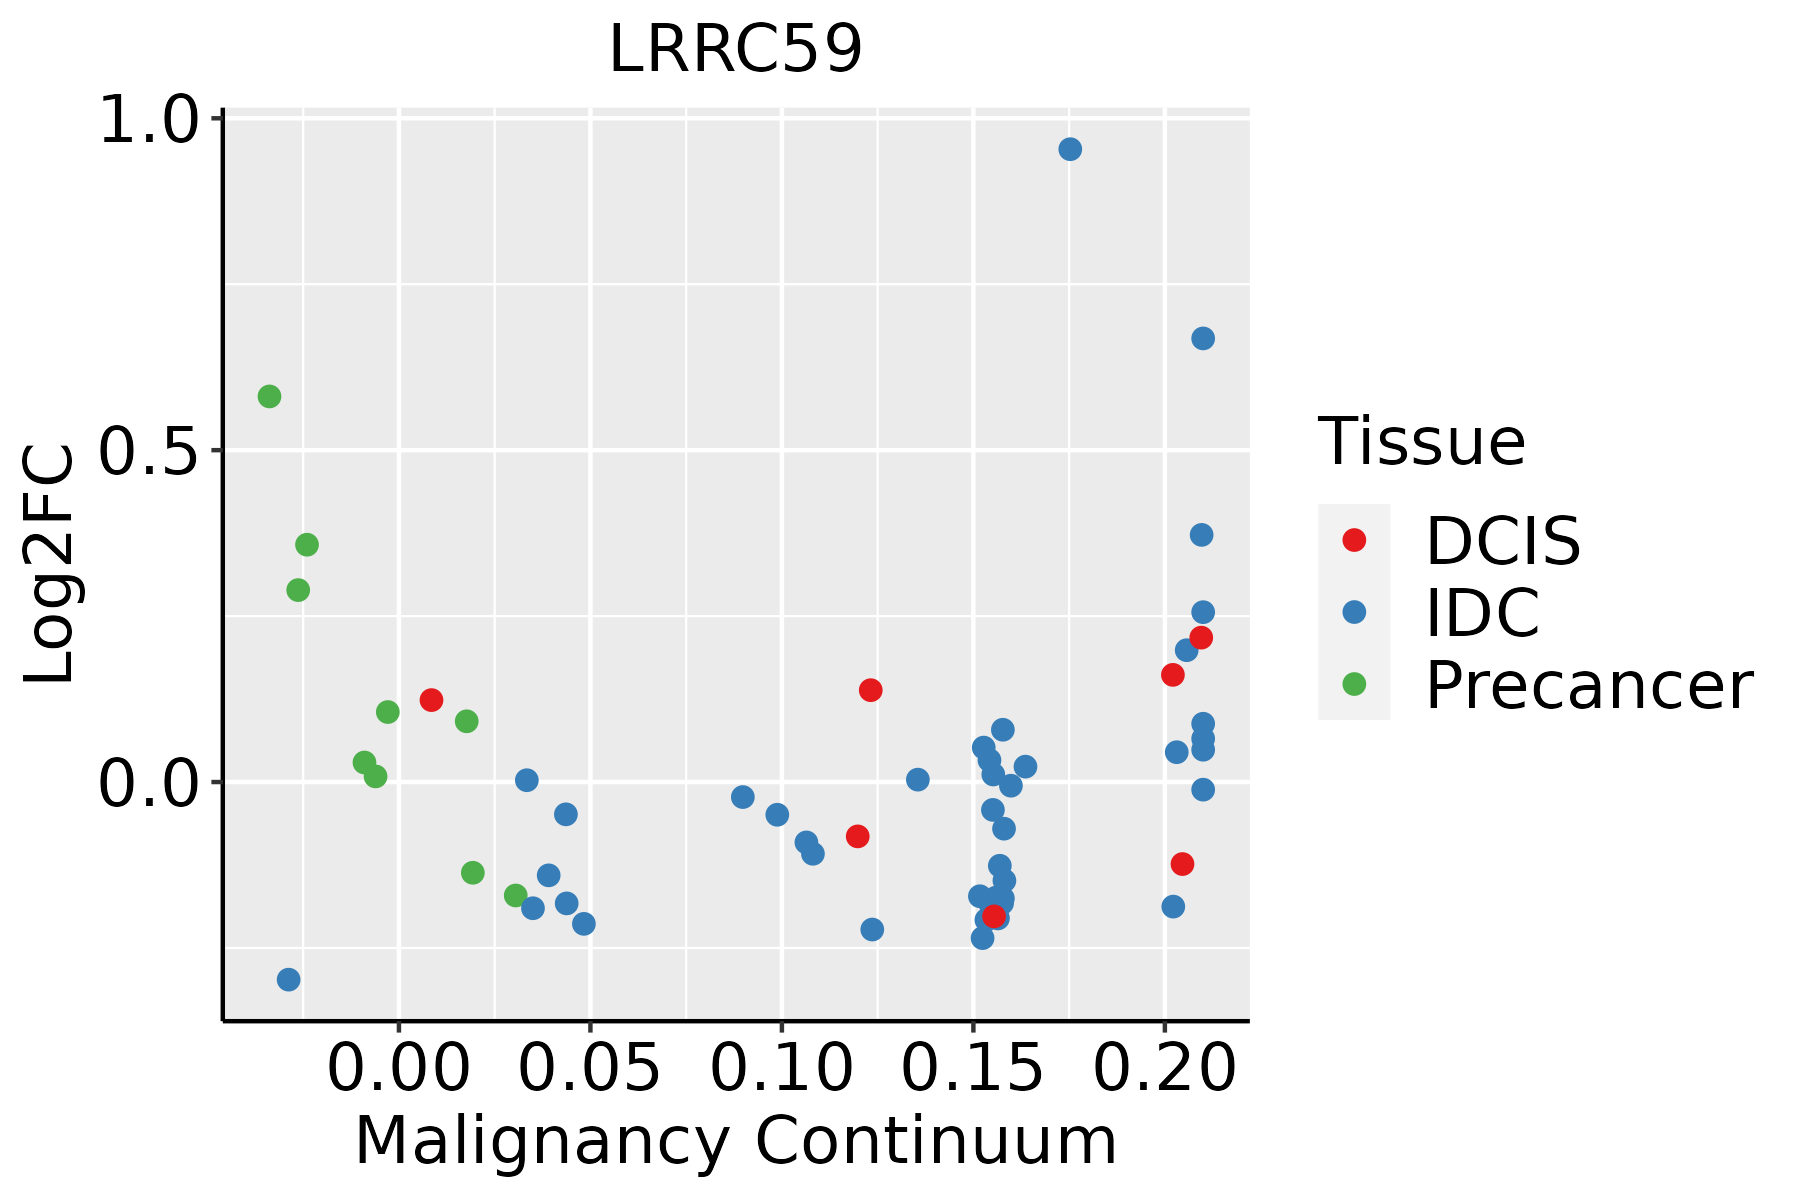
IDC: Invasive ductal carcinoma
DCIS: Ductal carcinoma in situ
Precancer(BRCA1-mut): Precancerous lesion from BRCA1 mutation carriers
EsophagusThe image shows the transcriptomic changes along malignancy continuum.log2FC in expression of this searched gene in stem-like cells from each diseased tissue sample relative to stem-like cells in normal samples in each tissue plotted against the malignancy continuum. Samples are colored based on if they are from different disease stage.ESCC: Esophageal squamous cell carcinoma
HGIN: High-grade intraepithelial neoplasias
LGIN: Low-grade intraepithelial neoplasias
LiverThe image shows the transcriptomic changes along malignancy continuum.log2FC in expression of this searched gene in stem-like cells from each diseased tissue sample relative to stem-like cells in normal samples in each tissue plotted against the malignancy continuum. Samples are colored based on if they are from different disease stage.HCC: Hepatocellular carcinoma
NAFLD: Non-alcoholic fatty liver disease
Oral CavityThe image shows the transcriptomic changes along malignancy continuum.log2FC in expression of this searched gene in stem-like cells from each diseased tissue sample relative to stem-like cells in normal samples in each tissue plotted against the malignancy continuum. Samples are colored based on if they are from different disease stage.
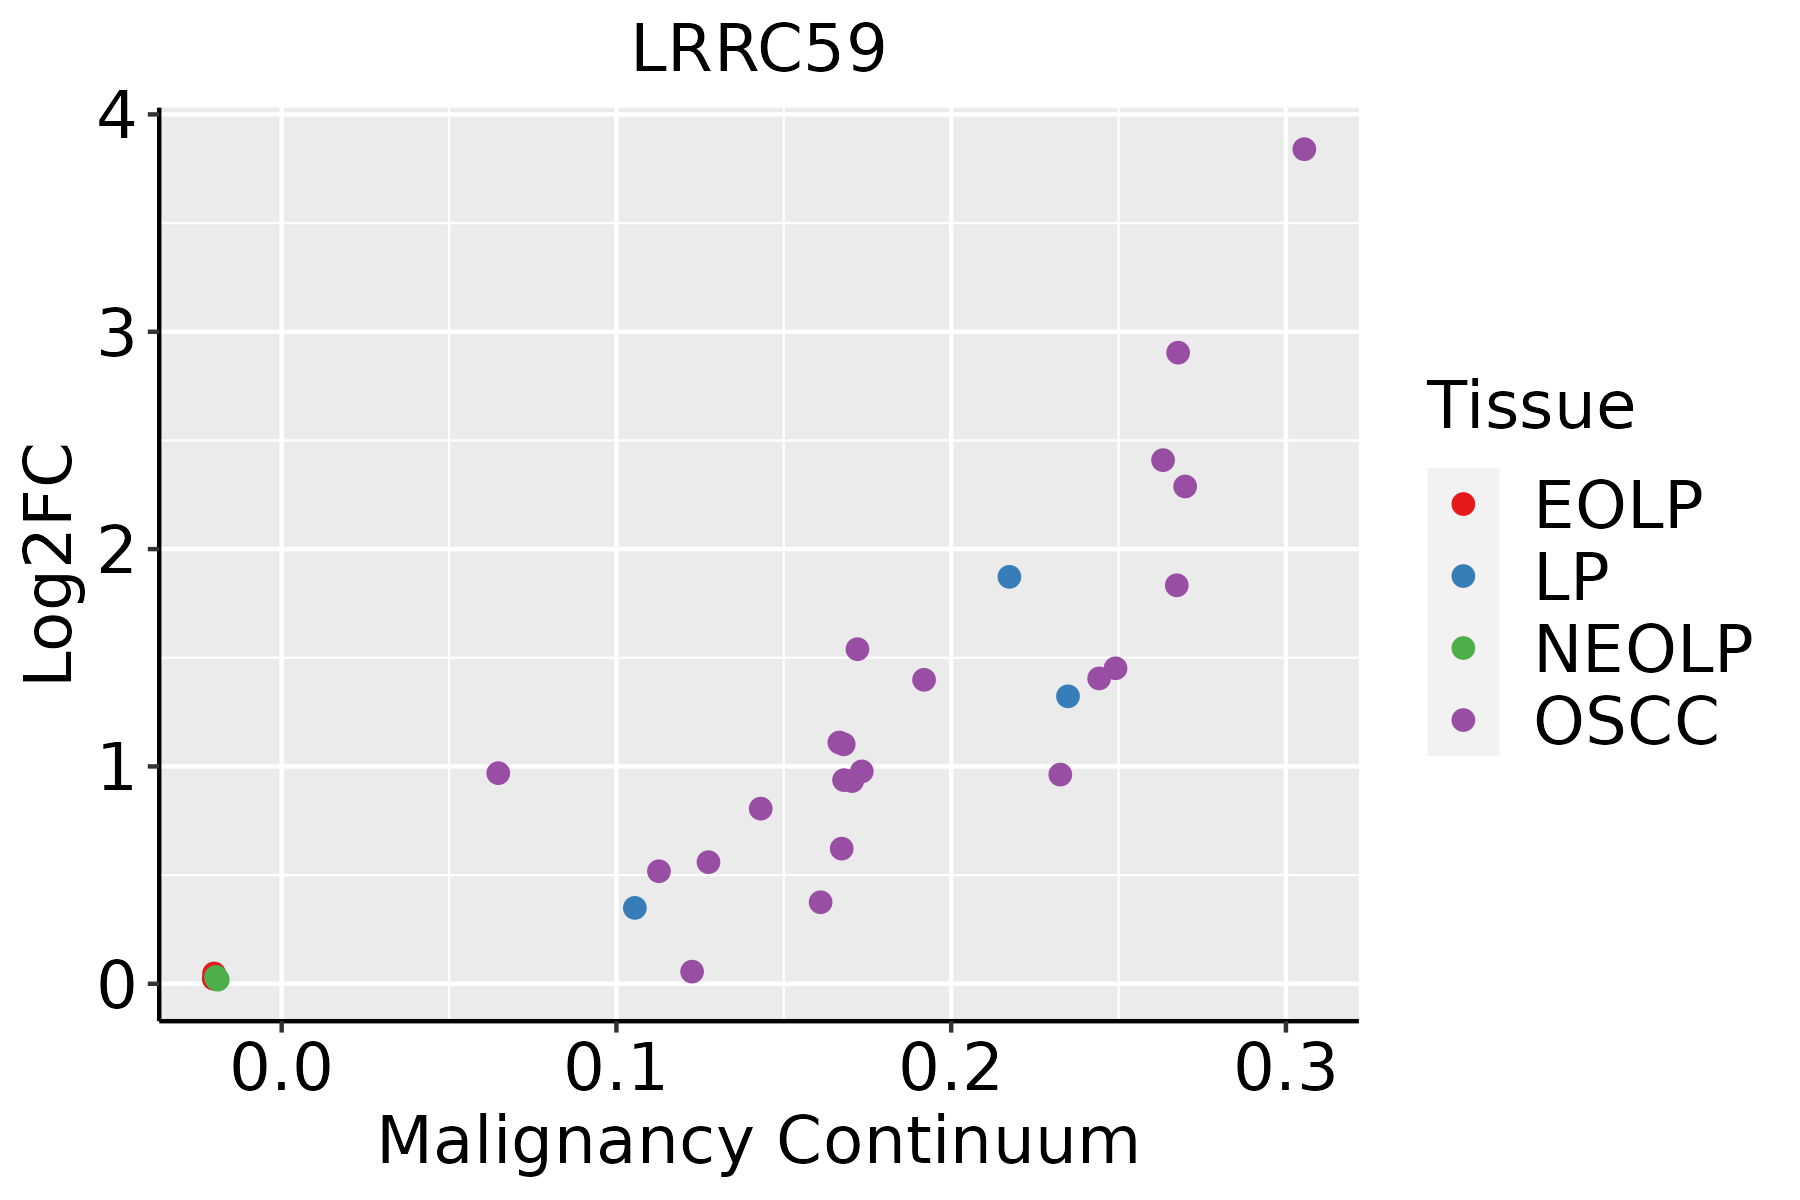
EOLP: Erosive Oral lichen planus
LP: leukoplakia
NEOLP: Non-erosive oral lichen planus
OSCC: Oral squamous cell carcinoma
ProstateThe image shows the transcriptomic changes along malignancy continuum.log2FC in expression of this searched gene in stem-like cells from each diseased tissue sample relative to stem-like cells in normal samples in each tissue plotted against the malignancy continuum. Samples are colored based on if they are from different disease stage.
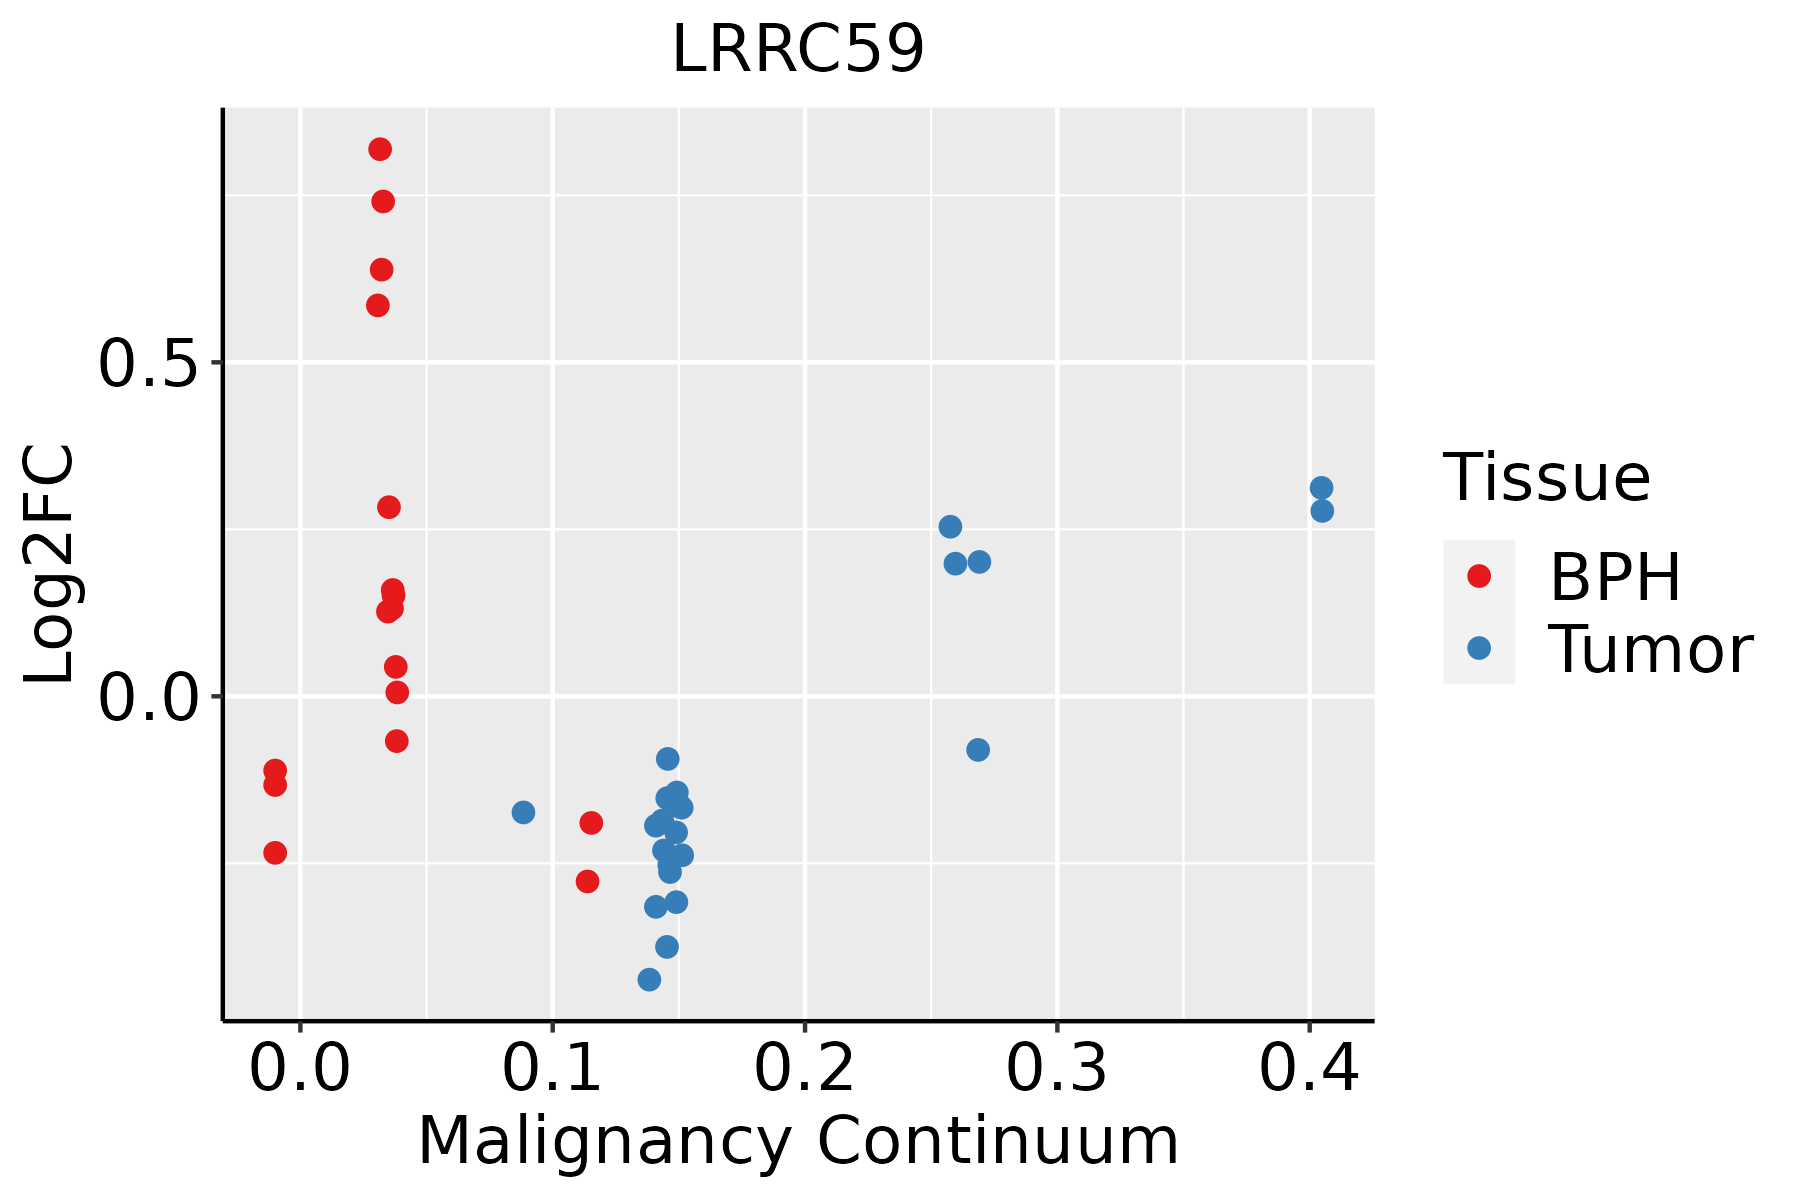
BPH: Benign Prostatic Hyperplasia
SkinThe image shows the transcriptomic changes along malignancy continuum.log2FC in expression of this searched gene in stem-like cells from each diseased tissue sample relative to stem-like cells in normal samples in each tissue plotted against the malignancy continuum. Samples are colored based on if they are from different disease stage.
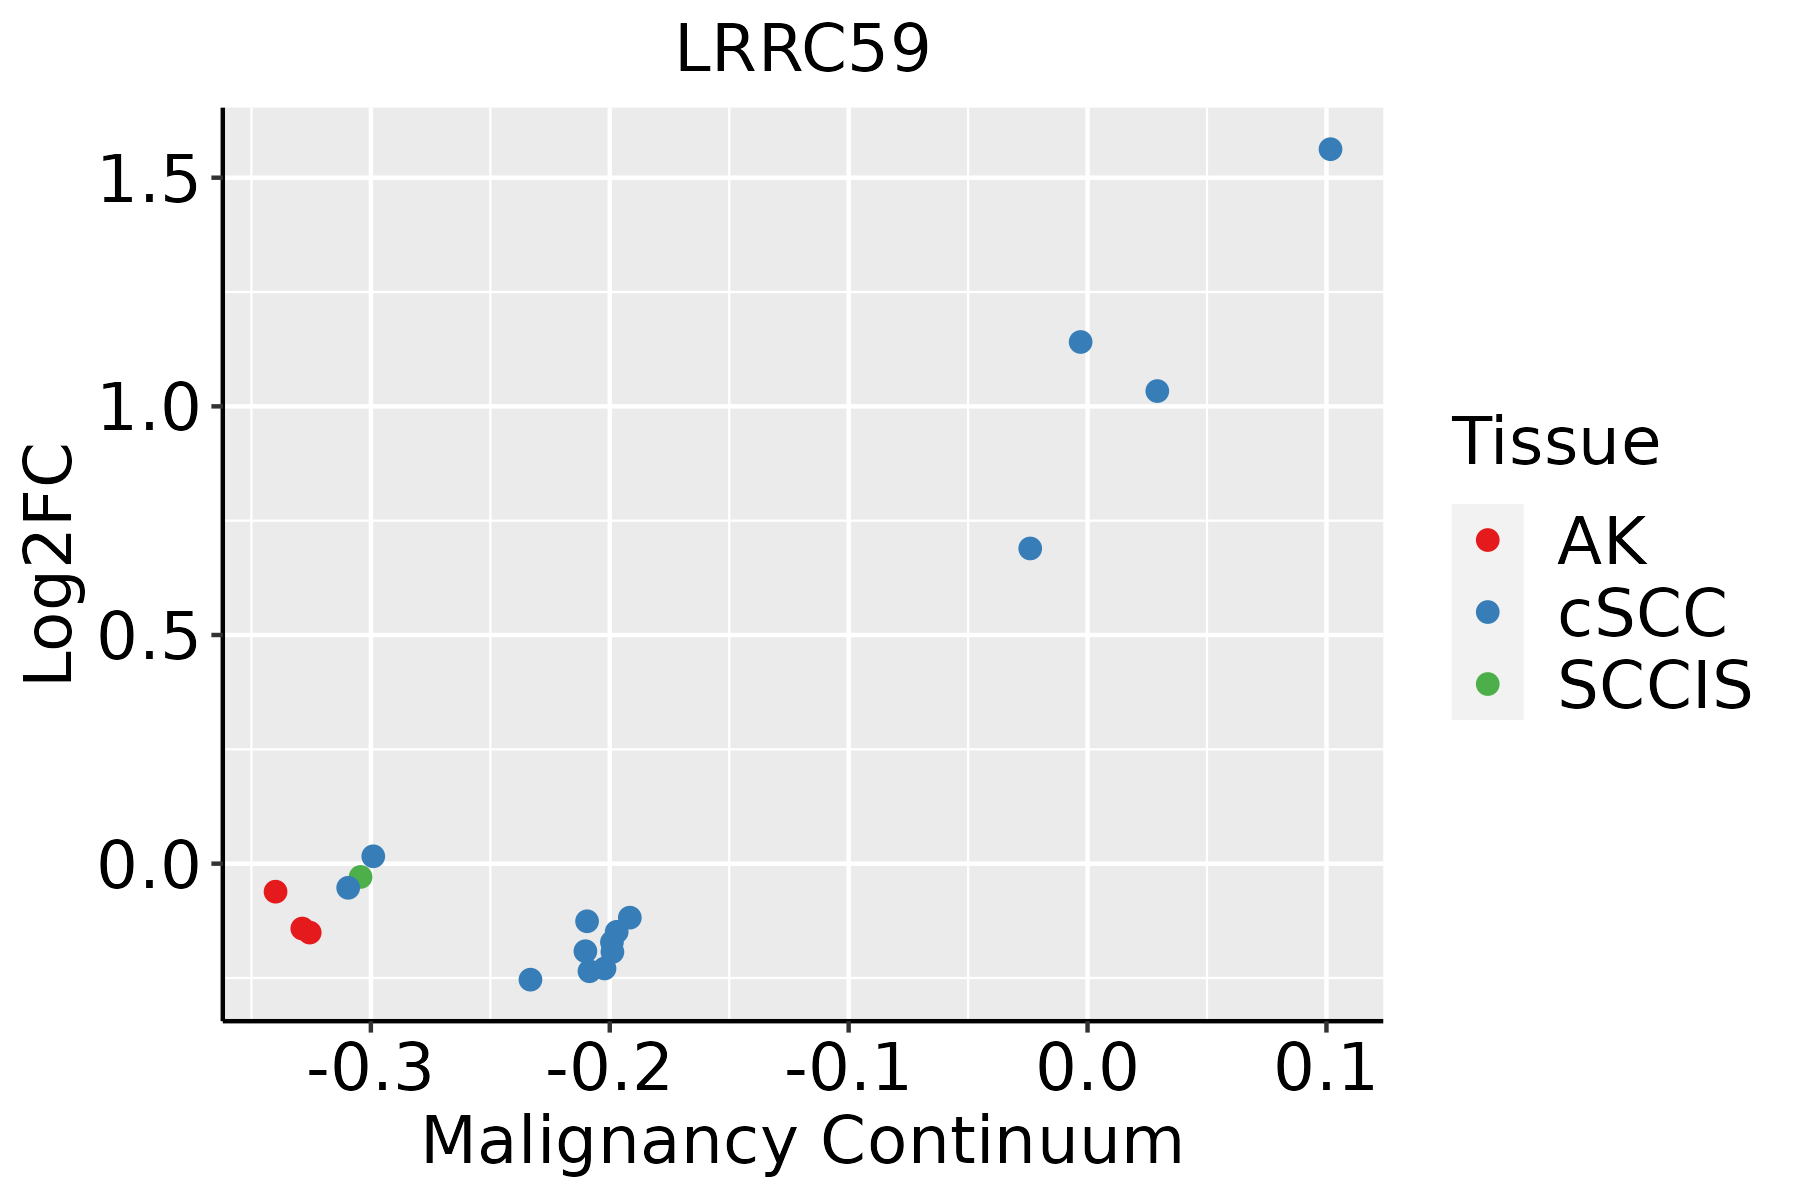
AK: Actinic keratosis
cSCC: Cutaneous squamous cell carcinoma
SCCIS:squamous cell carcinoma in situ
ThyroidThe image shows the transcriptomic changes along malignancy continuum.log2FC in expression of this searched gene in stem-like cells from each diseased tissue sample relative to stem-like cells in normal samples in each tissue plotted against the malignancy continuum. Samples are colored based on if they are from different disease stage.ATC: Anaplastic thyroid cancer
HT: Hashimoto's thyroiditis
PTC: Papillary thyroid cancer
∗log2FC in expression of this searched gene in stem-like cells from each diseased tissue sample relative to stem-like cells in normal samples in each tissue plotted against the malignancy continuum. Samples are colored based on if they are from different disease stage.

Top

Malignant transformation related pathway analysis

check buttonFind out the enriched GO biological processes and KEGG pathways involved in transition from healthy to precancer to cancer
check button Figure of enriched GO biological processes.
TissueDisease StageEnriched GO biological Processes
ColorectumADGO analysis - Figure of enriched GO biological processes: Top 15 enriched GO BP terms are showed in the bar plot of each disease state in each tissue. Each row represents a significant GO biological process which is colored according to the -log10(p.adjust).
ColorectumSERGO analysis - Figure of enriched GO biological processes: Top 15 enriched GO BP terms are showed in the bar plot of each disease state in each tissue. Each row represents a significant GO biological process which is colored according to the -log10(p.adjust).
ColorectumMSSGO analysis - Figure of enriched GO biological processes: Top 15 enriched GO BP terms are showed in the bar plot of each disease state in each tissue. Each row represents a significant GO biological process which is colored according to the -log10(p.adjust).
ColorectumMSI-HGO analysis - Figure of enriched GO biological processes: Top 15 enriched GO BP terms are showed in the bar plot of each disease state in each tissue. Each row represents a significant GO biological process which is colored according to the -log10(p.adjust).
ColorectumFAPGO analysis - Figure of enriched GO biological processes: Top 15 enriched GO BP terms are showed in the bar plot of each disease state in each tissue. Each row represents a significant GO biological process which is colored according to the -log10(p.adjust).
∗Top 15 enriched GO BP terms are showed in the bar plot of each disease state in each tissue. Each row represents a significant GO biological process which is colored according to the -log10(p.adjust).
Page: 1 2 3 4 5 6 7 8 9 

check button Enriched GO biological processes.
GO IDTissueDisease StageDescriptionGene RatioBg Ratiopvaluep.adjustCount
GO:000726510EsophagusESCCRas protein signal transduction201/8552337/187231.44e-072.30e-06201
GO:00465789EsophagusESCCregulation of Ras protein signal transduction106/8552189/187232.49e-031.08e-02106
GO:005105610EsophagusESCCregulation of small GTPase mediated signal transduction157/8552302/187231.55e-024.98e-02157
GO:000726511LiverCirrhoticRas protein signal transduction119/4634337/187238.16e-061.22e-04119
GO:000726521LiverHCCRas protein signal transduction187/7958337/187238.89e-071.35e-05187
GO:004657811LiverHCCregulation of Ras protein signal transduction100/7958189/187232.42e-031.18e-02100
GO:00072659Oral cavityOSCCRas protein signal transduction185/7305337/187231.95e-094.60e-08185
GO:00465788Oral cavityOSCCregulation of Ras protein signal transduction90/7305189/187239.58e-033.40e-0290
GO:000726515Oral cavityLPRas protein signal transduction109/4623337/187238.44e-047.36e-03109
GO:00072658ProstateBPHRas protein signal transduction101/3107337/187235.64e-102.79e-08101
GO:00510568ProstateBPHregulation of small GTPase mediated signal transduction78/3107302/187232.69e-053.16e-0478
GO:00465787ProstateBPHregulation of Ras protein signal transduction53/3107189/187235.08e-055.24e-0453
GO:0051057ProstateBPHpositive regulation of small GTPase mediated signal transduction20/310772/187231.16e-024.70e-0220
GO:000726514ProstateTumorRas protein signal transduction101/3246337/187236.29e-092.44e-07101
GO:005105613ProstateTumorregulation of small GTPase mediated signal transduction80/3246302/187233.96e-054.57e-0480
GO:004657814ProstateTumorregulation of Ras protein signal transduction53/3246189/187231.63e-041.46e-0353
GO:000726523SkincSCCRas protein signal transduction132/4864337/187236.17e-081.57e-06132
GO:000726519ThyroidPTCRas protein signal transduction162/5968337/187233.16e-101.02e-08162
GO:005105617ThyroidPTCregulation of small GTPase mediated signal transduction132/5968302/187239.26e-061.04e-04132
GO:004657817ThyroidPTCregulation of Ras protein signal transduction88/5968189/187231.62e-051.70e-0488
Page: 1 2 

check button Enriched KEGG pathways.
Pathway IDTissueDisease StageDescriptionGene RatioBg Ratiopvaluep.adjustqvalueCount
Page: 1 

Top

Cell-cell communication analysis

check buttonIdentification of potential cell-cell interactions between two cell types and their ligand-receptor pairs for different disease states
LigandReceptorLRpairPathwayTissueDisease Stage
Page: 1 

Top

Single-cell gene regulatory network inference analysis

check buttonFind out the significant the regulons (TFs) and the target genes of each regulon across cell types for different disease states
TFCell TypeTissueDisease StageTarget GeneRSSRegulon Activity
∗The dot plots of a searched regulon are shown for all cell subpopulations in each disease state of each tissue based on the regulon specific score inferred using pySCENIC and by calculating the average expression.
Page: 1 

Top

Somatic mutation of malignant transformation related genes

check buttonAnnotation of somatic variants for genes involved in malignant transformation
Hugo SymbolVariant ClassVariant ClassificationdbSNP RSHGVScHGVSpHGVSp ShortSWISSPROTBIOTYPESIFTPolyPhenTumor Sample BarcodeTissueHistologySexAgeStageTherapy TypesDrugsOutcome
LRRC59SNVMissense_Mutationc.402N>Cp.Glu134Aspp.E134DQ96AG4protein_codingtolerated(0.16)benign(0.133)TCGA-AC-A23H-01Breastbreast invasive carcinomaFemale>=65I/IIUnknownUnknownPD
LRRC59insertionFrame_Shift_Insnovelc.380_381insTp.Ala128GlyfsTer3p.A128Gfs*3Q96AG4protein_codingTCGA-A2-A0EU-01Breastbreast invasive carcinomaFemale>=65I/IIUnknownUnknownSD
LRRC59insertionIn_Frame_Insnovelc.378_379insCAGCATGCAAGACAACTATTGTCTGTGp.Lys126_Val127insGlnHisAlaArgGlnLeuLeuSerValp.K126_V127insQHARQLLSVQ96AG4protein_codingTCGA-A2-A0EU-01Breastbreast invasive carcinomaFemale>=65I/IIUnknownUnknownSD
LRRC59SNVMissense_Mutationrs139115894c.482N>Ap.Arg161Glnp.R161QQ96AG4protein_codingtolerated(0.18)benign(0.03)TCGA-2W-A8YY-01Cervixcervical & endocervical cancerFemale<65I/IIChemotherapycisplatinCR
LRRC59SNVMissense_Mutationnovelc.361N>Cp.Asp121Hisp.D121HQ96AG4protein_codingdeleterious(0)possibly_damaging(0.79)TCGA-C5-A1MP-01Cervixcervical & endocervical cancerFemale<65I/IIUnknownUnknownSD
LRRC59insertionIn_Frame_Insnovelc.437_438insCCTGCAATCCCAp.Leu145_Gln146insHisLeuGlnSerp.L145_Q146insHLQSQ96AG4protein_codingTCGA-DS-A1OD-01Cervixcervical & endocervical cancerFemale<65I/IIChemotherapycisplatinSD
LRRC59SNVMissense_Mutationc.443N>Cp.Met148Thrp.M148TQ96AG4protein_codingdeleterious(0)possibly_damaging(0.637)TCGA-AA-3815-01Colorectumcolon adenocarcinomaFemale>=65I/IIUnknownUnknownSD
LRRC59SNVMissense_Mutationrs200977500c.451G>Ap.Val151Metp.V151MQ96AG4protein_codingtolerated(0.11)benign(0.007)TCGA-AA-A010-01Colorectumcolon adenocarcinomaFemale<65I/IIChemotherapyfolinicCR
LRRC59SNVMissense_Mutationrs143077743c.481N>Tp.Arg161Trpp.R161WQ96AG4protein_codingdeleterious(0)probably_damaging(0.93)TCGA-CM-6674-01Colorectumcolon adenocarcinomaMale<65I/IIUnknownUnknownSD
LRRC59SNVMissense_Mutationc.629N>Gp.Lys210Argp.K210RQ96AG4protein_codingtolerated(0.21)possibly_damaging(0.531)TCGA-AF-2693-01Colorectumrectum adenocarcinomaMale>=65I/IIUnknownUnknownSD
Page: 1 2 3 4 

Top

Related drugs of malignant transformation related genes

check buttonIdentification of chemicals and drugs interact with genes involved in malignant transfromation
(DGIdb 4.0)
Entrez IDSymbolCategoryInteraction TypesDrug Claim NameDrug NamePMIDs
55379LRRC59NAMELAGATRANMELAGATRAN22494098
Page: 1