
|
|||||
|
 | |
| |
| |
| |
| |
| |
|
Gene: LRRC58 |
Gene summary for LRRC58 |
| Gene information | Species | Human | Gene symbol | LRRC58 | Gene ID | 116064 |
| Gene name | leucine rich repeat containing 58 | |
| Gene Alias | LRRC58 | |
| Cytomap | 3q13.33 | |
| Gene Type | protein-coding | GO ID | NA | UniProtAcc | Q96CX6 |
Top |
Malignant transformation analysis |
| Identification of the aberrant gene expression in precancerous and cancerous lesions by comparing the gene expression of stem-like cells in diseased tissues with normal stem cells |
| Entrez ID | Symbol | Replicates | Species | Organ | Tissue | Adj P-value | Log2FC | Malignancy |
| 116064 | LRRC58 | LZE2T | Human | Esophagus | ESCC | 4.05e-03 | 9.09e-01 | 0.082 |
| 116064 | LRRC58 | LZE4T | Human | Esophagus | ESCC | 1.36e-16 | 4.17e-01 | 0.0811 |
| 116064 | LRRC58 | LZE7T | Human | Esophagus | ESCC | 2.25e-04 | 5.47e-01 | 0.0667 |
| 116064 | LRRC58 | LZE22D1 | Human | Esophagus | HGIN | 2.80e-04 | 4.74e-02 | 0.0595 |
| 116064 | LRRC58 | LZE22T | Human | Esophagus | ESCC | 3.56e-03 | 3.24e-01 | 0.068 |
| 116064 | LRRC58 | LZE24T | Human | Esophagus | ESCC | 1.86e-14 | 5.84e-01 | 0.0596 |
| 116064 | LRRC58 | LZE21T | Human | Esophagus | ESCC | 2.08e-03 | -8.11e-03 | 0.0655 |
| 116064 | LRRC58 | P1T-E | Human | Esophagus | ESCC | 1.99e-02 | 4.38e-01 | 0.0875 |
| 116064 | LRRC58 | P2T-E | Human | Esophagus | ESCC | 2.00e-25 | 4.53e-01 | 0.1177 |
| 116064 | LRRC58 | P4T-E | Human | Esophagus | ESCC | 8.70e-13 | 4.49e-01 | 0.1323 |
| 116064 | LRRC58 | P5T-E | Human | Esophagus | ESCC | 2.21e-30 | 5.86e-01 | 0.1327 |
| 116064 | LRRC58 | P8T-E | Human | Esophagus | ESCC | 1.26e-33 | 5.92e-01 | 0.0889 |
| 116064 | LRRC58 | P9T-E | Human | Esophagus | ESCC | 2.00e-17 | 3.92e-01 | 0.1131 |
| 116064 | LRRC58 | P10T-E | Human | Esophagus | ESCC | 2.59e-54 | 1.03e+00 | 0.116 |
| 116064 | LRRC58 | P11T-E | Human | Esophagus | ESCC | 1.07e-03 | 3.95e-01 | 0.1426 |
| 116064 | LRRC58 | P12T-E | Human | Esophagus | ESCC | 5.08e-17 | 2.60e-01 | 0.1122 |
| 116064 | LRRC58 | P15T-E | Human | Esophagus | ESCC | 4.27e-26 | 7.41e-01 | 0.1149 |
| 116064 | LRRC58 | P16T-E | Human | Esophagus | ESCC | 2.43e-47 | 9.15e-01 | 0.1153 |
| 116064 | LRRC58 | P20T-E | Human | Esophagus | ESCC | 4.76e-16 | 5.66e-01 | 0.1124 |
| 116064 | LRRC58 | P21T-E | Human | Esophagus | ESCC | 1.26e-31 | 5.35e-01 | 0.1617 |
| Page: 1 2 3 4 5 6 |
| Tissue | Expression Dynamics | Abbreviation |
| Esophagus | 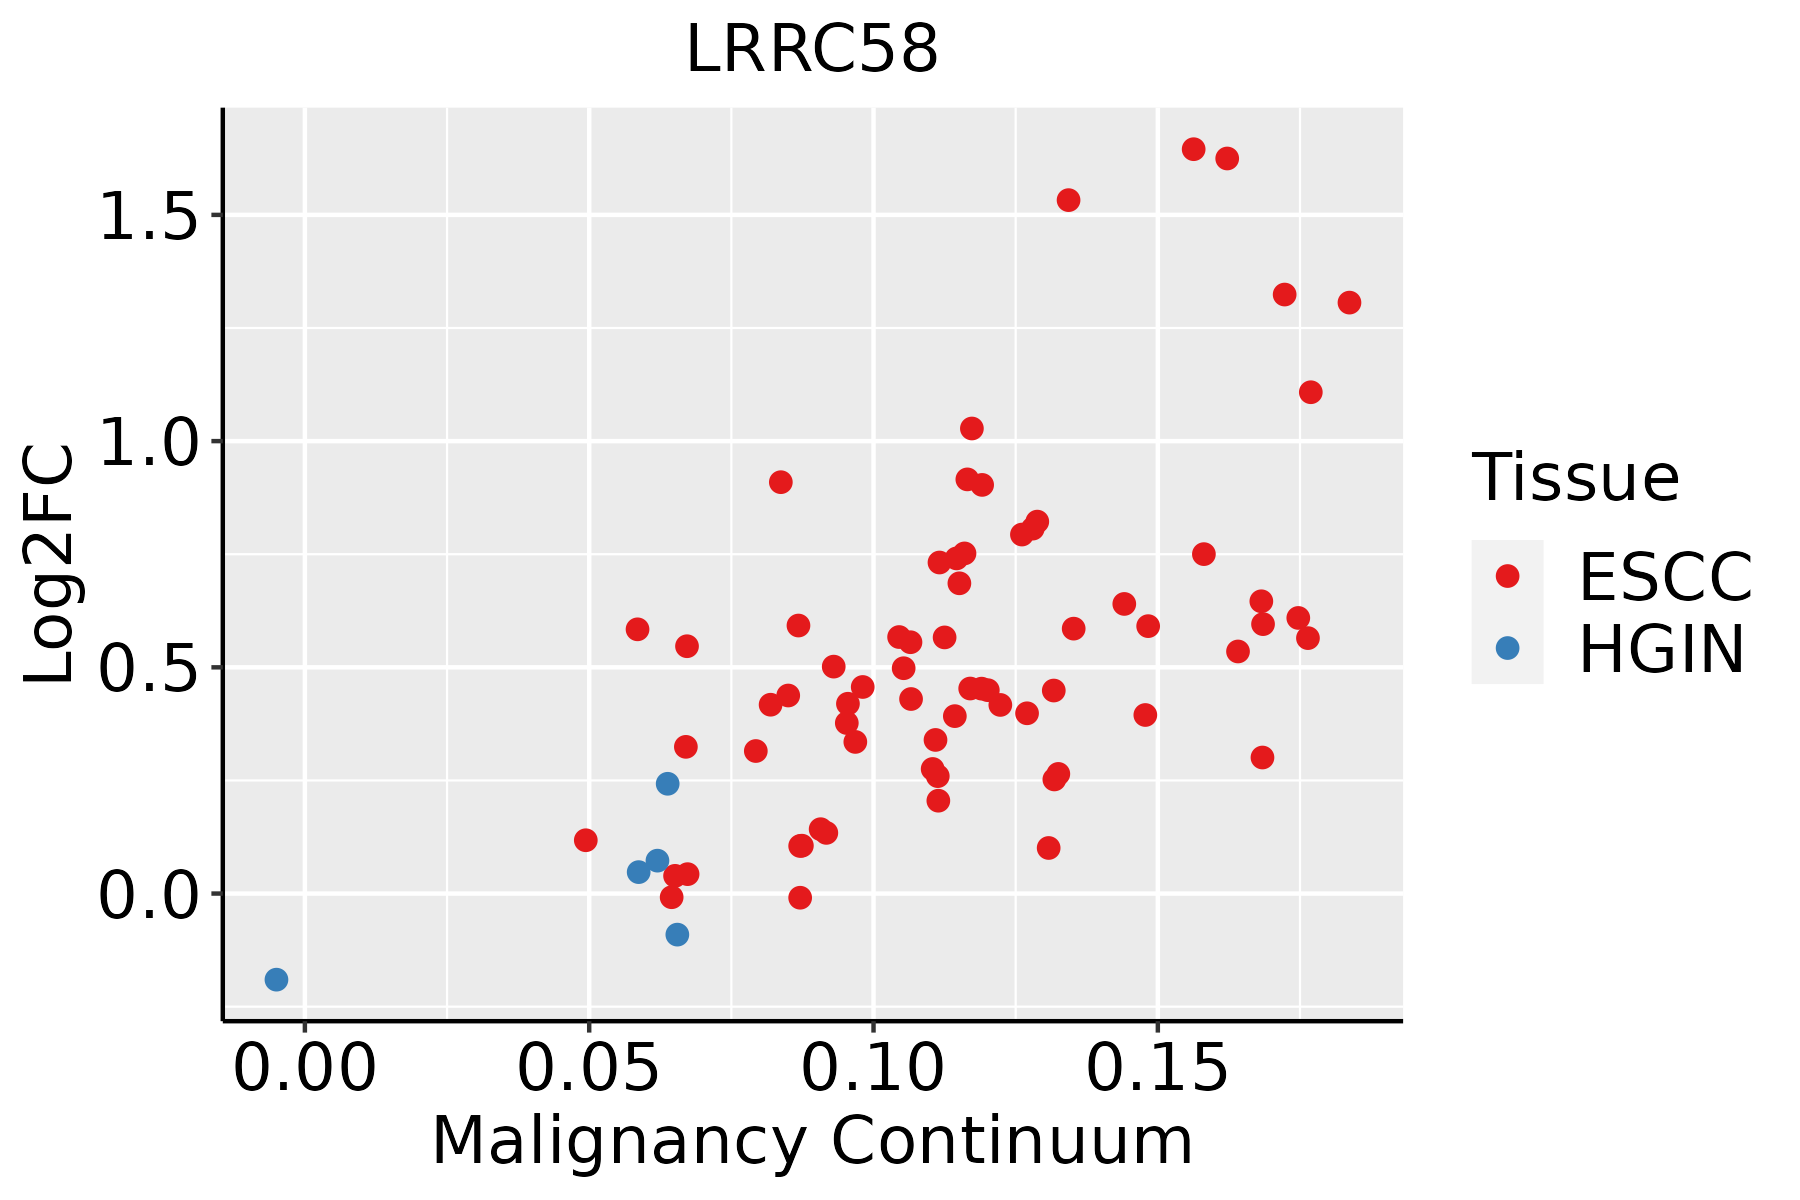 | ESCC: Esophageal squamous cell carcinoma |
| HGIN: High-grade intraepithelial neoplasias | ||
| LGIN: Low-grade intraepithelial neoplasias | ||
| Liver | 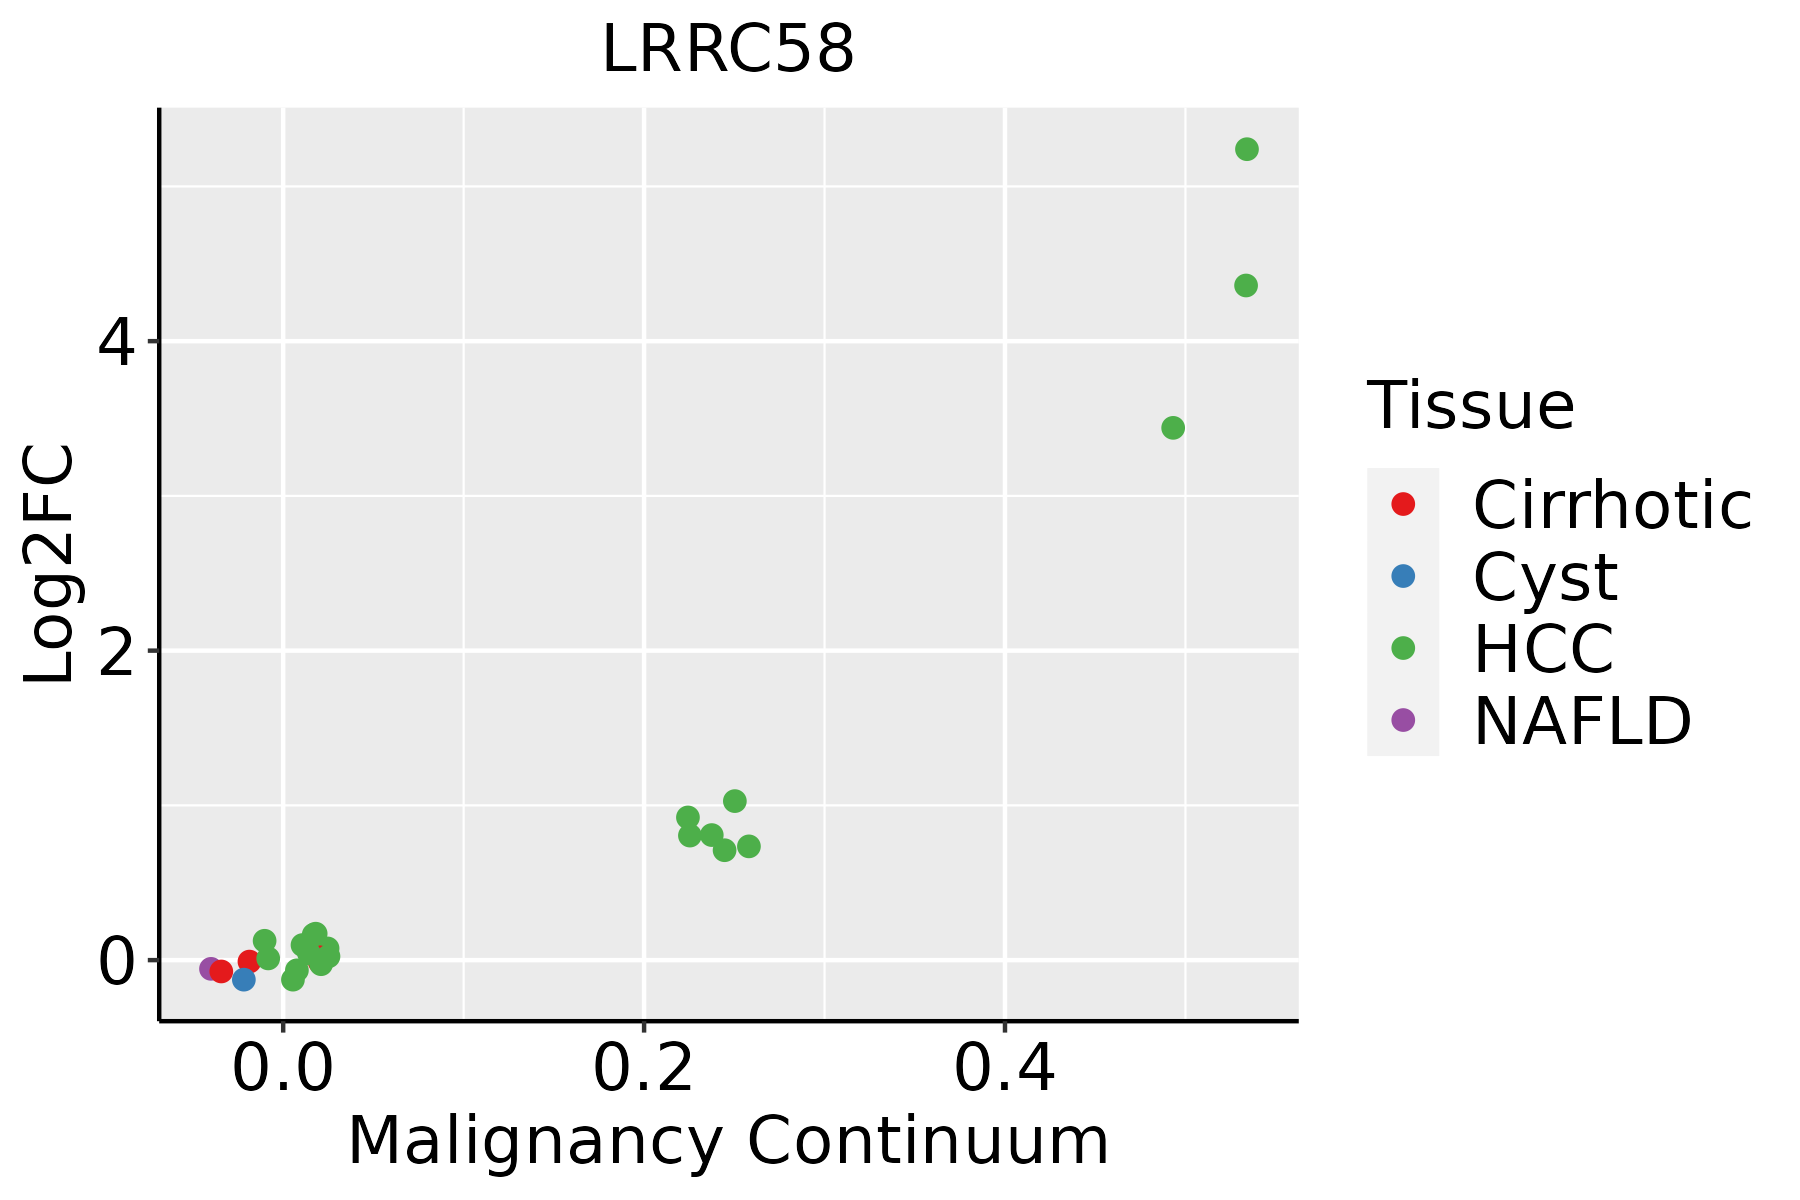 | HCC: Hepatocellular carcinoma |
| NAFLD: Non-alcoholic fatty liver disease | ||
| Oral Cavity | 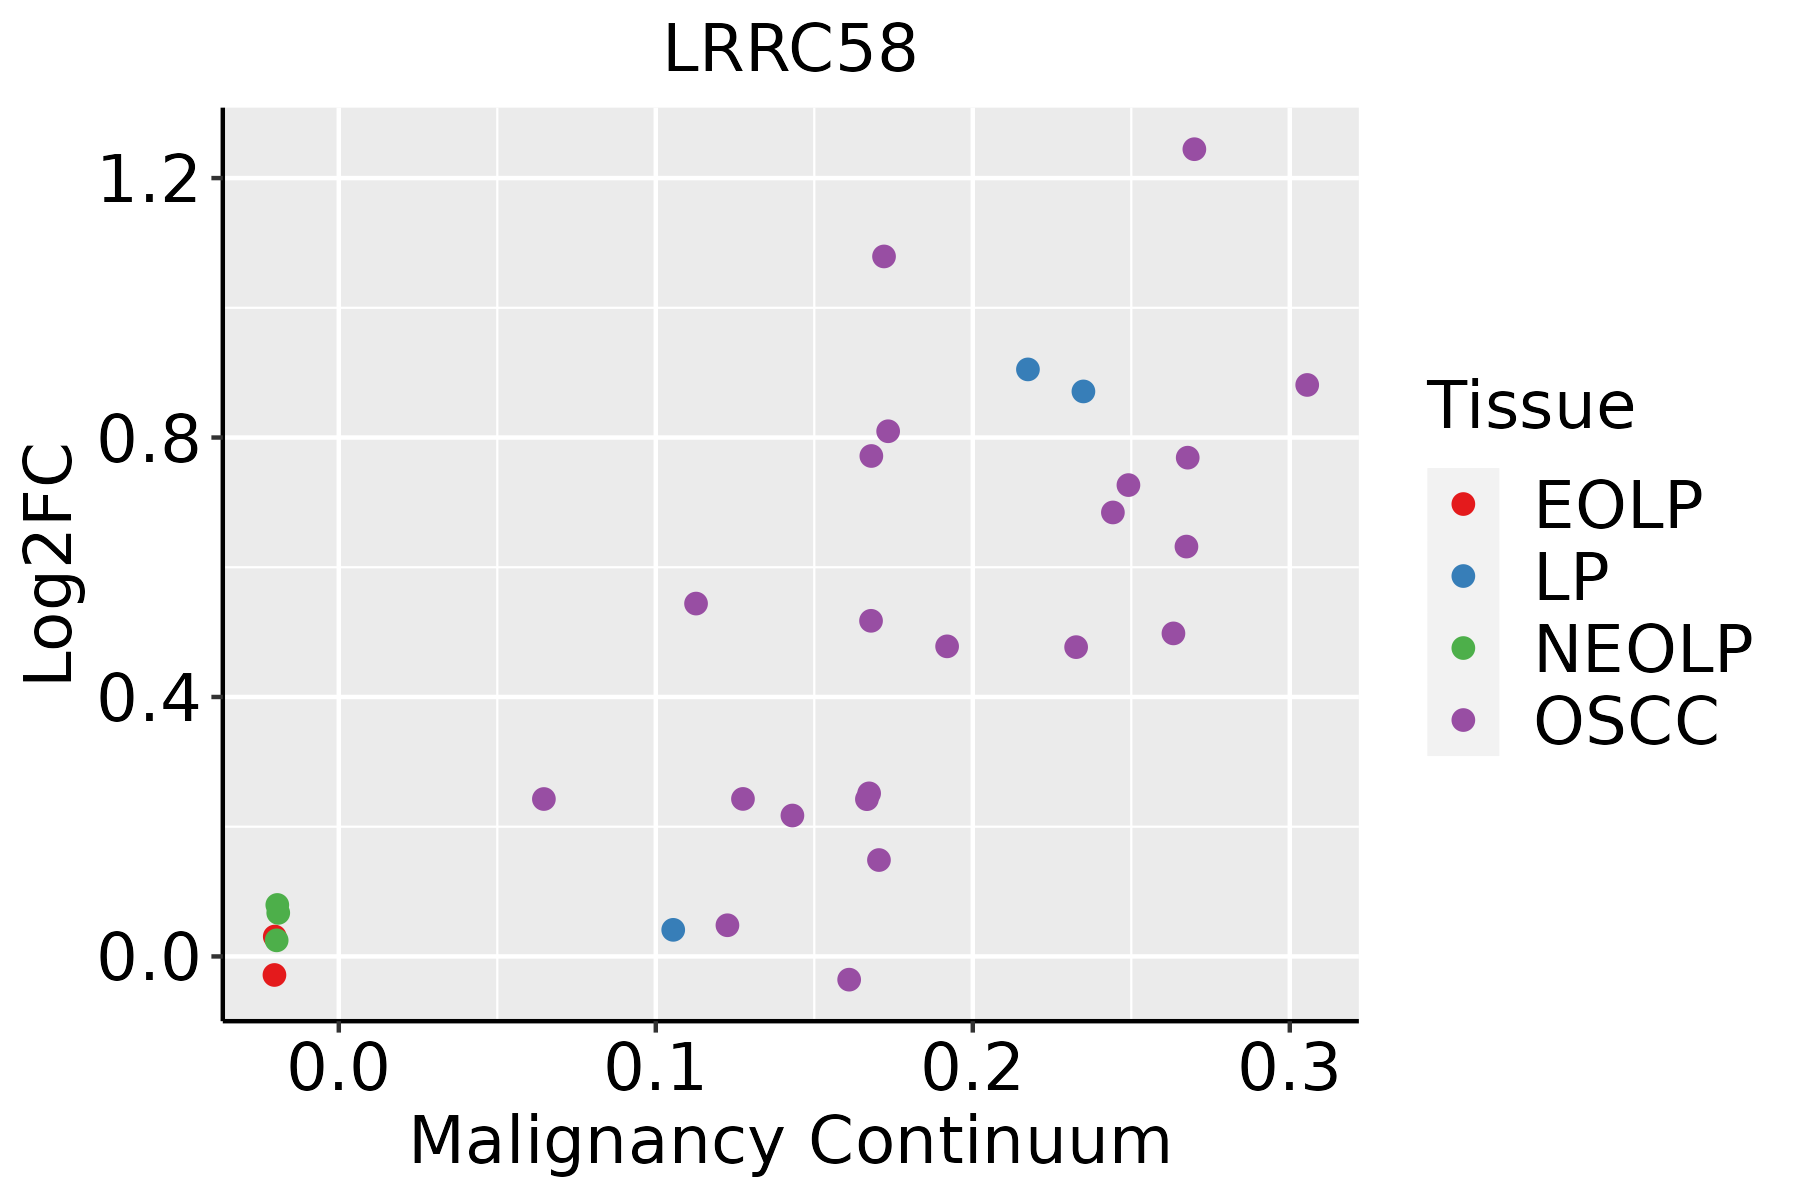 | EOLP: Erosive Oral lichen planus |
| LP: leukoplakia | ||
| NEOLP: Non-erosive oral lichen planus | ||
| OSCC: Oral squamous cell carcinoma | ||
| Prostate | 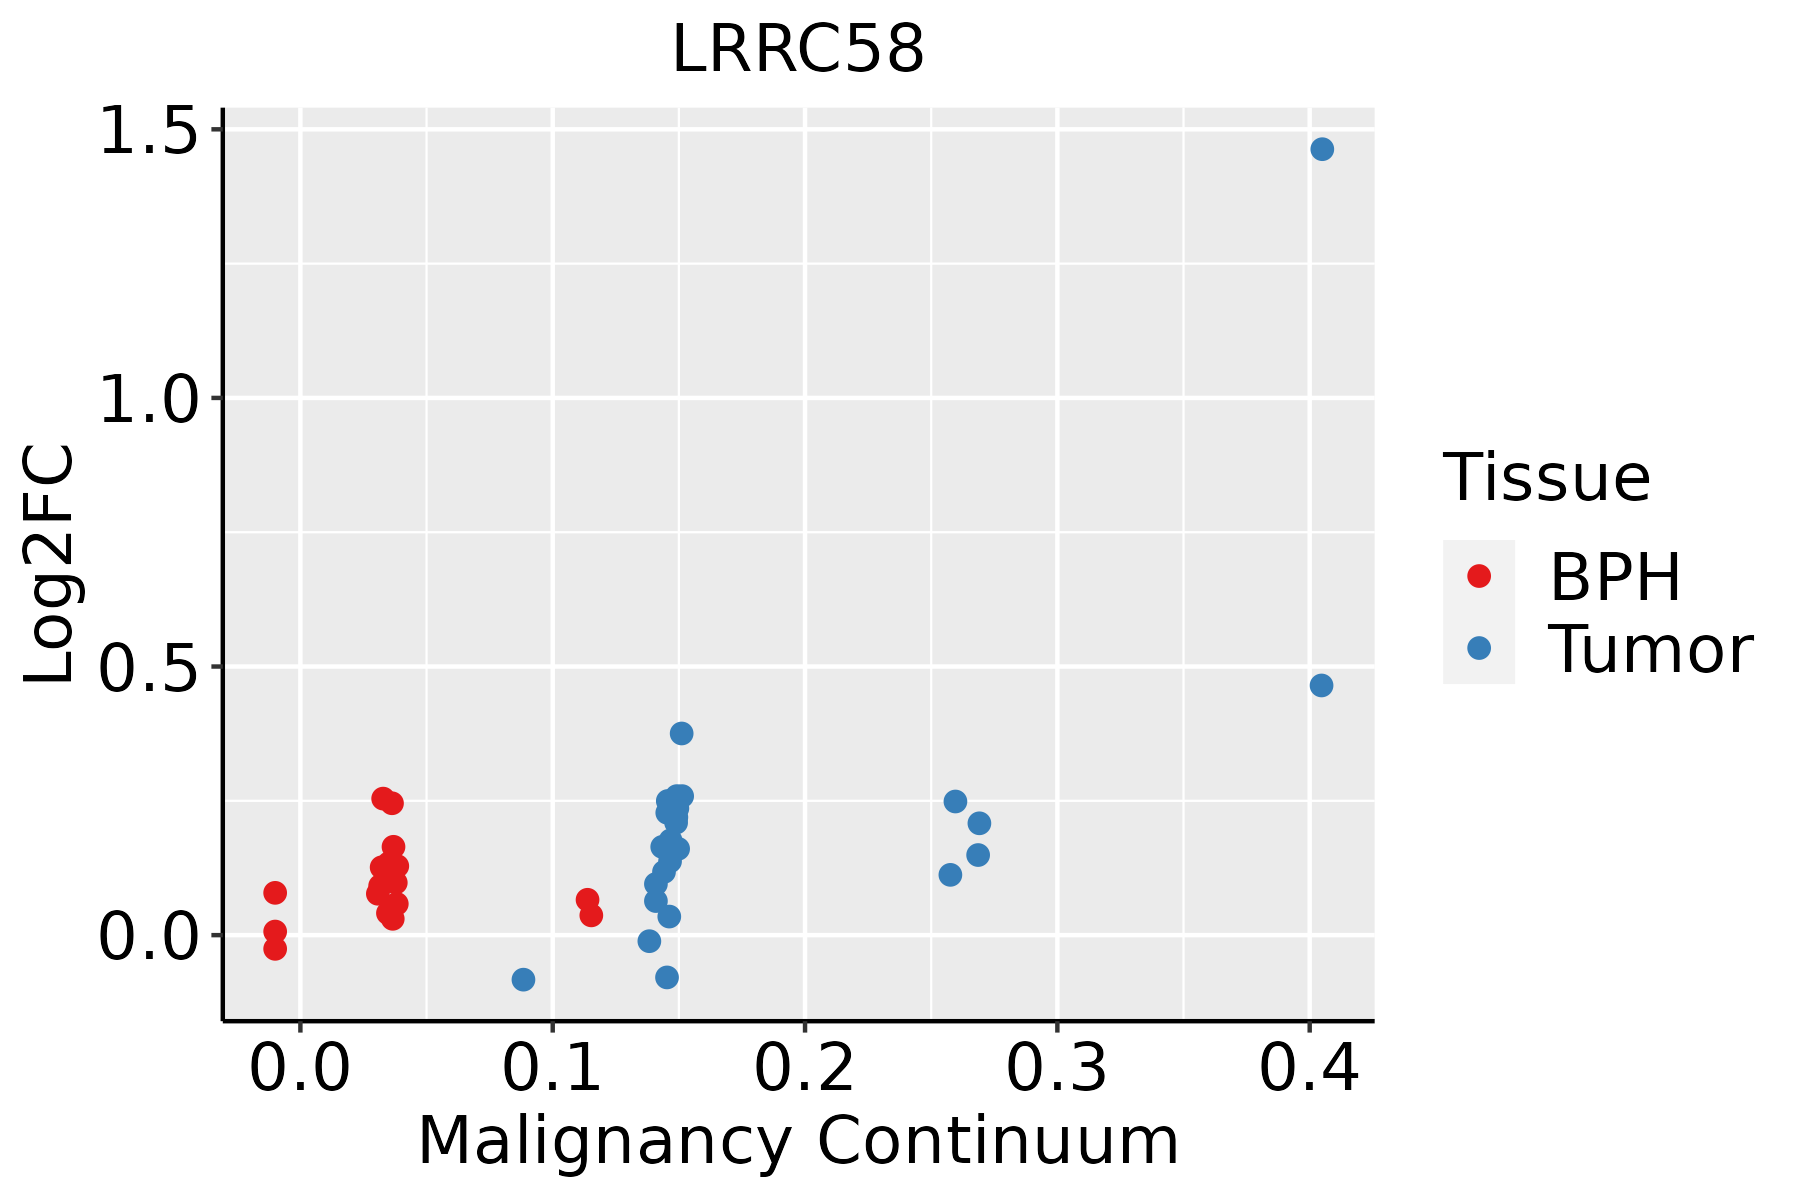 | BPH: Benign Prostatic Hyperplasia |
| Skin | 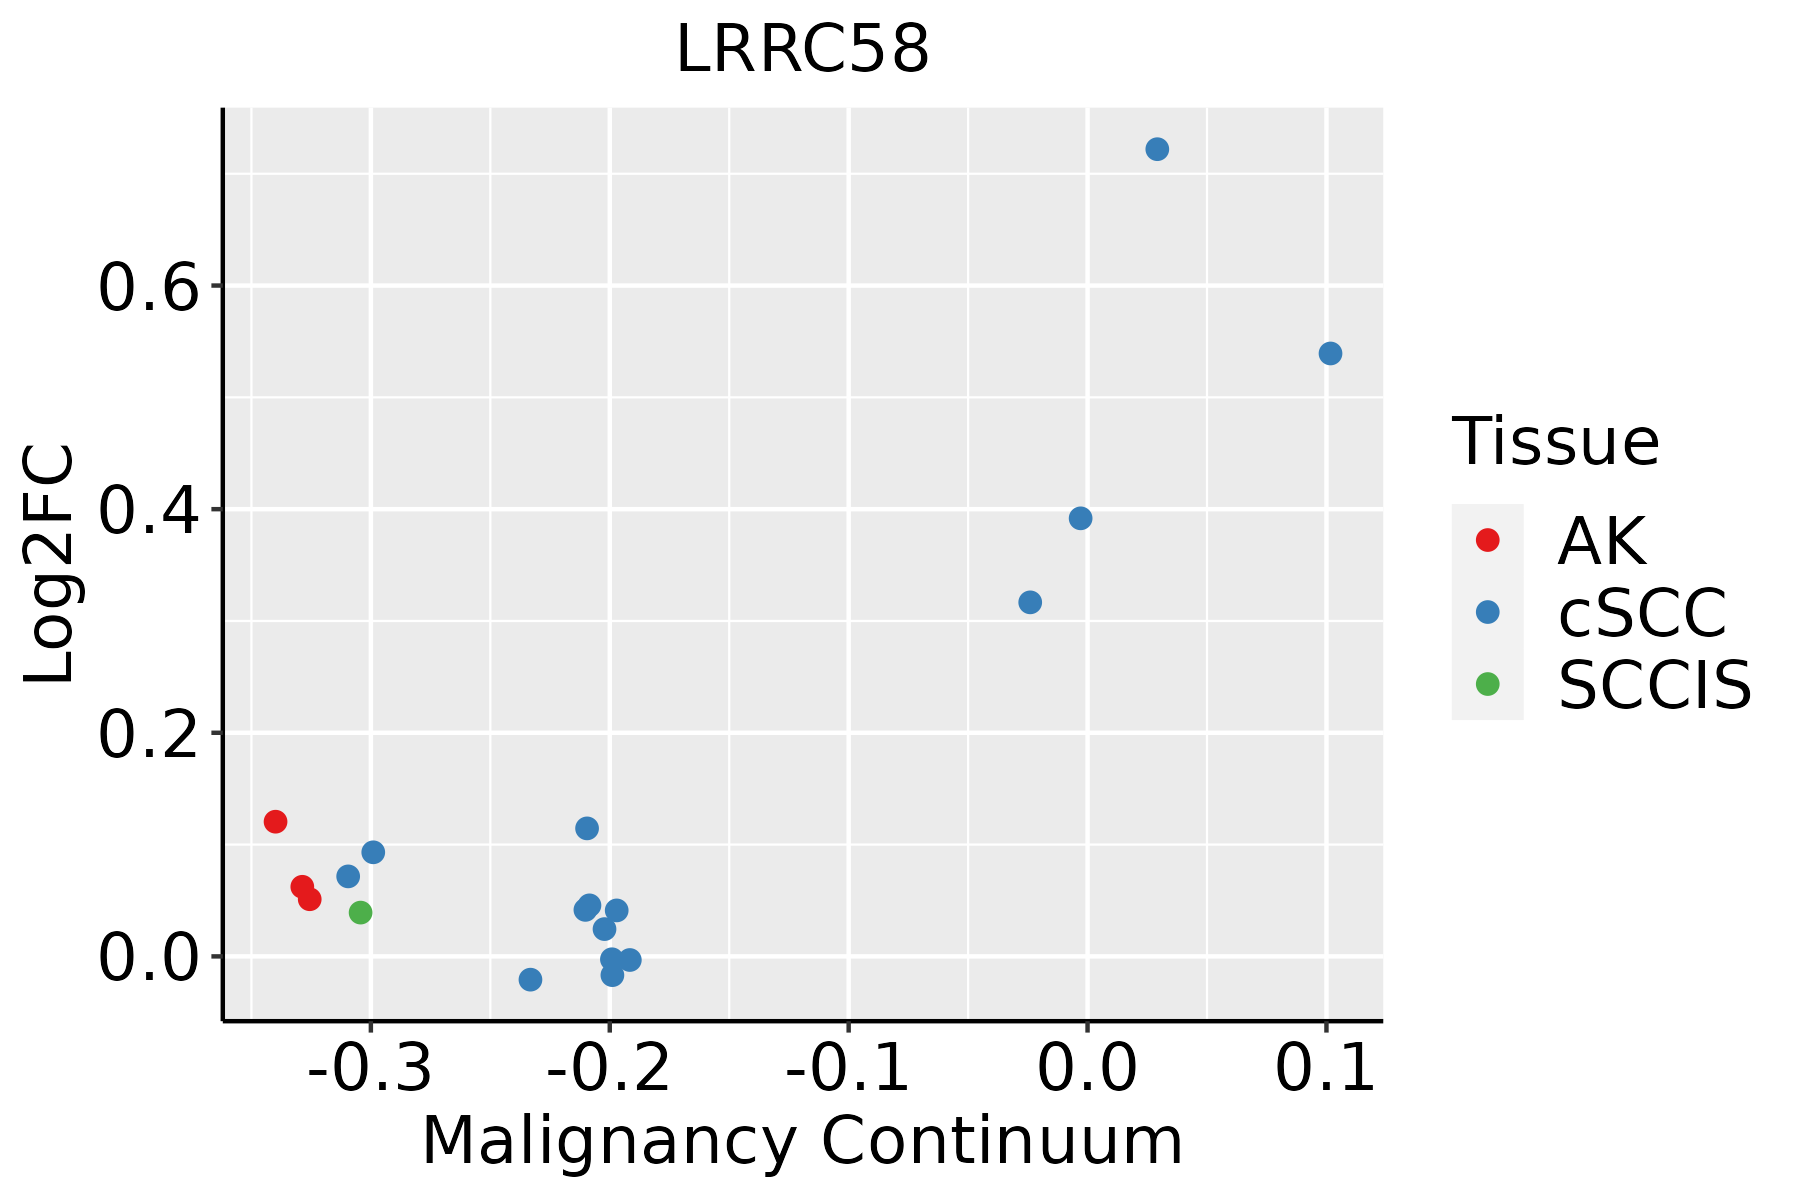 | AK: Actinic keratosis |
| cSCC: Cutaneous squamous cell carcinoma | ||
| SCCIS:squamous cell carcinoma in situ | ||
| Thyroid |  | ATC: Anaplastic thyroid cancer |
| HT: Hashimoto's thyroiditis | ||
| PTC: Papillary thyroid cancer |
| ∗log2FC in expression of this searched gene in stem-like cells from each diseased tissue sample relative to stem-like cells in normal samples in each tissue plotted against the malignancy continuum. Samples are colored based on if they are from different disease stage. |
Top |
Malignant transformation related pathway analysis |
| Find out the enriched GO biological processes and KEGG pathways involved in transition from healthy to precancer to cancer |
| Tissue | Disease Stage | Enriched GO biological Processes |
| Colorectum | AD |  |
| Colorectum | SER |  |
| Colorectum | MSS |  |
| Colorectum | MSI-H |  |
| Colorectum | FAP |  |
| ∗Top 15 enriched GO BP terms are showed in the bar plot of each disease state in each tissue. Each row represents a significant GO biological process which is colored according to the -log10(p.adjust). |
| Page: 1 2 3 4 5 6 7 8 9 |
| GO ID | Tissue | Disease Stage | Description | Gene Ratio | Bg Ratio | pvalue | p.adjust | Count |
| Page: 1 |
| Pathway ID | Tissue | Disease Stage | Description | Gene Ratio | Bg Ratio | pvalue | p.adjust | qvalue | Count |
| Page: 1 |
Top |
Cell-cell communication analysis |
| Identification of potential cell-cell interactions between two cell types and their ligand-receptor pairs for different disease states |
| Ligand | Receptor | LRpair | Pathway | Tissue | Disease Stage |
| Page: 1 |
Top |
Single-cell gene regulatory network inference analysis |
| Find out the significant the regulons (TFs) and the target genes of each regulon across cell types for different disease states |
| TF | Cell Type | Tissue | Disease Stage | Target Gene | RSS | Regulon Activity |
| ∗The dot plots of a searched regulon are shown for all cell subpopulations in each disease state of each tissue based on the regulon specific score inferred using pySCENIC and by calculating the average expression. |
| Page: 1 |
Top |
Somatic mutation of malignant transformation related genes |
| Annotation of somatic variants for genes involved in malignant transformation |
| Hugo Symbol | Variant Class | Variant Classification | dbSNP RS | HGVSc | HGVSp | HGVSp Short | SWISSPROT | BIOTYPE | SIFT | PolyPhen | Tumor Sample Barcode | Tissue | Histology | Sex | Age | Stage | Therapy Types | Drugs | Outcome |
| LRRC58 | SNV | Missense_Mutation | c.438G>C | p.Gln146His | p.Q146H | Q96CX6 | protein_coding | tolerated(0.13) | benign(0.005) | TCGA-IR-A3LA-01 | Cervix | cervical & endocervical cancer | Female | <65 | I/II | Chemotherapy | cisplatin | CR | |
| LRRC58 | SNV | Missense_Mutation | c.664N>C | p.Asn222His | p.N222H | Q96CX6 | protein_coding | deleterious(0) | probably_damaging(0.999) | TCGA-AA-A00N-01 | Colorectum | colon adenocarcinoma | Male | >=65 | I/II | Unknown | Unknown | PD | |
| LRRC58 | SNV | Missense_Mutation | c.1076N>C | p.Ser359Thr | p.S359T | Q96CX6 | protein_coding | tolerated(0.44) | benign(0.02) | TCGA-D5-5538-01 | Colorectum | colon adenocarcinoma | Female | <65 | III/IV | Chemotherapy | calcium | PD | |
| LRRC58 | SNV | Missense_Mutation | rs751239277 | c.818N>A | p.Arg273Gln | p.R273Q | Q96CX6 | protein_coding | tolerated(0.23) | benign(0.322) | TCGA-EI-6917-01 | Colorectum | rectum adenocarcinoma | Male | <65 | III/IV | Chemotherapy | 5fluorouracil+oxaciplatina+l-folinian | SD |
| LRRC58 | SNV | Missense_Mutation | rs201989674 | c.1088G>A | p.Arg363His | p.R363H | Q96CX6 | protein_coding | tolerated(1) | benign(0) | TCGA-AJ-A3EK-01 | Endometrium | uterine corpus endometrioid carcinoma | Female | <65 | I/II | Chemotherapy | carboplatin | CR |
| LRRC58 | SNV | Missense_Mutation | rs751239277 | c.818G>A | p.Arg273Gln | p.R273Q | Q96CX6 | protein_coding | tolerated(0.23) | benign(0.322) | TCGA-AP-A056-01 | Endometrium | uterine corpus endometrioid carcinoma | Female | <65 | I/II | Unknown | Unknown | SD |
| LRRC58 | SNV | Missense_Mutation | c.617N>A | p.Pro206His | p.P206H | Q96CX6 | protein_coding | deleterious(0) | probably_damaging(0.937) | TCGA-AP-A0LM-01 | Endometrium | uterine corpus endometrioid carcinoma | Female | <65 | III/IV | Chemotherapy | cisplatin | SD | |
| LRRC58 | SNV | Missense_Mutation | novel | c.926G>A | p.Cys309Tyr | p.C309Y | Q96CX6 | protein_coding | tolerated(0.07) | probably_damaging(0.915) | TCGA-AP-A1DK-01 | Endometrium | uterine corpus endometrioid carcinoma | Female | <65 | I/II | Unknown | Unknown | SD |
| LRRC58 | SNV | Missense_Mutation | rs200466593 | c.1087C>T | p.Arg363Cys | p.R363C | Q96CX6 | protein_coding | tolerated(0.05) | benign(0.153) | TCGA-AX-A06F-01 | Endometrium | uterine corpus endometrioid carcinoma | Female | <65 | III/IV | Chemotherapy | carboplatin | SD |
| LRRC58 | SNV | Missense_Mutation | novel | c.1072N>T | p.Ala358Ser | p.A358S | Q96CX6 | protein_coding | tolerated(0.77) | benign(0.031) | TCGA-AX-A1CE-01 | Endometrium | uterine corpus endometrioid carcinoma | Female | <65 | I/II | Unspecific | Paclitaxel | SD |
| Page: 1 2 |
Top |
Related drugs of malignant transformation related genes |
| Identification of chemicals and drugs interact with genes involved in malignant transfromation |
| (DGIdb 4.0) |
| Entrez ID | Symbol | Category | Interaction Types | Drug Claim Name | Drug Name | PMIDs |
| Page: 1 |

Copyright 2023-Present -The University of Texas Health Science Center at Houston |