
|
|||||
|
 | |
| |
| |
| |
| |
| |
|
Gene: LRRC41 |
Gene summary for LRRC41 |
| Gene information | Species | Human | Gene symbol | LRRC41 | Gene ID | 10489 |
| Gene name | leucine rich repeat containing 41 | |
| Gene Alias | MUF1 | |
| Cytomap | 1p34.1-p33 | |
| Gene Type | protein-coding | GO ID | GO:0006464 | UniProtAcc | Q15345 |
Top |
Malignant transformation analysis |
| Identification of the aberrant gene expression in precancerous and cancerous lesions by comparing the gene expression of stem-like cells in diseased tissues with normal stem cells |
| Entrez ID | Symbol | Replicates | Species | Organ | Tissue | Adj P-value | Log2FC | Malignancy |
| 10489 | LRRC41 | LZE2T | Human | Esophagus | ESCC | 8.25e-03 | 1.34e-01 | 0.082 |
| 10489 | LRRC41 | LZE4T | Human | Esophagus | ESCC | 4.13e-11 | 2.06e-01 | 0.0811 |
| 10489 | LRRC41 | LZE7T | Human | Esophagus | ESCC | 6.42e-05 | 6.12e-01 | 0.0667 |
| 10489 | LRRC41 | LZE8T | Human | Esophagus | ESCC | 1.92e-13 | 3.85e-01 | 0.067 |
| 10489 | LRRC41 | LZE20T | Human | Esophagus | ESCC | 9.54e-07 | 2.80e-01 | 0.0662 |
| 10489 | LRRC41 | LZE22D1 | Human | Esophagus | HGIN | 1.98e-02 | 7.42e-03 | 0.0595 |
| 10489 | LRRC41 | LZE22T | Human | Esophagus | ESCC | 5.20e-04 | 1.88e-01 | 0.068 |
| 10489 | LRRC41 | LZE24T | Human | Esophagus | ESCC | 2.93e-17 | 4.55e-01 | 0.0596 |
| 10489 | LRRC41 | LZE6T | Human | Esophagus | ESCC | 2.89e-02 | 6.10e-02 | 0.0845 |
| 10489 | LRRC41 | P1T-E | Human | Esophagus | ESCC | 1.18e-12 | 5.09e-01 | 0.0875 |
| 10489 | LRRC41 | P2T-E | Human | Esophagus | ESCC | 4.62e-44 | 8.48e-01 | 0.1177 |
| 10489 | LRRC41 | P4T-E | Human | Esophagus | ESCC | 2.61e-18 | 1.83e-01 | 0.1323 |
| 10489 | LRRC41 | P5T-E | Human | Esophagus | ESCC | 3.80e-10 | 2.24e-01 | 0.1327 |
| 10489 | LRRC41 | P8T-E | Human | Esophagus | ESCC | 3.60e-28 | 5.40e-01 | 0.0889 |
| 10489 | LRRC41 | P9T-E | Human | Esophagus | ESCC | 1.07e-16 | 1.93e-01 | 0.1131 |
| 10489 | LRRC41 | P10T-E | Human | Esophagus | ESCC | 4.79e-33 | 6.62e-01 | 0.116 |
| 10489 | LRRC41 | P11T-E | Human | Esophagus | ESCC | 7.17e-14 | 8.51e-01 | 0.1426 |
| 10489 | LRRC41 | P12T-E | Human | Esophagus | ESCC | 2.97e-24 | 5.36e-01 | 0.1122 |
| 10489 | LRRC41 | P15T-E | Human | Esophagus | ESCC | 3.48e-30 | 5.35e-01 | 0.1149 |
| 10489 | LRRC41 | P16T-E | Human | Esophagus | ESCC | 6.22e-28 | 4.57e-01 | 0.1153 |
| Page: 1 2 3 4 5 6 |
| Tissue | Expression Dynamics | Abbreviation |
| Esophagus | 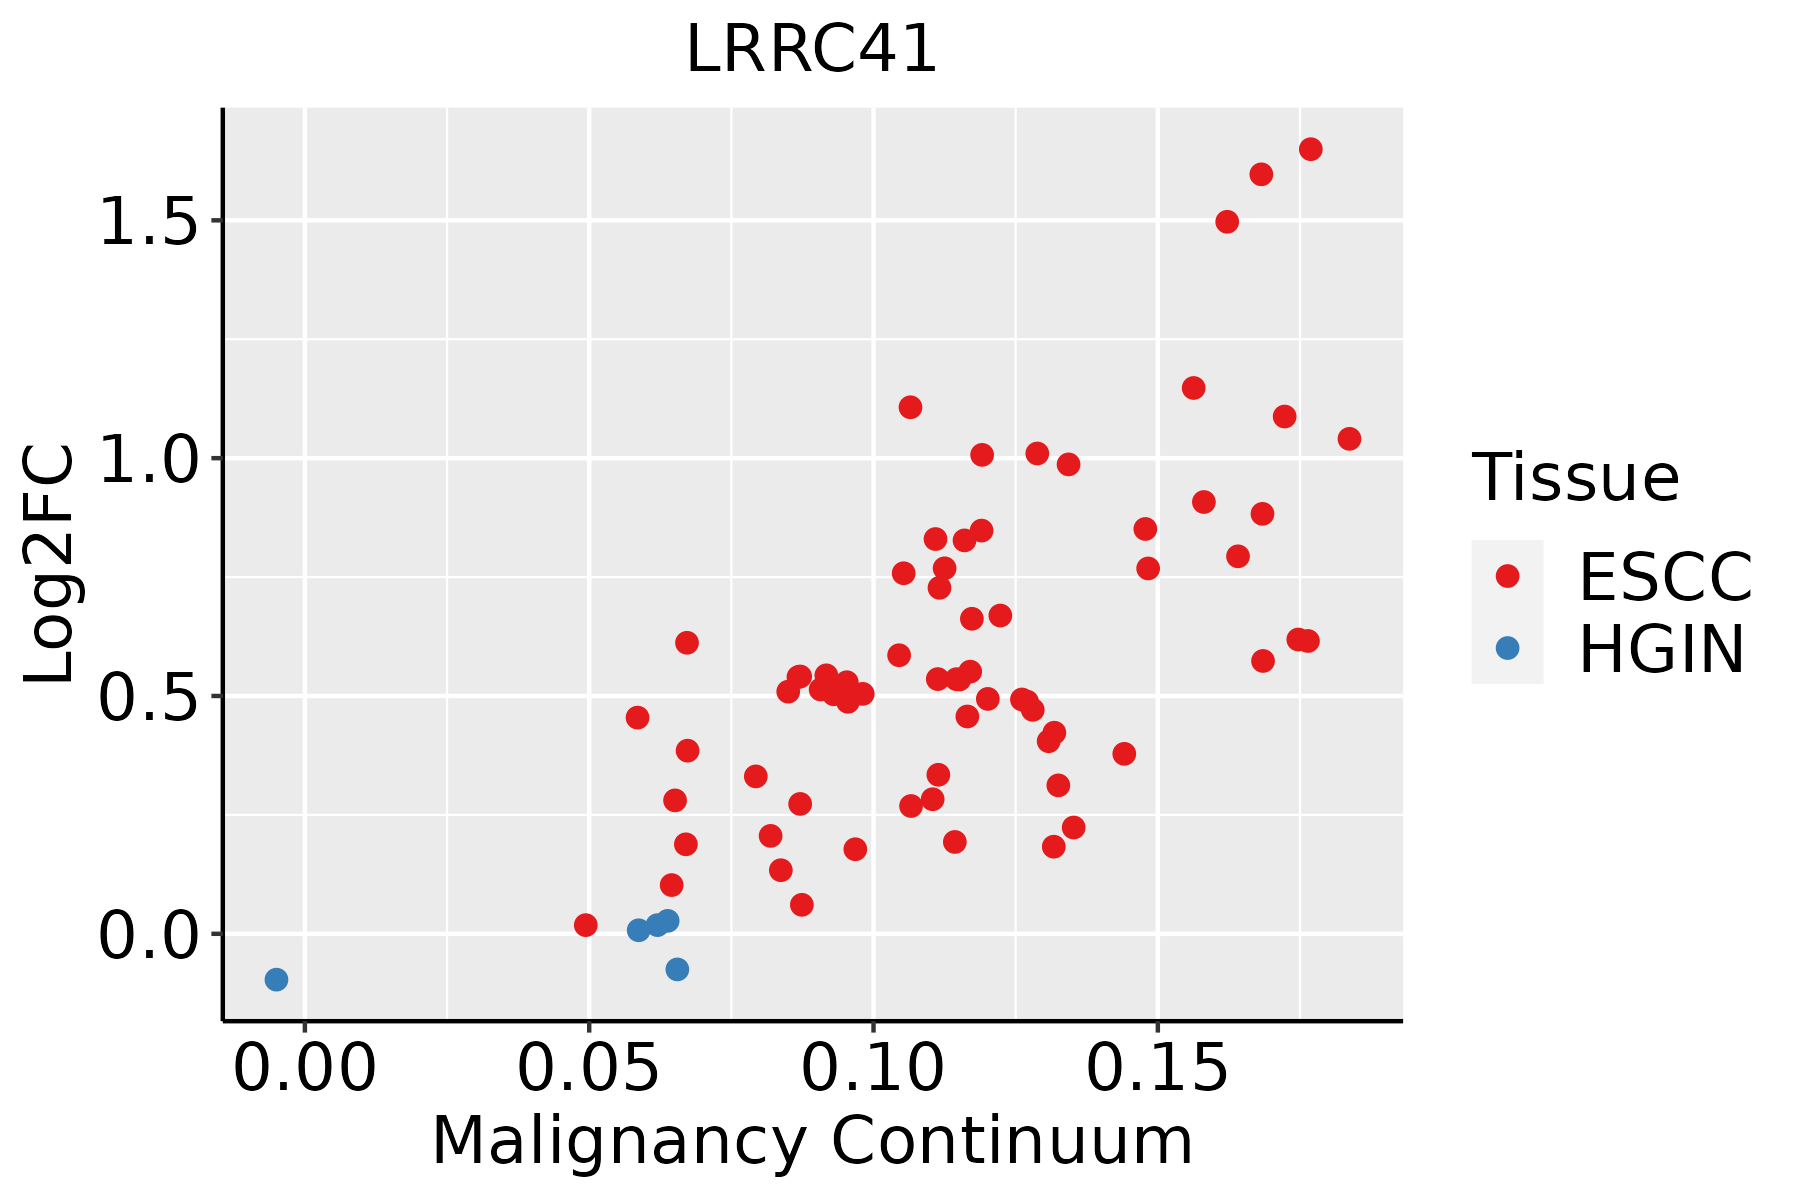 | ESCC: Esophageal squamous cell carcinoma |
| HGIN: High-grade intraepithelial neoplasias | ||
| LGIN: Low-grade intraepithelial neoplasias | ||
| Liver |  | HCC: Hepatocellular carcinoma |
| NAFLD: Non-alcoholic fatty liver disease | ||
| Oral Cavity | 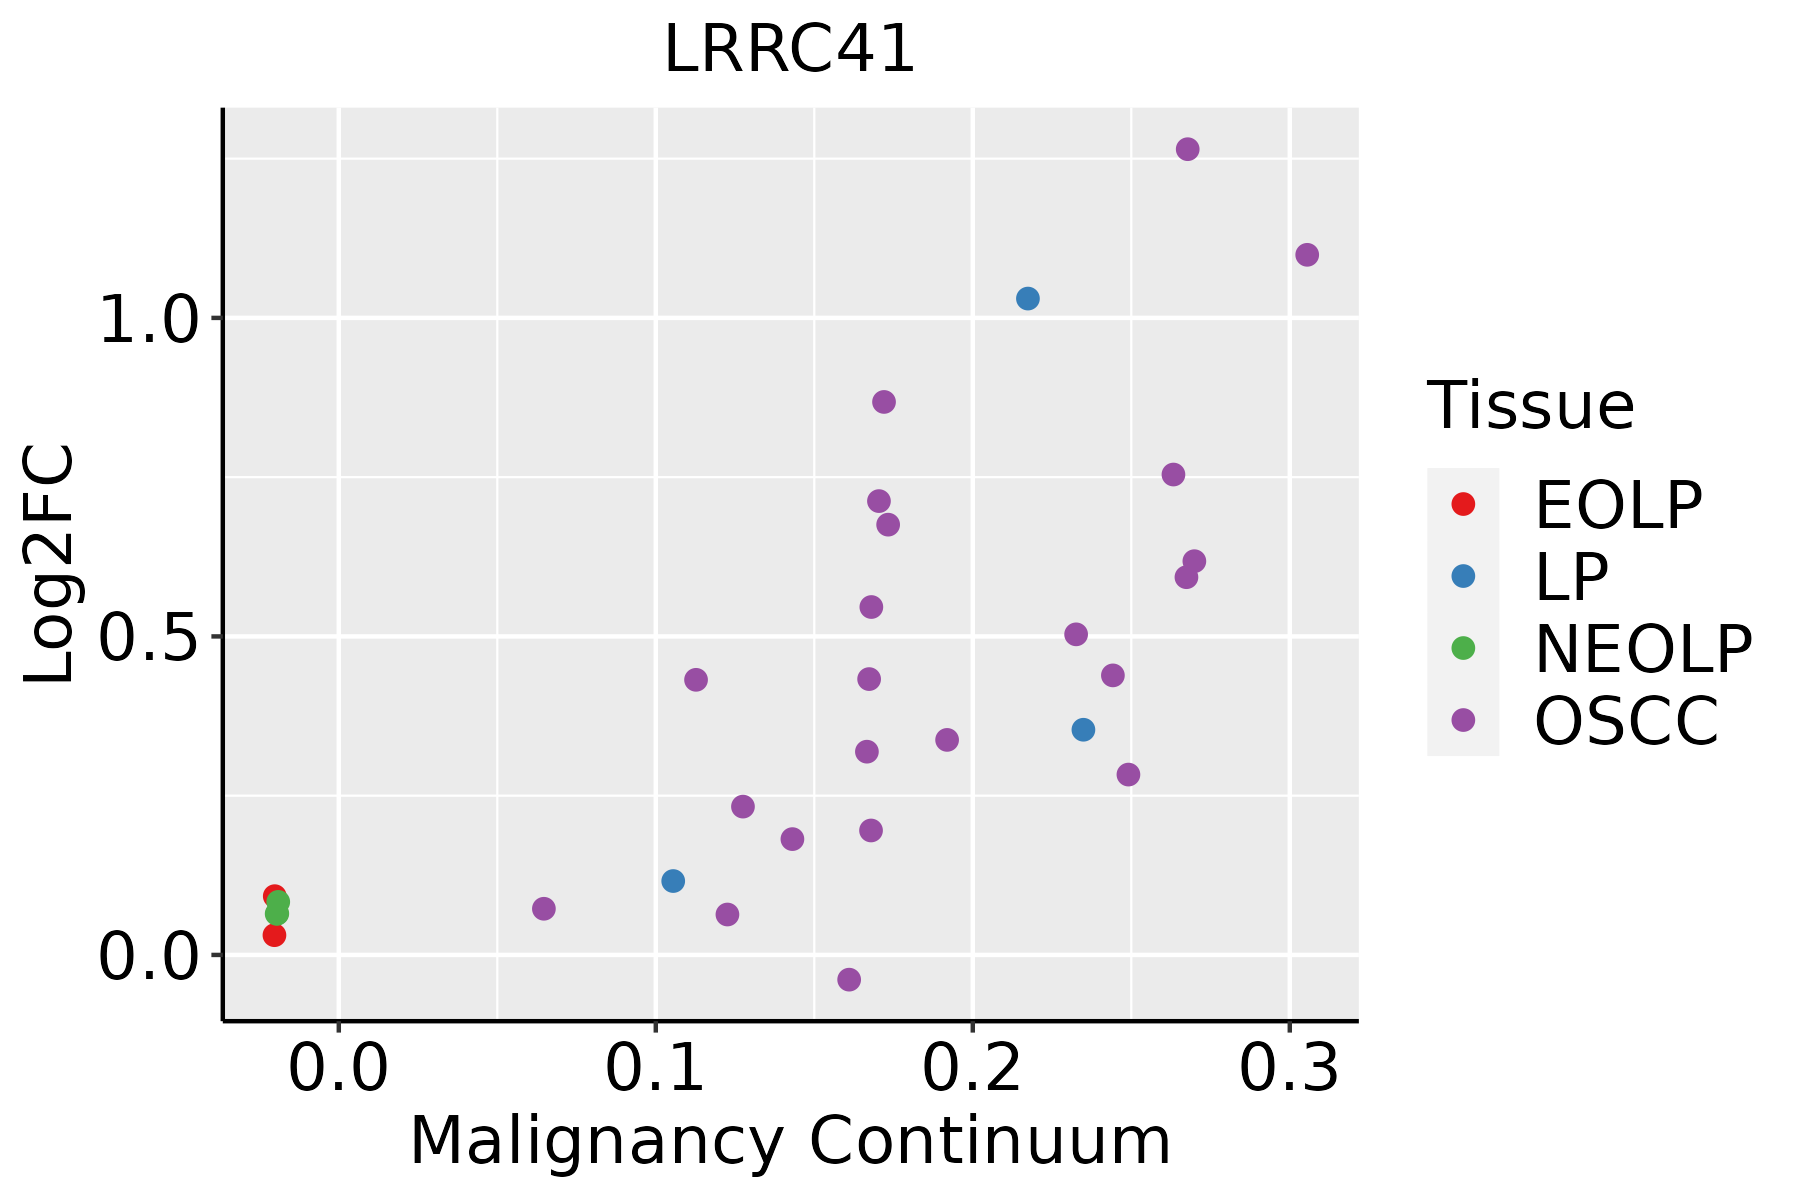 | EOLP: Erosive Oral lichen planus |
| LP: leukoplakia | ||
| NEOLP: Non-erosive oral lichen planus | ||
| OSCC: Oral squamous cell carcinoma | ||
| Skin | 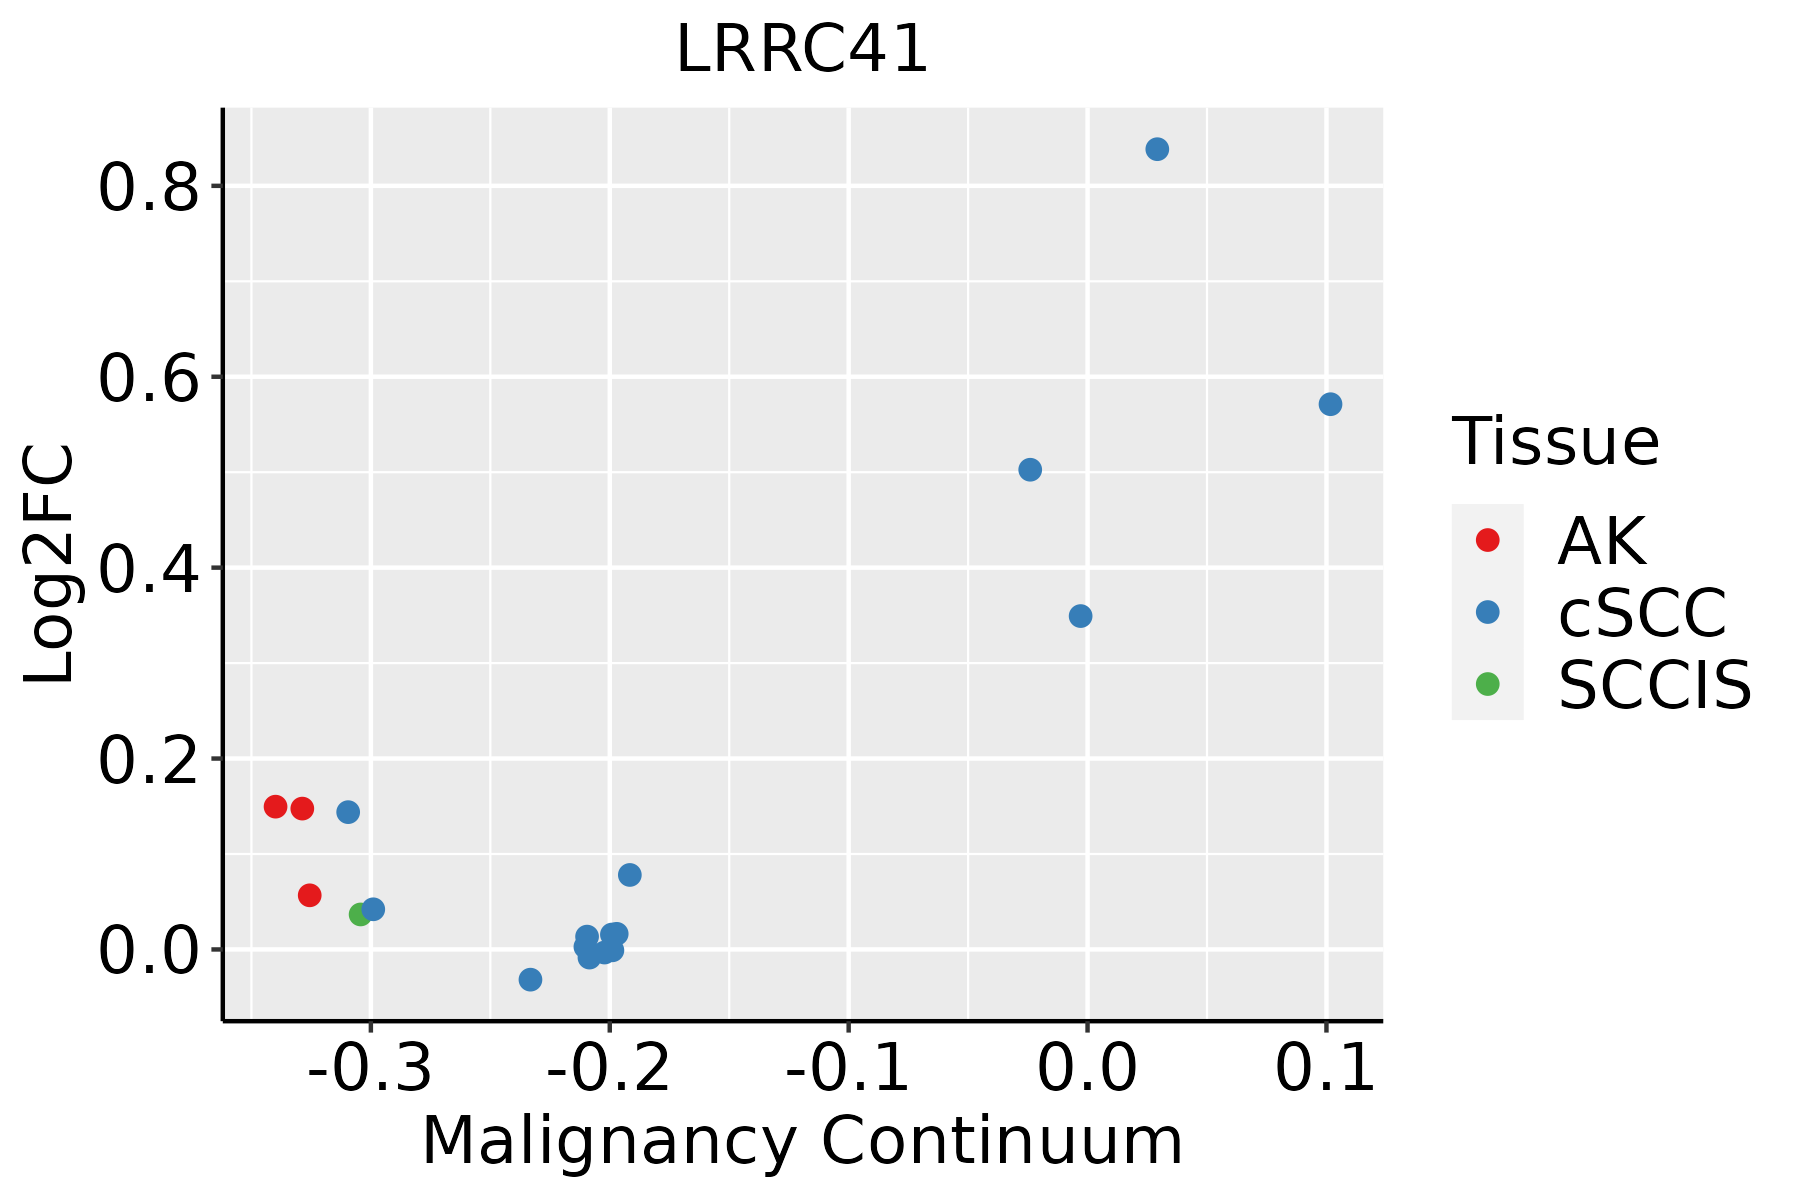 | AK: Actinic keratosis |
| cSCC: Cutaneous squamous cell carcinoma | ||
| SCCIS:squamous cell carcinoma in situ | ||
| Thyroid | 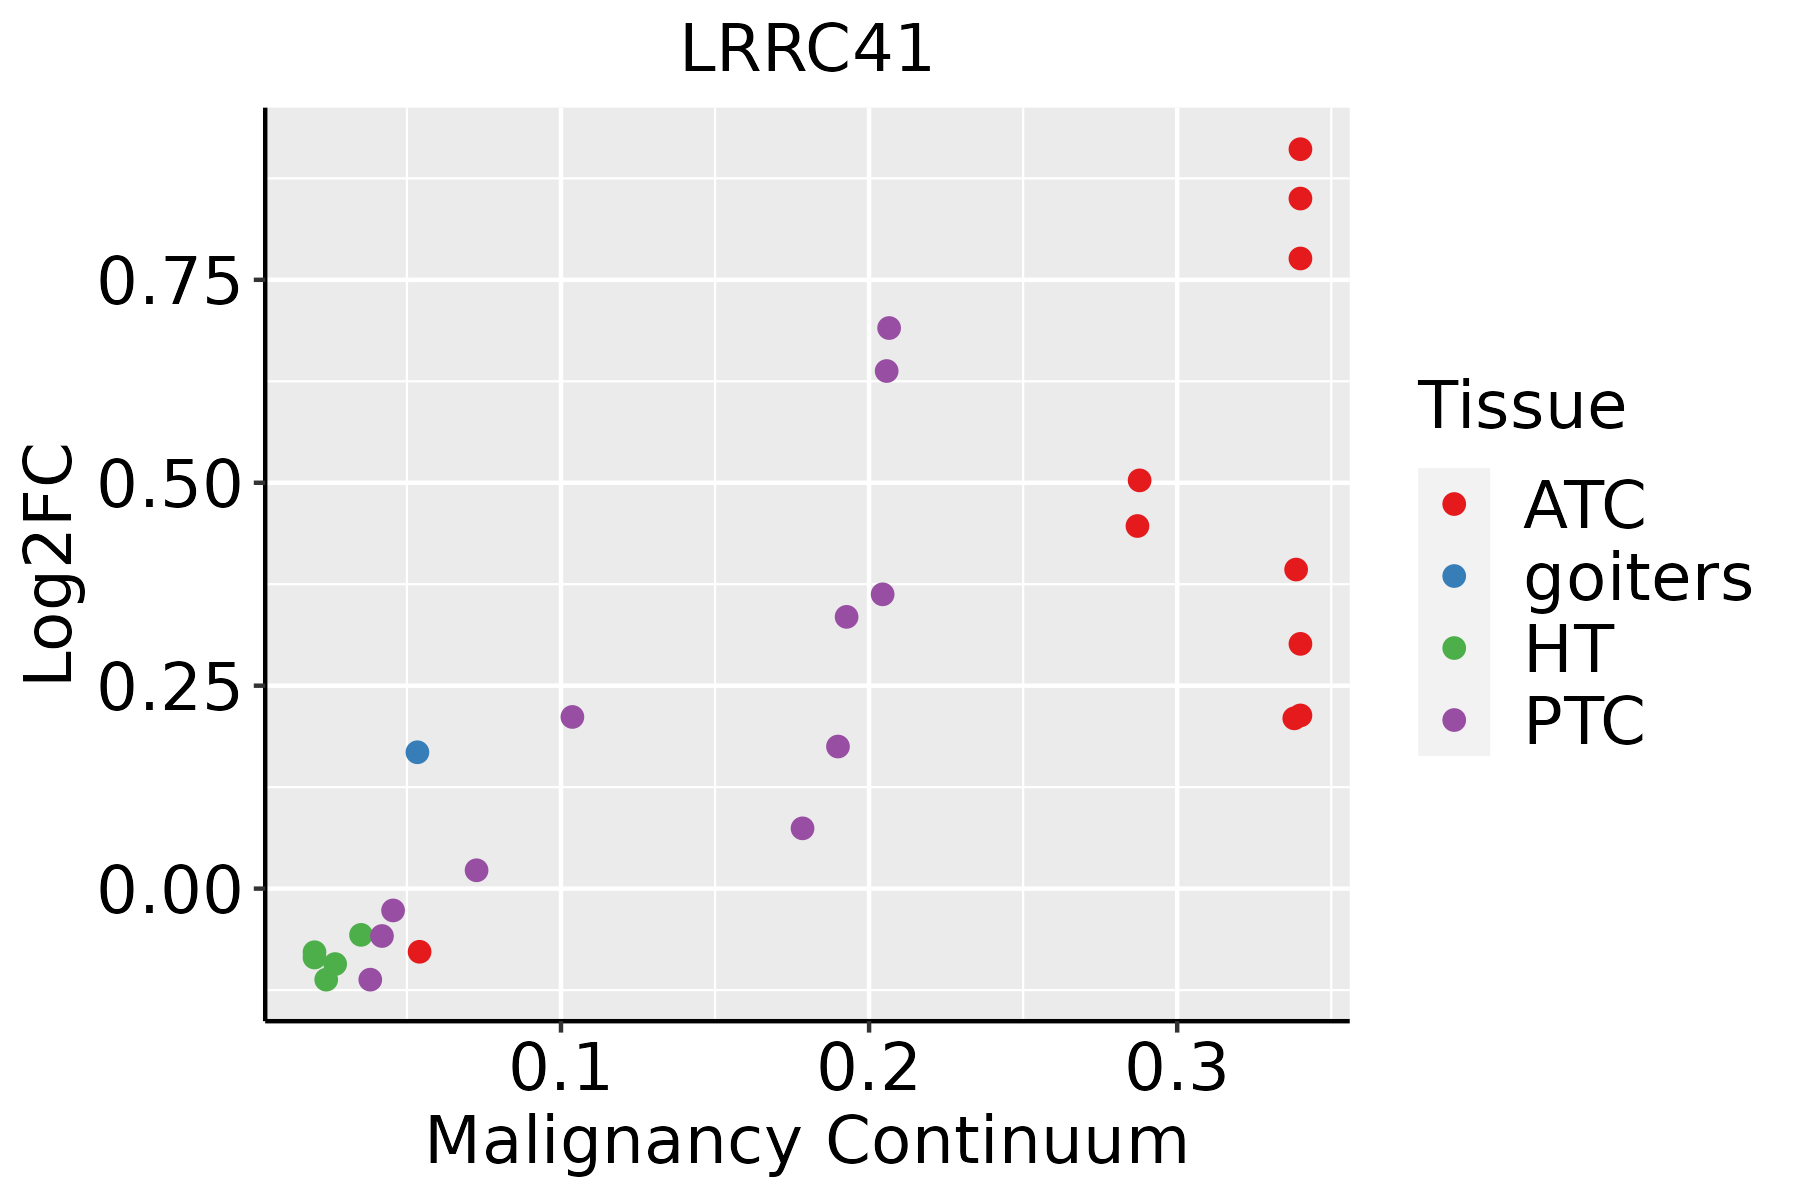 | ATC: Anaplastic thyroid cancer |
| HT: Hashimoto's thyroiditis | ||
| PTC: Papillary thyroid cancer |
| ∗log2FC in expression of this searched gene in stem-like cells from each diseased tissue sample relative to stem-like cells in normal samples in each tissue plotted against the malignancy continuum. Samples are colored based on if they are from different disease stage. |
Top |
Malignant transformation related pathway analysis |
| Find out the enriched GO biological processes and KEGG pathways involved in transition from healthy to precancer to cancer |
| Tissue | Disease Stage | Enriched GO biological Processes |
| Colorectum | AD |  |
| Colorectum | SER |  |
| Colorectum | MSS |  |
| Colorectum | MSI-H |  |
| Colorectum | FAP |  |
| ∗Top 15 enriched GO BP terms are showed in the bar plot of each disease state in each tissue. Each row represents a significant GO biological process which is colored according to the -log10(p.adjust). |
| Page: 1 2 3 4 5 6 7 8 9 |
| GO ID | Tissue | Disease Stage | Description | Gene Ratio | Bg Ratio | pvalue | p.adjust | Count |
| Page: 1 |
| Pathway ID | Tissue | Disease Stage | Description | Gene Ratio | Bg Ratio | pvalue | p.adjust | qvalue | Count |
| Page: 1 |
Top |
Cell-cell communication analysis |
| Identification of potential cell-cell interactions between two cell types and their ligand-receptor pairs for different disease states |
| Ligand | Receptor | LRpair | Pathway | Tissue | Disease Stage |
| Page: 1 |
Top |
Single-cell gene regulatory network inference analysis |
| Find out the significant the regulons (TFs) and the target genes of each regulon across cell types for different disease states |
| TF | Cell Type | Tissue | Disease Stage | Target Gene | RSS | Regulon Activity |
| ∗The dot plots of a searched regulon are shown for all cell subpopulations in each disease state of each tissue based on the regulon specific score inferred using pySCENIC and by calculating the average expression. |
| Page: 1 |
Top |
Somatic mutation of malignant transformation related genes |
| Annotation of somatic variants for genes involved in malignant transformation |
| Hugo Symbol | Variant Class | Variant Classification | dbSNP RS | HGVSc | HGVSp | HGVSp Short | SWISSPROT | BIOTYPE | SIFT | PolyPhen | Tumor Sample Barcode | Tissue | Histology | Sex | Age | Stage | Therapy Types | Drugs | Outcome |
| LRRC41 | SNV | Missense_Mutation | novel | c.1487N>T | p.Ser496Phe | p.S496F | Q15345 | protein_coding | deleterious(0) | probably_damaging(0.918) | TCGA-A2-A3XV-01 | Breast | breast invasive carcinoma | Female | <65 | I/II | Chemotherapy | carboplatin | CR |
| LRRC41 | SNV | Missense_Mutation | c.2288N>A | p.Ala763Asp | p.A763D | Q15345 | protein_coding | tolerated(0.51) | benign(0.106) | TCGA-AN-A04C-01 | Breast | breast invasive carcinoma | Female | <65 | I/II | Unknown | Unknown | SD | |
| LRRC41 | SNV | Missense_Mutation | c.265N>A | p.Glu89Lys | p.E89K | Q15345 | protein_coding | deleterious(0) | probably_damaging(0.986) | TCGA-BH-A0DZ-01 | Breast | breast invasive carcinoma | Female | <65 | I/II | Chemotherapy | docetaxel | SD | |
| LRRC41 | SNV | Missense_Mutation | c.1145N>T | p.Ala382Val | p.A382V | Q15345 | protein_coding | tolerated(0.58) | benign(0.001) | TCGA-BH-A0HF-01 | Breast | breast invasive carcinoma | Female | >=65 | I/II | Hormone Therapy | arimidex | SD | |
| LRRC41 | SNV | Missense_Mutation | c.507C>G | p.Ile169Met | p.I169M | Q15345 | protein_coding | deleterious(0.01) | possibly_damaging(0.628) | TCGA-C8-A12K-01 | Breast | breast invasive carcinoma | Female | >=65 | I/II | Unknown | Unknown | SD | |
| LRRC41 | SNV | Missense_Mutation | c.1191N>C | p.Lys397Asn | p.K397N | Q15345 | protein_coding | tolerated(0.07) | benign(0.051) | TCGA-D8-A1JA-01 | Breast | breast invasive carcinoma | Female | <65 | III/IV | Chemotherapy | adriamycin | PD | |
| LRRC41 | SNV | Missense_Mutation | c.1285G>A | p.Glu429Lys | p.E429K | Q15345 | protein_coding | tolerated(0.51) | benign(0.098) | TCGA-D8-A1XM-01 | Breast | breast invasive carcinoma | Female | <65 | I/II | Unknown | Unknown | SD | |
| LRRC41 | insertion | Frame_Shift_Ins | rs772178289 | c.922_923insTCTTT | p.Ser308IlefsTer17 | p.S308Ifs*17 | Q15345 | protein_coding | TCGA-A8-A06T-01 | Breast | breast invasive carcinoma | Female | >=65 | III/IV | Hormone Therapy | anastrozole | SD | ||
| LRRC41 | insertion | In_Frame_Ins | rs772178289 | c.922_923insATCTTT | p.Ser308delinsAsnLeuCys | p.S308delinsNLC | Q15345 | protein_coding | TCGA-A8-A07F-01 | Breast | breast invasive carcinoma | Female | >=65 | I/II | Hormone Therapy | tamoxiphen | SD | ||
| LRRC41 | insertion | In_Frame_Ins | rs772178289 | c.922_923insATCTTT | p.Ser308delinsAsnLeuCys | p.S308delinsNLC | Q15345 | protein_coding | TCGA-A8-A07Z-01 | Breast | breast invasive carcinoma | Female | >=65 | I/II | Unspecific | Exemestane | SD |
| Page: 1 2 3 4 5 6 7 8 9 |
Top |
Related drugs of malignant transformation related genes |
| Identification of chemicals and drugs interact with genes involved in malignant transfromation |
| (DGIdb 4.0) |
| Entrez ID | Symbol | Category | Interaction Types | Drug Claim Name | Drug Name | PMIDs |
| Page: 1 |

Copyright 2023-Present -The University of Texas Health Science Center at Houston |