
|
|||||
|
 | |
| |
| |
| |
| |
| |
|
Gene: LRRC40 |
Gene summary for LRRC40 |
| Gene information | Species | Human | Gene symbol | LRRC40 | Gene ID | 55631 |
| Gene name | leucine rich repeat containing 40 | |
| Gene Alias | dJ677H15.1 | |
| Cytomap | 1p31.1 | |
| Gene Type | protein-coding | GO ID | GO:0006464 | UniProtAcc | A0A140VJN3 |
Top |
Malignant transformation analysis |
| Identification of the aberrant gene expression in precancerous and cancerous lesions by comparing the gene expression of stem-like cells in diseased tissues with normal stem cells |
| Entrez ID | Symbol | Replicates | Species | Organ | Tissue | Adj P-value | Log2FC | Malignancy |
| 55631 | LRRC40 | LZE4T | Human | Esophagus | ESCC | 1.62e-03 | 7.88e-02 | 0.0811 |
| 55631 | LRRC40 | LZE24T | Human | Esophagus | ESCC | 1.05e-05 | 1.22e-01 | 0.0596 |
| 55631 | LRRC40 | P2T-E | Human | Esophagus | ESCC | 1.72e-17 | 2.60e-01 | 0.1177 |
| 55631 | LRRC40 | P4T-E | Human | Esophagus | ESCC | 7.29e-17 | 1.85e-01 | 0.1323 |
| 55631 | LRRC40 | P5T-E | Human | Esophagus | ESCC | 3.52e-07 | 1.03e-01 | 0.1327 |
| 55631 | LRRC40 | P8T-E | Human | Esophagus | ESCC | 8.62e-11 | 1.50e-01 | 0.0889 |
| 55631 | LRRC40 | P9T-E | Human | Esophagus | ESCC | 4.37e-08 | 5.20e-02 | 0.1131 |
| 55631 | LRRC40 | P10T-E | Human | Esophagus | ESCC | 2.43e-05 | 1.56e-01 | 0.116 |
| 55631 | LRRC40 | P11T-E | Human | Esophagus | ESCC | 1.70e-02 | 9.94e-02 | 0.1426 |
| 55631 | LRRC40 | P12T-E | Human | Esophagus | ESCC | 1.72e-12 | 1.68e-01 | 0.1122 |
| 55631 | LRRC40 | P15T-E | Human | Esophagus | ESCC | 3.29e-14 | 1.79e-01 | 0.1149 |
| 55631 | LRRC40 | P16T-E | Human | Esophagus | ESCC | 5.56e-16 | 1.02e-01 | 0.1153 |
| 55631 | LRRC40 | P19T-E | Human | Esophagus | ESCC | 4.51e-06 | 3.13e-01 | 0.1662 |
| 55631 | LRRC40 | P20T-E | Human | Esophagus | ESCC | 1.53e-15 | 1.39e-01 | 0.1124 |
| 55631 | LRRC40 | P21T-E | Human | Esophagus | ESCC | 1.90e-14 | 2.59e-01 | 0.1617 |
| 55631 | LRRC40 | P22T-E | Human | Esophagus | ESCC | 1.83e-05 | 5.23e-02 | 0.1236 |
| 55631 | LRRC40 | P23T-E | Human | Esophagus | ESCC | 7.15e-10 | 1.72e-01 | 0.108 |
| 55631 | LRRC40 | P24T-E | Human | Esophagus | ESCC | 4.08e-03 | 9.64e-02 | 0.1287 |
| 55631 | LRRC40 | P26T-E | Human | Esophagus | ESCC | 3.15e-11 | 1.46e-01 | 0.1276 |
| 55631 | LRRC40 | P27T-E | Human | Esophagus | ESCC | 6.22e-14 | 1.72e-01 | 0.1055 |
| Page: 1 2 3 |
| Tissue | Expression Dynamics | Abbreviation |
| Esophagus | 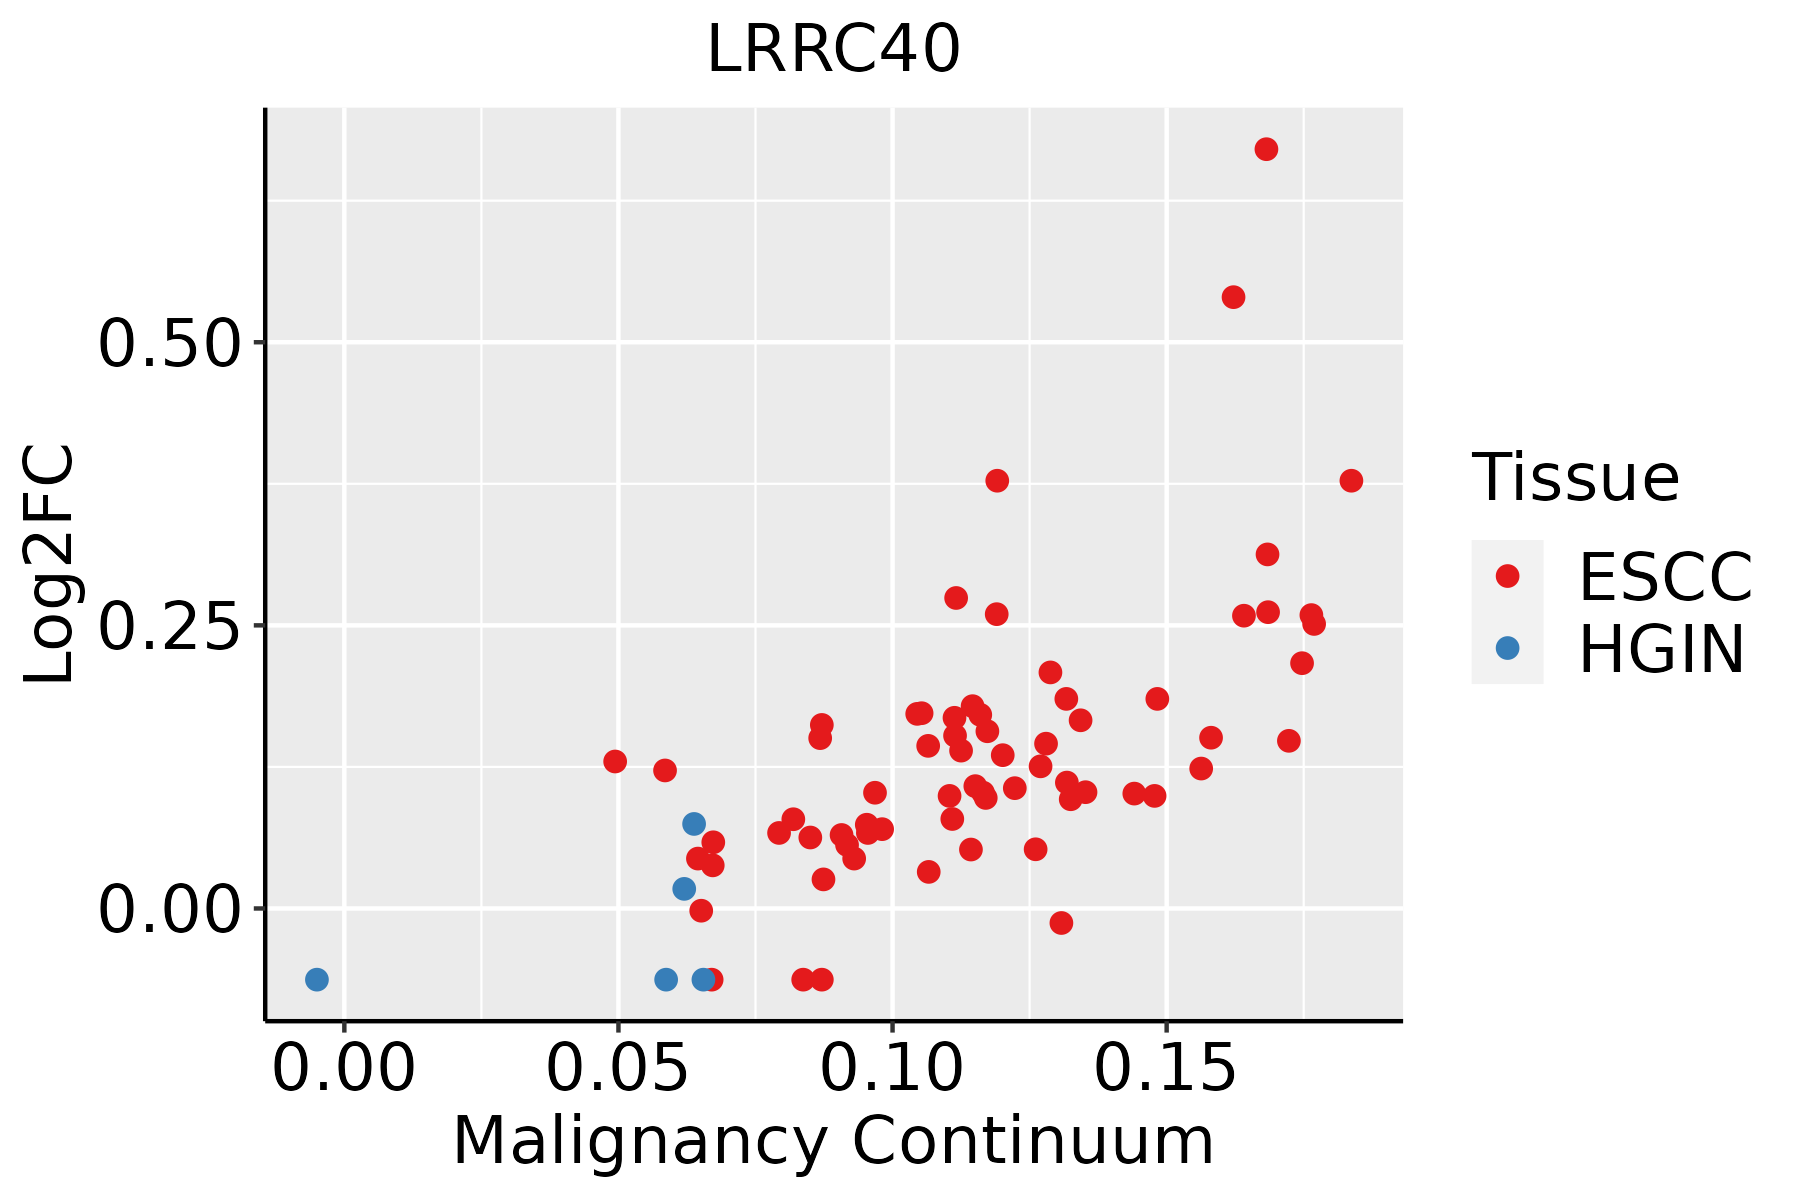 | ESCC: Esophageal squamous cell carcinoma |
| HGIN: High-grade intraepithelial neoplasias | ||
| LGIN: Low-grade intraepithelial neoplasias |
| ∗log2FC in expression of this searched gene in stem-like cells from each diseased tissue sample relative to stem-like cells in normal samples in each tissue plotted against the malignancy continuum. Samples are colored based on if they are from different disease stage. |
Top |
Malignant transformation related pathway analysis |
| Find out the enriched GO biological processes and KEGG pathways involved in transition from healthy to precancer to cancer |
| Tissue | Disease Stage | Enriched GO biological Processes |
| Colorectum | AD |  |
| Colorectum | SER |  |
| Colorectum | MSS |  |
| Colorectum | MSI-H |  |
| Colorectum | FAP |  |
| ∗Top 15 enriched GO BP terms are showed in the bar plot of each disease state in each tissue. Each row represents a significant GO biological process which is colored according to the -log10(p.adjust). |
| Page: 1 2 3 4 5 6 7 8 9 |
| GO ID | Tissue | Disease Stage | Description | Gene Ratio | Bg Ratio | pvalue | p.adjust | Count |
| GO:001631110 | Esophagus | ESCC | dephosphorylation | 251/8552 | 417/18723 | 1.26e-09 | 2.99e-08 | 251 |
| GO:000647018 | Esophagus | ESCC | protein dephosphorylation | 177/8552 | 281/18723 | 3.13e-09 | 6.72e-08 | 177 |
| Page: 1 |
| Pathway ID | Tissue | Disease Stage | Description | Gene Ratio | Bg Ratio | pvalue | p.adjust | qvalue | Count |
| Page: 1 |
Top |
Cell-cell communication analysis |
| Identification of potential cell-cell interactions between two cell types and their ligand-receptor pairs for different disease states |
| Ligand | Receptor | LRpair | Pathway | Tissue | Disease Stage |
| Page: 1 |
Top |
Single-cell gene regulatory network inference analysis |
| Find out the significant the regulons (TFs) and the target genes of each regulon across cell types for different disease states |
| TF | Cell Type | Tissue | Disease Stage | Target Gene | RSS | Regulon Activity |
| ∗The dot plots of a searched regulon are shown for all cell subpopulations in each disease state of each tissue based on the regulon specific score inferred using pySCENIC and by calculating the average expression. |
| Page: 1 |
Top |
Somatic mutation of malignant transformation related genes |
| Annotation of somatic variants for genes involved in malignant transformation |
| Hugo Symbol | Variant Class | Variant Classification | dbSNP RS | HGVSc | HGVSp | HGVSp Short | SWISSPROT | BIOTYPE | SIFT | PolyPhen | Tumor Sample Barcode | Tissue | Histology | Sex | Age | Stage | Therapy Types | Drugs | Outcome |
| LRRC40 | SNV | Missense_Mutation | novel | c.617N>A | p.Ser206Asn | p.S206N | Q9H9A6 | protein_coding | tolerated(0.44) | benign(0.022) | TCGA-A2-A0CU-01 | Breast | breast invasive carcinoma | Female | >=65 | I/II | Hormone Therapy | tamoxiphen | SD |
| LRRC40 | SNV | Missense_Mutation | rs374870819 | c.1306C>G | p.Gln436Glu | p.Q436E | Q9H9A6 | protein_coding | tolerated(0.22) | benign(0) | TCGA-AO-A1KR-01 | Breast | breast invasive carcinoma | Female | <65 | I/II | Chemotherapy | cyclophosphamide | SD |
| LRRC40 | SNV | Missense_Mutation | c.913N>T | p.Pro305Ser | p.P305S | Q9H9A6 | protein_coding | tolerated(0.06) | probably_damaging(1) | TCGA-D8-A142-01 | Breast | breast invasive carcinoma | Female | >=65 | I/II | Chemotherapy | cyclophosphamid | SD | |
| LRRC40 | SNV | Missense_Mutation | novel | c.1585N>A | p.Gln529Lys | p.Q529K | Q9H9A6 | protein_coding | tolerated(0.29) | benign(0.222) | TCGA-E2-A150-01 | Breast | breast invasive carcinoma | Female | <65 | I/II | Chemotherapy | doxorubicin | SD |
| LRRC40 | insertion | In_Frame_Ins | novel | c.1041_1042insCTTAAC | p.Arg347_Thr348insLeuAsn | p.R347_T348insLN | Q9H9A6 | protein_coding | TCGA-AR-A0U0-01 | Breast | breast invasive carcinoma | Female | >=65 | I/II | Unknown | Unknown | SD | ||
| LRRC40 | SNV | Missense_Mutation | novel | c.1141A>G | p.Thr381Ala | p.T381A | Q9H9A6 | protein_coding | tolerated(0.5) | benign(0.003) | TCGA-C5-A1M7-01 | Cervix | cervical & endocervical cancer | Female | <65 | I/II | Unknown | Unknown | SD |
| LRRC40 | SNV | Missense_Mutation | c.913N>T | p.Pro305Ser | p.P305S | Q9H9A6 | protein_coding | tolerated(0.06) | probably_damaging(1) | TCGA-DS-A0VM-01 | Cervix | cervical & endocervical cancer | Female | <65 | I/II | Chemotherapy | cisplatin | PD | |
| LRRC40 | SNV | Missense_Mutation | c.365C>T | p.Ser122Phe | p.S122F | Q9H9A6 | protein_coding | deleterious(0.01) | benign(0.402) | TCGA-IR-A3LK-01 | Cervix | cervical & endocervical cancer | Female | >=65 | I/II | Chemotherapy | cisplatin | PD | |
| LRRC40 | SNV | Missense_Mutation | rs746389314 | c.814G>A | p.Val272Ile | p.V272I | Q9H9A6 | protein_coding | tolerated(0.27) | benign(0.007) | TCGA-A6-2686-01 | Colorectum | colon adenocarcinoma | Female | >=65 | I/II | Unknown | Unknown | SD |
| LRRC40 | SNV | Missense_Mutation | c.874C>A | p.Leu292Ile | p.L292I | Q9H9A6 | protein_coding | tolerated(0.3) | benign(0.089) | TCGA-AA-3510-01 | Colorectum | colon adenocarcinoma | Male | >=65 | I/II | Unknown | Unknown | SD |
| Page: 1 2 3 4 5 6 7 8 |
Top |
Related drugs of malignant transformation related genes |
| Identification of chemicals and drugs interact with genes involved in malignant transfromation |
| (DGIdb 4.0) |
| Entrez ID | Symbol | Category | Interaction Types | Drug Claim Name | Drug Name | PMIDs |
| Page: 1 |

Copyright 2023-Present -The University of Texas Health Science Center at Houston |