
|
|||||
|
 | |
| |
| |
| |
| |
| |
|
Gene: LRRC4 |
Gene summary for LRRC4 |
| Gene information | Species | Human | Gene symbol | LRRC4 | Gene ID | 64101 |
| Gene name | leucine rich repeat containing 4 | |
| Gene Alias | NAG14 | |
| Cytomap | 7q32.1 | |
| Gene Type | protein-coding | GO ID | GO:0001941 | UniProtAcc | Q9HBW1 |
Top |
Malignant transformation analysis |
| Identification of the aberrant gene expression in precancerous and cancerous lesions by comparing the gene expression of stem-like cells in diseased tissues with normal stem cells |
| Entrez ID | Symbol | Replicates | Species | Organ | Tissue | Adj P-value | Log2FC | Malignancy |
| 64101 | LRRC4 | LZE7T | Human | Esophagus | ESCC | 1.89e-02 | 2.30e-01 | 0.0667 |
| 64101 | LRRC4 | LZE24T | Human | Esophagus | ESCC | 1.52e-10 | 4.08e-01 | 0.0596 |
| 64101 | LRRC4 | LZE21T | Human | Esophagus | ESCC | 6.55e-03 | 3.92e-01 | 0.0655 |
| 64101 | LRRC4 | P4T-E | Human | Esophagus | ESCC | 6.51e-06 | 2.24e-01 | 0.1323 |
| 64101 | LRRC4 | P9T-E | Human | Esophagus | ESCC | 8.58e-06 | 2.60e-01 | 0.1131 |
| 64101 | LRRC4 | P12T-E | Human | Esophagus | ESCC | 8.79e-08 | 2.85e-01 | 0.1122 |
| 64101 | LRRC4 | P15T-E | Human | Esophagus | ESCC | 3.03e-23 | 6.01e-01 | 0.1149 |
| 64101 | LRRC4 | P23T-E | Human | Esophagus | ESCC | 5.87e-18 | 1.78e-01 | 0.108 |
| 64101 | LRRC4 | P26T-E | Human | Esophagus | ESCC | 1.36e-11 | 4.01e-01 | 0.1276 |
| 64101 | LRRC4 | P27T-E | Human | Esophagus | ESCC | 2.27e-14 | 4.09e-01 | 0.1055 |
| 64101 | LRRC4 | P28T-E | Human | Esophagus | ESCC | 1.14e-32 | 9.08e-01 | 0.1149 |
| 64101 | LRRC4 | P30T-E | Human | Esophagus | ESCC | 3.16e-28 | 1.01e+00 | 0.137 |
| 64101 | LRRC4 | P39T-E | Human | Esophagus | ESCC | 3.05e-12 | 3.26e-01 | 0.0894 |
| 64101 | LRRC4 | P48T-E | Human | Esophagus | ESCC | 1.45e-06 | 2.64e-01 | 0.0959 |
| 64101 | LRRC4 | P52T-E | Human | Esophagus | ESCC | 2.51e-02 | 1.26e-01 | 0.1555 |
| 64101 | LRRC4 | P54T-E | Human | Esophagus | ESCC | 1.70e-10 | 4.30e-01 | 0.0975 |
| 64101 | LRRC4 | P74T-E | Human | Esophagus | ESCC | 4.05e-04 | 1.73e-01 | 0.1479 |
| 64101 | LRRC4 | P75T-E | Human | Esophagus | ESCC | 4.20e-02 | 1.37e-01 | 0.1125 |
| 64101 | LRRC4 | P84T-E | Human | Esophagus | ESCC | 1.42e-12 | 7.32e-01 | 0.0933 |
| 64101 | LRRC4 | P127T-E | Human | Esophagus | ESCC | 4.75e-10 | 2.64e-01 | 0.0826 |
| Page: 1 2 |
| Tissue | Expression Dynamics | Abbreviation |
| Esophagus | 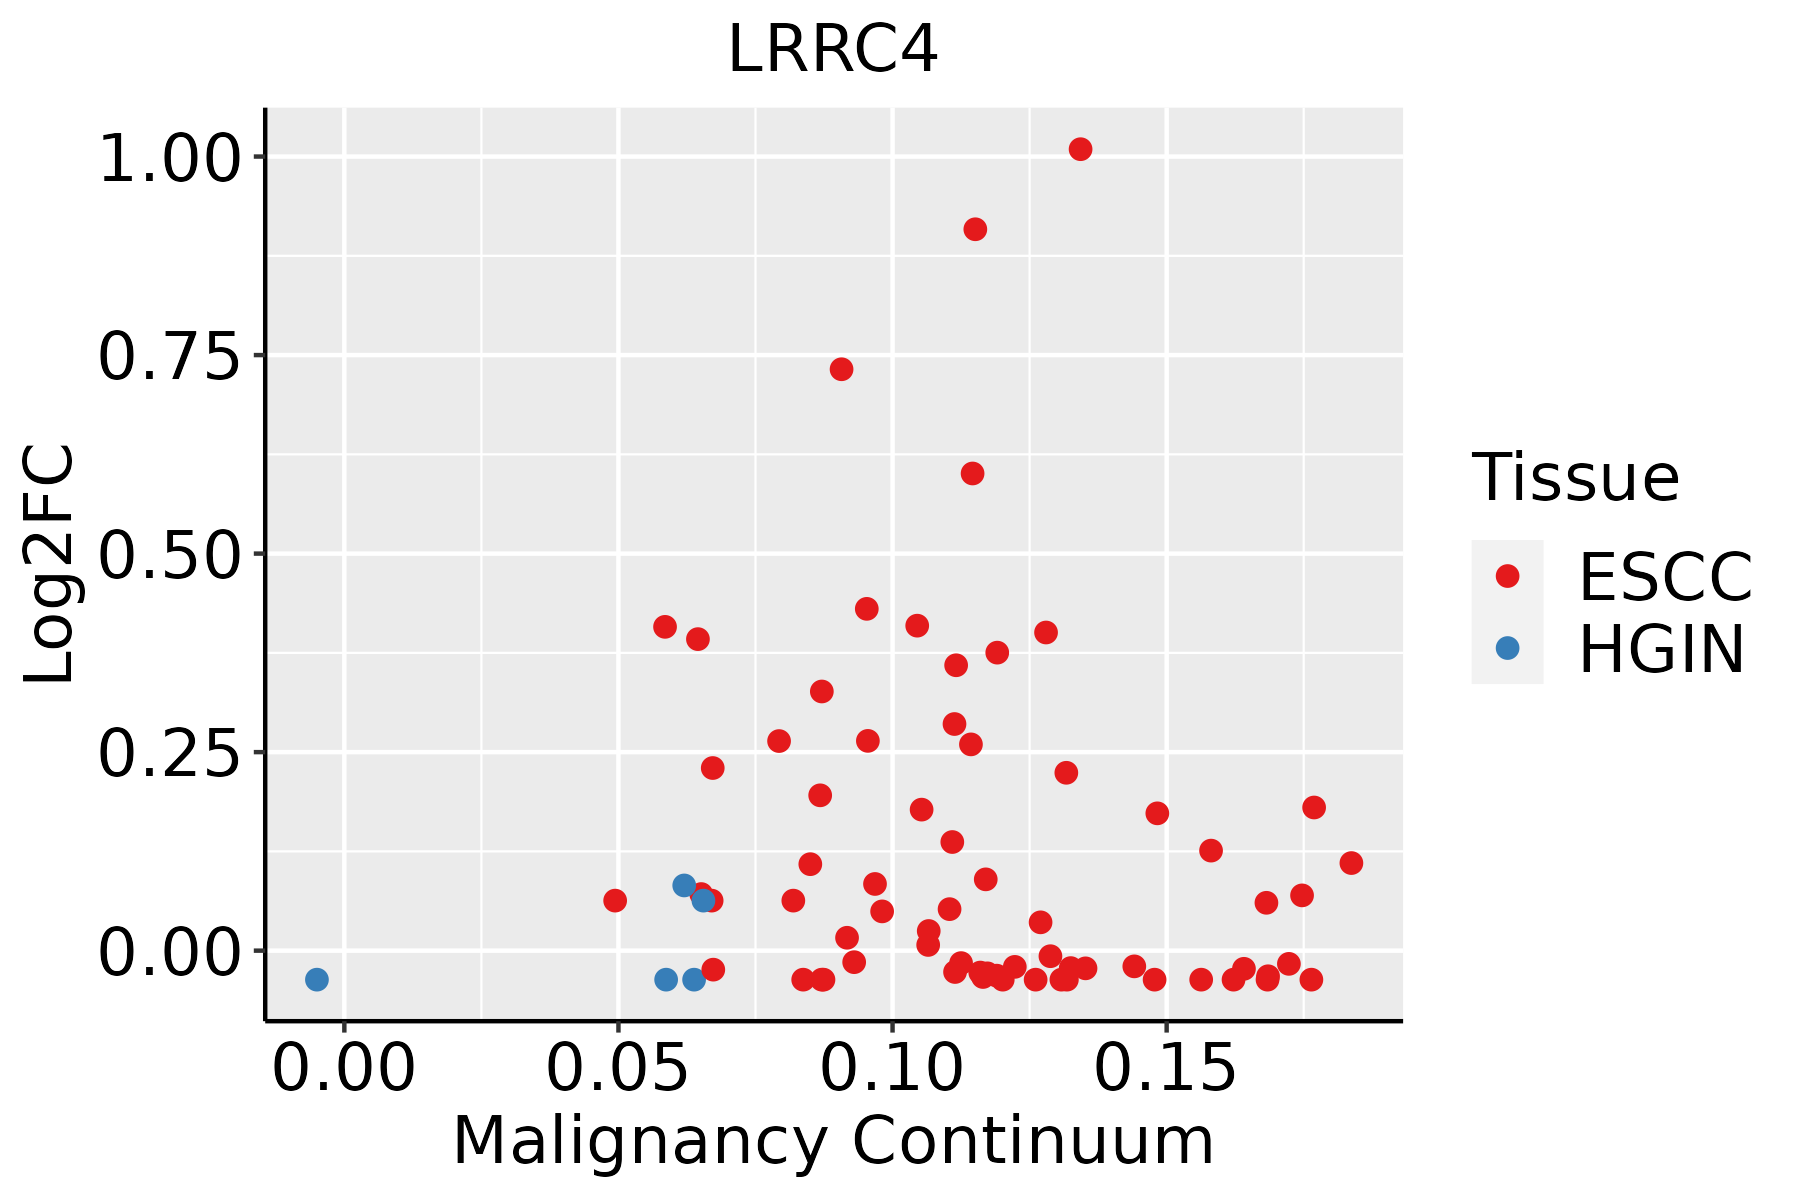 | ESCC: Esophageal squamous cell carcinoma |
| HGIN: High-grade intraepithelial neoplasias | ||
| LGIN: Low-grade intraepithelial neoplasias |
| ∗log2FC in expression of this searched gene in stem-like cells from each diseased tissue sample relative to stem-like cells in normal samples in each tissue plotted against the malignancy continuum. Samples are colored based on if they are from different disease stage. |
Top |
Malignant transformation related pathway analysis |
| Find out the enriched GO biological processes and KEGG pathways involved in transition from healthy to precancer to cancer |
| Tissue | Disease Stage | Enriched GO biological Processes |
| Colorectum | AD |  |
| Colorectum | SER |  |
| Colorectum | MSS |  |
| Colorectum | MSI-H |  |
| Colorectum | FAP |  |
| ∗Top 15 enriched GO BP terms are showed in the bar plot of each disease state in each tissue. Each row represents a significant GO biological process which is colored according to the -log10(p.adjust). |
| Page: 1 2 3 4 5 6 7 8 9 |
| GO ID | Tissue | Disease Stage | Description | Gene Ratio | Bg Ratio | pvalue | p.adjust | Count |
| GO:003466012 | Esophagus | ESCC | ncRNA metabolic process | 346/8552 | 485/18723 | 4.35e-31 | 2.51e-28 | 346 |
| GO:00063992 | Esophagus | ESCC | tRNA metabolic process | 122/8552 | 179/18723 | 9.03e-10 | 2.19e-08 | 122 |
| GO:001631110 | Esophagus | ESCC | dephosphorylation | 251/8552 | 417/18723 | 1.26e-09 | 2.99e-08 | 251 |
| GO:000647018 | Esophagus | ESCC | protein dephosphorylation | 177/8552 | 281/18723 | 3.13e-09 | 6.72e-08 | 177 |
| GO:003432918 | Esophagus | ESCC | cell junction assembly | 227/8552 | 420/18723 | 3.06e-04 | 1.83e-03 | 227 |
| GO:00346601 | Liver | HCC | ncRNA metabolic process | 332/7958 | 485/18723 | 1.48e-31 | 7.80e-29 | 332 |
| GO:00065202 | Liver | HCC | cellular amino acid metabolic process | 167/7958 | 284/18723 | 1.91e-08 | 4.56e-07 | 167 |
| GO:0006399 | Liver | HCC | tRNA metabolic process | 108/7958 | 179/18723 | 1.07e-06 | 1.59e-05 | 108 |
| GO:00346605 | Oral cavity | OSCC | ncRNA metabolic process | 296/7305 | 485/18723 | 2.94e-23 | 6.65e-21 | 296 |
| GO:00063991 | Oral cavity | OSCC | tRNA metabolic process | 101/7305 | 179/18723 | 1.65e-06 | 2.15e-05 | 101 |
| GO:003466011 | Oral cavity | LP | ncRNA metabolic process | 205/4623 | 485/18723 | 6.46e-18 | 1.09e-15 | 205 |
| GO:003466013 | Skin | cSCC | ncRNA metabolic process | 234/4864 | 485/18723 | 1.37e-26 | 4.77e-24 | 234 |
| GO:00063993 | Skin | cSCC | tRNA metabolic process | 64/4864 | 179/18723 | 2.34e-03 | 1.36e-02 | 64 |
| GO:00346608 | Thyroid | PTC | ncRNA metabolic process | 239/5968 | 485/18723 | 5.54e-16 | 4.26e-14 | 239 |
| GO:003466021 | Thyroid | ATC | ncRNA metabolic process | 240/6293 | 485/18723 | 2.03e-13 | 9.91e-12 | 240 |
| Page: 1 |
| Pathway ID | Tissue | Disease Stage | Description | Gene Ratio | Bg Ratio | pvalue | p.adjust | qvalue | Count |
| hsa0436016 | Esophagus | ESCC | Axon guidance | 108/4205 | 182/8465 | 5.13e-03 | 1.30e-02 | 6.67e-03 | 108 |
| hsa0436017 | Esophagus | ESCC | Axon guidance | 108/4205 | 182/8465 | 5.13e-03 | 1.30e-02 | 6.67e-03 | 108 |
| Page: 1 |
Top |
Cell-cell communication analysis |
| Identification of potential cell-cell interactions between two cell types and their ligand-receptor pairs for different disease states |
| Ligand | Receptor | LRpair | Pathway | Tissue | Disease Stage |
| LRRC4 | NTNG2 | LRRC4_NTNG2 | NGL | Esophagus | ESCC |
| Page: 1 |
Top |
Single-cell gene regulatory network inference analysis |
| Find out the significant the regulons (TFs) and the target genes of each regulon across cell types for different disease states |
| TF | Cell Type | Tissue | Disease Stage | Target Gene | RSS | Regulon Activity |
| ∗The dot plots of a searched regulon are shown for all cell subpopulations in each disease state of each tissue based on the regulon specific score inferred using pySCENIC and by calculating the average expression. |
| Page: 1 |
Top |
Somatic mutation of malignant transformation related genes |
| Annotation of somatic variants for genes involved in malignant transformation |
| Hugo Symbol | Variant Class | Variant Classification | dbSNP RS | HGVSc | HGVSp | HGVSp Short | SWISSPROT | BIOTYPE | SIFT | PolyPhen | Tumor Sample Barcode | Tissue | Histology | Sex | Age | Stage | Therapy Types | Drugs | Outcome |
| LRRC4 | SNV | Missense_Mutation | novel | c.1270N>A | p.Cys424Ser | p.C424S | Q9HBW1 | protein_coding | deleterious(0) | probably_damaging(0.998) | TCGA-AO-A0J5-01 | Breast | breast invasive carcinoma | Female | <65 | III/IV | Other, specify in notesBisphosphonate | zoledronic | PD |
| LRRC4 | SNV | Missense_Mutation | novel | c.104N>C | p.Ile35Thr | p.I35T | Q9HBW1 | protein_coding | tolerated_low_confidence(0.51) | benign(0) | TCGA-BH-A18G-01 | Breast | breast invasive carcinoma | Female | >=65 | I/II | Unknown | Unknown | SD |
| LRRC4 | SNV | Missense_Mutation | rs780904540 | c.1818N>G | p.Asn606Lys | p.N606K | Q9HBW1 | protein_coding | tolerated_low_confidence(0.21) | benign(0.01) | TCGA-LL-A5YP-01 | Breast | breast invasive carcinoma | Female | <65 | I/II | Chemotherapy | cytoxan | SD |
| LRRC4 | insertion | Nonsense_Mutation | novel | c.1271_1272insACCACCAAGATCATCA | p.Cys424Ter | p.C424* | Q9HBW1 | protein_coding | TCGA-AO-A0J5-01 | Breast | breast invasive carcinoma | Female | <65 | III/IV | Other, specify in notesBisphosphonate | zoledronic | PD | ||
| LRRC4 | SNV | Missense_Mutation | c.460N>T | p.Leu154Phe | p.L154F | Q9HBW1 | protein_coding | deleterious(0) | probably_damaging(0.999) | TCGA-DS-A1OC-01 | Cervix | cervical & endocervical cancer | Female | <65 | I/II | Chemotherapy | gemcitabine | SD | |
| LRRC4 | SNV | Missense_Mutation | c.224N>G | p.Ser75Trp | p.S75W | Q9HBW1 | protein_coding | tolerated(0.11) | probably_damaging(0.936) | TCGA-EK-A2RK-01 | Cervix | cervical & endocervical cancer | Female | >=65 | I/II | Unknown | Unknown | SD | |
| LRRC4 | SNV | Missense_Mutation | novel | c.1169N>T | p.Thr390Ile | p.T390I | Q9HBW1 | protein_coding | deleterious(0) | probably_damaging(0.994) | TCGA-A6-6137-01 | Colorectum | colon adenocarcinoma | Male | <65 | III/IV | Chemotherapy | fluorouracil | SD |
| LRRC4 | SNV | Missense_Mutation | c.1370N>C | p.Val457Ala | p.V457A | Q9HBW1 | protein_coding | deleterious(0.03) | probably_damaging(0.913) | TCGA-AA-3510-01 | Colorectum | colon adenocarcinoma | Male | >=65 | I/II | Unknown | Unknown | SD | |
| LRRC4 | SNV | Missense_Mutation | rs746701145 | c.287N>A | p.Arg96His | p.R96H | Q9HBW1 | protein_coding | deleterious(0.02) | possibly_damaging(0.867) | TCGA-AA-A02O-01 | Colorectum | colon adenocarcinoma | Male | >=65 | I/II | Unknown | Unknown | SD |
| LRRC4 | SNV | Missense_Mutation | c.1799N>T | p.Thr600Ile | p.T600I | Q9HBW1 | protein_coding | tolerated_low_confidence(0.17) | benign(0.135) | TCGA-CM-5868-01 | Colorectum | colon adenocarcinoma | Female | <65 | I/II | Chemotherapy | fluorouracil | SD |
| Page: 1 2 3 4 5 6 7 8 9 10 |
Top |
Related drugs of malignant transformation related genes |
| Identification of chemicals and drugs interact with genes involved in malignant transfromation |
| (DGIdb 4.0) |
| Entrez ID | Symbol | Category | Interaction Types | Drug Claim Name | Drug Name | PMIDs |
| Page: 1 |

Copyright 2023-Present -The University of Texas Health Science Center at Houston |