
|
|||||
|
 | |
| |
| |
| |
| |
| |
|
Gene: LRRC26 |
Gene summary for LRRC26 |
| Gene information | Species | Human | Gene symbol | LRRC26 | Gene ID | 389816 |
| Gene name | leucine rich repeat containing 26 | |
| Gene Alias | CAPC | |
| Cytomap | 9q34.3 | |
| Gene Type | protein-coding | GO ID | GO:0006810 | UniProtAcc | Q2I0M4 |
Top |
Malignant transformation analysis |
| Identification of the aberrant gene expression in precancerous and cancerous lesions by comparing the gene expression of stem-like cells in diseased tissues with normal stem cells |
| Entrez ID | Symbol | Replicates | Species | Organ | Tissue | Adj P-value | Log2FC | Malignancy |
| 389816 | LRRC26 | GSM4909281 | Human | Breast | IDC | 1.78e-08 | -2.04e-01 | 0.21 |
| 389816 | LRRC26 | GSM4909282 | Human | Breast | IDC | 3.80e-09 | -2.02e-01 | -0.0288 |
| 389816 | LRRC26 | GSM4909285 | Human | Breast | IDC | 1.66e-03 | -1.91e-01 | 0.21 |
| 389816 | LRRC26 | GSM4909286 | Human | Breast | IDC | 4.33e-02 | -1.79e-01 | 0.1081 |
| 389816 | LRRC26 | GSM4909287 | Human | Breast | IDC | 2.00e-04 | -1.98e-01 | 0.2057 |
| 389816 | LRRC26 | GSM4909290 | Human | Breast | IDC | 6.91e-08 | 3.76e-01 | 0.2096 |
| 389816 | LRRC26 | GSM4909291 | Human | Breast | IDC | 6.34e-28 | 8.17e-01 | 0.1753 |
| 389816 | LRRC26 | GSM4909293 | Human | Breast | IDC | 4.51e-41 | 8.01e-01 | 0.1581 |
| 389816 | LRRC26 | GSM4909294 | Human | Breast | IDC | 8.18e-04 | 3.86e-01 | 0.2022 |
| 389816 | LRRC26 | GSM4909296 | Human | Breast | IDC | 9.29e-07 | -1.94e-01 | 0.1524 |
| 389816 | LRRC26 | GSM4909297 | Human | Breast | IDC | 1.94e-04 | -1.40e-01 | 0.1517 |
| 389816 | LRRC26 | GSM4909298 | Human | Breast | IDC | 1.04e-05 | 3.11e-01 | 0.1551 |
| 389816 | LRRC26 | GSM4909303 | Human | Breast | IDC | 1.92e-02 | 4.11e-01 | 0.0438 |
| 389816 | LRRC26 | GSM4909307 | Human | Breast | IDC | 1.61e-02 | -1.67e-01 | 0.1569 |
| 389816 | LRRC26 | GSM4909311 | Human | Breast | IDC | 1.57e-06 | -1.34e-01 | 0.1534 |
| 389816 | LRRC26 | GSM4909319 | Human | Breast | IDC | 4.34e-12 | 5.92e-02 | 0.1563 |
| 389816 | LRRC26 | GSM4909321 | Human | Breast | IDC | 3.77e-11 | 4.60e-01 | 0.1559 |
| 389816 | LRRC26 | brca1 | Human | Breast | Precancer | 1.96e-03 | -1.68e-01 | -0.0338 |
| 389816 | LRRC26 | brca2 | Human | Breast | Precancer | 9.78e-04 | -1.76e-01 | -0.024 |
| 389816 | LRRC26 | brca10 | Human | Breast | Precancer | 2.00e-05 | -2.04e-01 | -0.0029 |
| Page: 1 2 |
| Tissue | Expression Dynamics | Abbreviation |
| Breast | 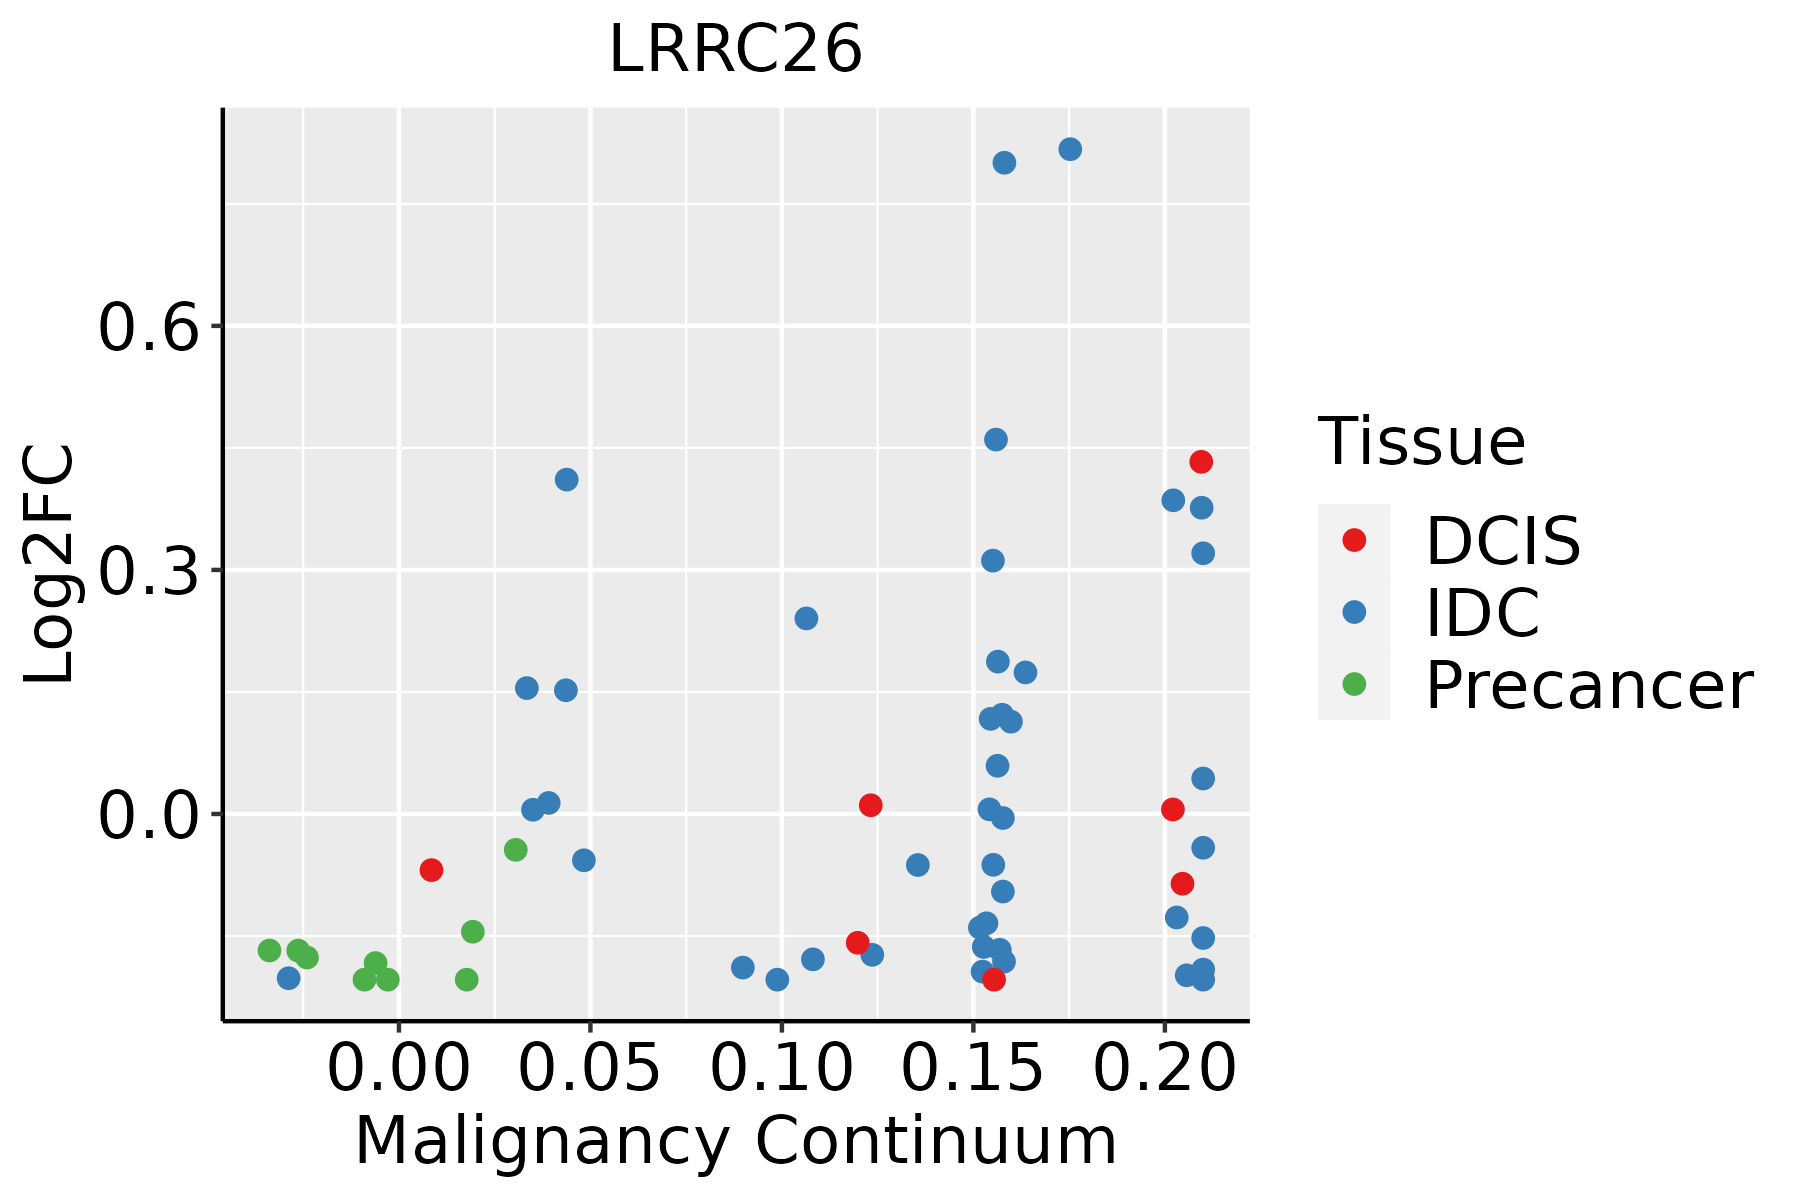 | IDC: Invasive ductal carcinoma |
| DCIS: Ductal carcinoma in situ | ||
| Precancer(BRCA1-mut): Precancerous lesion from BRCA1 mutation carriers | ||
| Esophagus |  | ESCC: Esophageal squamous cell carcinoma |
| HGIN: High-grade intraepithelial neoplasias | ||
| LGIN: Low-grade intraepithelial neoplasias | ||
| Prostate |  | BPH: Benign Prostatic Hyperplasia |
| ∗log2FC in expression of this searched gene in stem-like cells from each diseased tissue sample relative to stem-like cells in normal samples in each tissue plotted against the malignancy continuum. Samples are colored based on if they are from different disease stage. |
Top |
Malignant transformation related pathway analysis |
| Find out the enriched GO biological processes and KEGG pathways involved in transition from healthy to precancer to cancer |
| Tissue | Disease Stage | Enriched GO biological Processes |
| Colorectum | AD |  |
| Colorectum | SER |  |
| Colorectum | MSS |  |
| Colorectum | MSI-H |  |
| Colorectum | FAP |  |
| ∗Top 15 enriched GO BP terms are showed in the bar plot of each disease state in each tissue. Each row represents a significant GO biological process which is colored according to the -log10(p.adjust). |
| Page: 1 2 3 4 5 6 7 8 9 |
| GO ID | Tissue | Disease Stage | Description | Gene Ratio | Bg Ratio | pvalue | p.adjust | Count |
| GO:00324116 | Breast | Precancer | positive regulation of transporter activity | 16/1080 | 120/18723 | 1.46e-03 | 1.51e-02 | 16 |
| GO:00347673 | Breast | Precancer | positive regulation of ion transmembrane transport | 19/1080 | 167/18723 | 3.60e-03 | 2.98e-02 | 19 |
| GO:00324143 | Breast | Precancer | positive regulation of ion transmembrane transporter activity | 14/1080 | 109/18723 | 3.97e-03 | 3.15e-02 | 14 |
| GO:00109596 | Breast | Precancer | regulation of metal ion transport | 37/1080 | 406/18723 | 4.07e-03 | 3.22e-02 | 37 |
| GO:00228985 | Breast | Precancer | regulation of transmembrane transporter activity | 27/1080 | 278/18723 | 5.72e-03 | 4.11e-02 | 27 |
| GO:001095913 | Breast | IDC | regulation of metal ion transport | 52/1434 | 406/18723 | 1.76e-04 | 2.97e-03 | 52 |
| GO:003241111 | Breast | IDC | positive regulation of transporter activity | 20/1434 | 120/18723 | 7.64e-04 | 9.27e-03 | 20 |
| GO:00432703 | Breast | IDC | positive regulation of ion transport | 36/1434 | 275/18723 | 1.11e-03 | 1.22e-02 | 36 |
| GO:002289812 | Breast | IDC | regulation of transmembrane transporter activity | 36/1434 | 278/18723 | 1.35e-03 | 1.40e-02 | 36 |
| GO:003241411 | Breast | IDC | positive regulation of ion transmembrane transporter activity | 18/1434 | 109/18723 | 1.53e-03 | 1.53e-02 | 18 |
| GO:003476711 | Breast | IDC | positive regulation of ion transmembrane transport | 24/1434 | 167/18723 | 2.07e-03 | 1.95e-02 | 24 |
| GO:00324125 | Breast | IDC | regulation of ion transmembrane transporter activity | 33/1434 | 267/18723 | 4.38e-03 | 3.40e-02 | 33 |
| GO:00324096 | Breast | IDC | regulation of transporter activity | 37/1434 | 310/18723 | 4.77e-03 | 3.66e-02 | 37 |
| GO:00347644 | Breast | IDC | positive regulation of transmembrane transport | 28/1434 | 219/18723 | 5.19e-03 | 3.86e-02 | 28 |
| GO:001095921 | Breast | DCIS | regulation of metal ion transport | 50/1390 | 406/18723 | 2.86e-04 | 4.22e-03 | 50 |
| GO:003241121 | Breast | DCIS | positive regulation of transporter activity | 20/1390 | 120/18723 | 5.16e-04 | 6.73e-03 | 20 |
| GO:003241421 | Breast | DCIS | positive regulation of ion transmembrane transporter activity | 18/1390 | 109/18723 | 1.07e-03 | 1.17e-02 | 18 |
| GO:003476721 | Breast | DCIS | positive regulation of ion transmembrane transport | 24/1390 | 167/18723 | 1.37e-03 | 1.42e-02 | 24 |
| GO:002289822 | Breast | DCIS | regulation of transmembrane transporter activity | 35/1390 | 278/18723 | 1.50e-03 | 1.51e-02 | 35 |
| GO:004327011 | Breast | DCIS | positive regulation of ion transport | 34/1390 | 275/18723 | 2.35e-03 | 2.13e-02 | 34 |
| Page: 1 2 |
| Pathway ID | Tissue | Disease Stage | Description | Gene Ratio | Bg Ratio | pvalue | p.adjust | qvalue | Count |
| Page: 1 |
Top |
Cell-cell communication analysis |
| Identification of potential cell-cell interactions between two cell types and their ligand-receptor pairs for different disease states |
| Ligand | Receptor | LRpair | Pathway | Tissue | Disease Stage |
| Page: 1 |
Top |
Single-cell gene regulatory network inference analysis |
| Find out the significant the regulons (TFs) and the target genes of each regulon across cell types for different disease states |
| TF | Cell Type | Tissue | Disease Stage | Target Gene | RSS | Regulon Activity |
| ∗The dot plots of a searched regulon are shown for all cell subpopulations in each disease state of each tissue based on the regulon specific score inferred using pySCENIC and by calculating the average expression. |
| Page: 1 |
Top |
Somatic mutation of malignant transformation related genes |
| Annotation of somatic variants for genes involved in malignant transformation |
| Hugo Symbol | Variant Class | Variant Classification | dbSNP RS | HGVSc | HGVSp | HGVSp Short | SWISSPROT | BIOTYPE | SIFT | PolyPhen | Tumor Sample Barcode | Tissue | Histology | Sex | Age | Stage | Therapy Types | Drugs | Outcome |
| LRRC26 | SNV | Missense_Mutation | c.953N>T | p.Gly318Val | p.G318V | Q2I0M4 | protein_coding | tolerated_low_confidence(0.07) | benign(0.035) | TCGA-69-7979-01 | Lung | lung adenocarcinoma | Female | >=65 | I/II | Unknown | Unknown | SD |
| Page: 1 |
Top |
Related drugs of malignant transformation related genes |
| Identification of chemicals and drugs interact with genes involved in malignant transfromation |
| (DGIdb 4.0) |
| Entrez ID | Symbol | Category | Interaction Types | Drug Claim Name | Drug Name | PMIDs |
| Page: 1 |

Copyright 2023-Present -The University of Texas Health Science Center at Houston |