
|
|||||
|
 | |
| |
| |
| |
| |
| |
|
Gene: LRRC17 |
Gene summary for LRRC17 |
| Gene information | Species | Human | Gene symbol | LRRC17 | Gene ID | 10234 |
| Gene name | leucine rich repeat containing 17 | |
| Gene Alias | P37NB | |
| Cytomap | 7q22.1 | |
| Gene Type | protein-coding | GO ID | GO:0001501 | UniProtAcc | Q8N6Y2 |
Top |
Malignant transformation analysis |
| Identification of the aberrant gene expression in precancerous and cancerous lesions by comparing the gene expression of stem-like cells in diseased tissues with normal stem cells |
| Entrez ID | Symbol | Replicates | Species | Organ | Tissue | Adj P-value | Log2FC | Malignancy |
| 10234 | LRRC17 | ATC13 | Human | Thyroid | ATC | 9.29e-82 | 1.79e+00 | 0.34 |
| 10234 | LRRC17 | ATC2 | Human | Thyroid | ATC | 3.82e-02 | 6.55e-01 | 0.34 |
| 10234 | LRRC17 | ATC5 | Human | Thyroid | ATC | 2.95e-82 | 1.88e+00 | 0.34 |
| Page: 1 |
| Tissue | Expression Dynamics | Abbreviation |
| Thyroid | 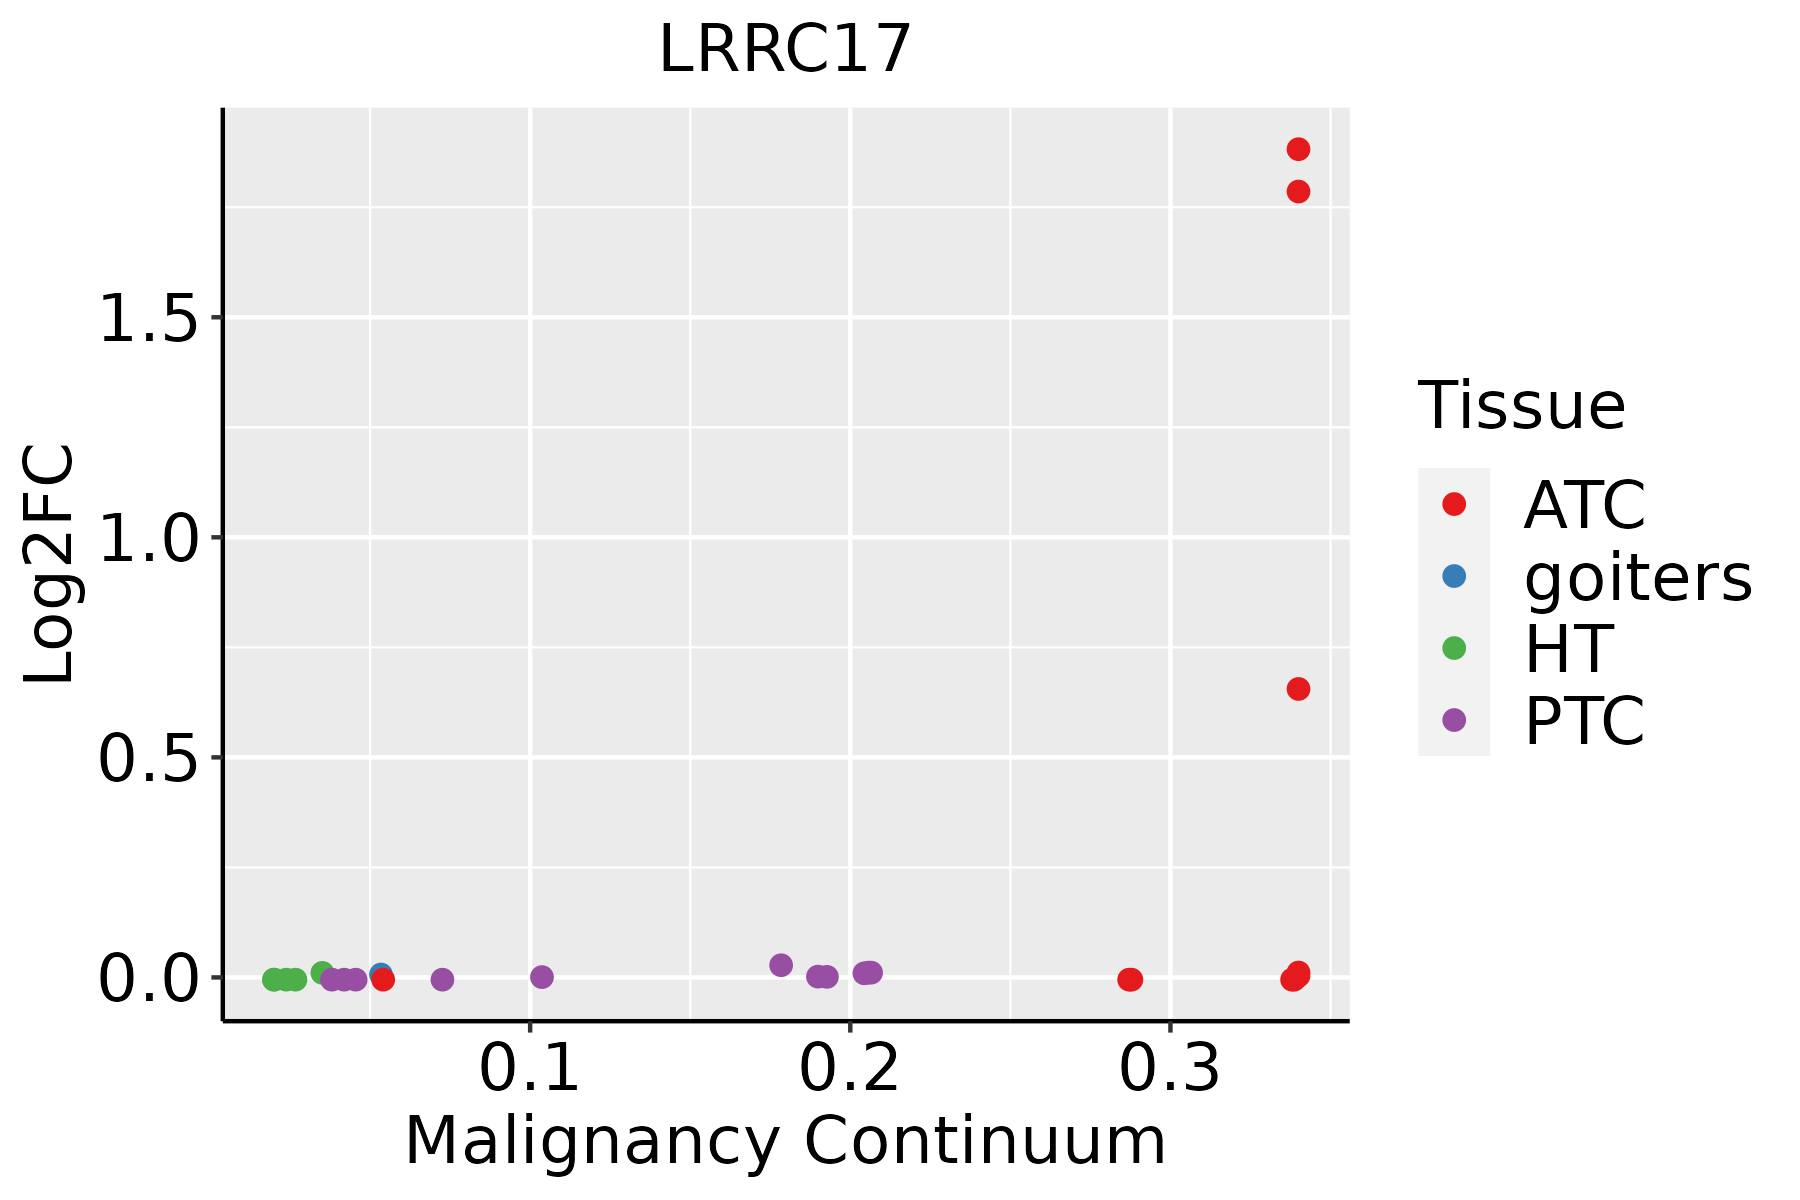 | ATC: Anaplastic thyroid cancer |
| HT: Hashimoto's thyroiditis | ||
| PTC: Papillary thyroid cancer |
| ∗log2FC in expression of this searched gene in stem-like cells from each diseased tissue sample relative to stem-like cells in normal samples in each tissue plotted against the malignancy continuum. Samples are colored based on if they are from different disease stage. |
Top |
Malignant transformation related pathway analysis |
| Find out the enriched GO biological processes and KEGG pathways involved in transition from healthy to precancer to cancer |
| Tissue | Disease Stage | Enriched GO biological Processes |
| Colorectum | AD |  |
| Colorectum | SER |  |
| Colorectum | MSS |  |
| Colorectum | MSI-H |  |
| Colorectum | FAP |  |
| ∗Top 15 enriched GO BP terms are showed in the bar plot of each disease state in each tissue. Each row represents a significant GO biological process which is colored according to the -log10(p.adjust). |
| Page: 1 2 3 4 5 6 7 8 9 |
| GO ID | Tissue | Disease Stage | Description | Gene Ratio | Bg Ratio | pvalue | p.adjust | Count |
| GO:006034813 | Thyroid | ATC | bone development | 102/6293 | 205/18723 | 1.18e-06 | 1.52e-05 | 102 |
| GO:003009933 | Thyroid | ATC | myeloid cell differentiation | 170/6293 | 381/18723 | 4.26e-06 | 4.68e-05 | 170 |
| GO:1903706112 | Thyroid | ATC | regulation of hemopoiesis | 148/6293 | 367/18723 | 3.87e-03 | 1.68e-02 | 148 |
| GO:0045637113 | Thyroid | ATC | regulation of myeloid cell differentiation | 89/6293 | 210/18723 | 4.75e-03 | 1.96e-02 | 89 |
| GO:0002573110 | Thyroid | ATC | myeloid leukocyte differentiation | 86/6293 | 208/18723 | 1.15e-02 | 4.11e-02 | 86 |
| Page: 1 |
| Pathway ID | Tissue | Disease Stage | Description | Gene Ratio | Bg Ratio | pvalue | p.adjust | qvalue | Count |
| Page: 1 |
Top |
Cell-cell communication analysis |
| Identification of potential cell-cell interactions between two cell types and their ligand-receptor pairs for different disease states |
| Ligand | Receptor | LRpair | Pathway | Tissue | Disease Stage |
| Page: 1 |
Top |
Single-cell gene regulatory network inference analysis |
| Find out the significant the regulons (TFs) and the target genes of each regulon across cell types for different disease states |
| TF | Cell Type | Tissue | Disease Stage | Target Gene | RSS | Regulon Activity |
| ∗The dot plots of a searched regulon are shown for all cell subpopulations in each disease state of each tissue based on the regulon specific score inferred using pySCENIC and by calculating the average expression. |
| Page: 1 |
Top |
Somatic mutation of malignant transformation related genes |
| Annotation of somatic variants for genes involved in malignant transformation |
| Hugo Symbol | Variant Class | Variant Classification | dbSNP RS | HGVSc | HGVSp | HGVSp Short | SWISSPROT | BIOTYPE | SIFT | PolyPhen | Tumor Sample Barcode | Tissue | Histology | Sex | Age | Stage | Therapy Types | Drugs | Outcome |
| LRRC17 | deletion | Frame_Shift_Del | rs769532305 | c.1265delN | p.Lys424AsnfsTer12 | p.K424Nfs*12 | Q8N6Y2 | protein_coding | TCGA-BH-A18G-01 | Breast | breast invasive carcinoma | Female | >=65 | I/II | Unknown | Unknown | SD | ||
| LRRC17 | SNV | Missense_Mutation | novel | c.86N>C | p.Arg29Pro | p.R29P | Q8N6Y2 | protein_coding | deleterious(0.01) | benign(0.204) | TCGA-VS-A958-01 | Cervix | cervical & endocervical cancer | Female | <65 | I/II | Chemotherapy | cisplatin | CR |
| LRRC17 | SNV | Missense_Mutation | c.989A>G | p.Asn330Ser | p.N330S | Q8N6Y2 | protein_coding | tolerated(0.53) | benign(0.007) | TCGA-A6-5665-01 | Colorectum | colon adenocarcinoma | Female | >=65 | I/II | Unknown | Unknown | PD | |
| LRRC17 | SNV | Missense_Mutation | c.61N>A | p.Ala21Thr | p.A21T | Q8N6Y2 | protein_coding | tolerated(0.96) | benign(0) | TCGA-AA-3663-01 | Colorectum | colon adenocarcinoma | Male | <65 | I/II | Unknown | Unknown | SD | |
| LRRC17 | SNV | Missense_Mutation | rs753599817 | c.25T>G | p.Leu9Val | p.L9V | Q8N6Y2 | protein_coding | deleterious(0.01) | benign(0.351) | TCGA-AA-3949-01 | Colorectum | colon adenocarcinoma | Female | >=65 | III/IV | Unknown | Unknown | SD |
| LRRC17 | SNV | Missense_Mutation | rs376246276 | c.44C>T | p.Ala15Val | p.A15V | Q8N6Y2 | protein_coding | deleterious(0.02) | benign(0.031) | TCGA-AA-3984-01 | Colorectum | colon adenocarcinoma | Female | <65 | I/II | Unknown | Unknown | SD |
| LRRC17 | SNV | Missense_Mutation | novel | c.743N>T | p.Pro248Leu | p.P248L | Q8N6Y2 | protein_coding | deleterious(0) | probably_damaging(0.999) | TCGA-AA-A00N-01 | Colorectum | colon adenocarcinoma | Male | >=65 | I/II | Unknown | Unknown | PD |
| LRRC17 | SNV | Missense_Mutation | rs752823104 | c.281N>A | p.Arg94His | p.R94H | Q8N6Y2 | protein_coding | deleterious(0.01) | probably_damaging(0.973) | TCGA-AA-A022-01 | Colorectum | colon adenocarcinoma | Female | >=65 | I/II | Unknown | Unknown | SD |
| LRRC17 | SNV | Missense_Mutation | novel | c.510N>T | p.Glu170Asp | p.E170D | Q8N6Y2 | protein_coding | tolerated(0.47) | benign(0) | TCGA-AZ-4315-01 | Colorectum | colon adenocarcinoma | Male | <65 | I/II | Unknown | Unknown | SD |
| LRRC17 | SNV | Missense_Mutation | novel | c.597N>C | p.Lys199Asn | p.K199N | Q8N6Y2 | protein_coding | deleterious(0.01) | benign(0.327) | TCGA-AZ-4315-01 | Colorectum | colon adenocarcinoma | Male | <65 | I/II | Unknown | Unknown | SD |
| Page: 1 2 3 4 5 6 7 8 |
Top |
Related drugs of malignant transformation related genes |
| Identification of chemicals and drugs interact with genes involved in malignant transfromation |
| (DGIdb 4.0) |
| Entrez ID | Symbol | Category | Interaction Types | Drug Claim Name | Drug Name | PMIDs |
| Page: 1 |

Copyright 2023-Present -The University of Texas Health Science Center at Houston |