
|
|||||
|
 | |
| |
| |
| |
| |
| |
|
Gene: LRRC1 |
Gene summary for LRRC1 |
| Gene information | Species | Human | Gene symbol | LRRC1 | Gene ID | 55227 |
| Gene name | leucine rich repeat containing 1 | |
| Gene Alias | LANO | |
| Cytomap | 6p12.1 | |
| Gene Type | protein-coding | GO ID | GO:0005575 | UniProtAcc | Q9BTT6 |
Top |
Malignant transformation analysis |
| Identification of the aberrant gene expression in precancerous and cancerous lesions by comparing the gene expression of stem-like cells in diseased tissues with normal stem cells |
| Entrez ID | Symbol | Replicates | Species | Organ | Tissue | Adj P-value | Log2FC | Malignancy |
| 55227 | LRRC1 | CCI_1 | Human | Cervix | CC | 3.59e-14 | 9.21e-01 | 0.528 |
| 55227 | LRRC1 | CCI_2 | Human | Cervix | CC | 1.43e-14 | 1.04e+00 | 0.5249 |
| 55227 | LRRC1 | CCI_3 | Human | Cervix | CC | 1.59e-09 | 6.04e-01 | 0.516 |
| 55227 | LRRC1 | Tumor | Human | Cervix | CC | 1.04e-06 | 1.97e-01 | 0.1241 |
| 55227 | LRRC1 | sample3 | Human | Cervix | CC | 1.08e-08 | 2.62e-01 | 0.1387 |
| 55227 | LRRC1 | T3 | Human | Cervix | CC | 1.01e-10 | 2.84e-01 | 0.1389 |
| 55227 | LRRC1 | HTA11_3410_2000001011 | Human | Colorectum | AD | 5.14e-09 | -4.52e-01 | 0.0155 |
| 55227 | LRRC1 | HTA11_411_2000001011 | Human | Colorectum | SER | 2.27e-02 | 9.19e-01 | -0.2602 |
| 55227 | LRRC1 | HTA11_7696_3000711011 | Human | Colorectum | AD | 1.08e-04 | -2.91e-01 | 0.0674 |
| 55227 | LRRC1 | HTA11_99999974143_84620 | Human | Colorectum | MSS | 5.42e-08 | -4.12e-01 | 0.3005 |
| 55227 | LRRC1 | A015-C-203 | Human | Colorectum | FAP | 1.33e-21 | -4.11e-01 | -0.1294 |
| 55227 | LRRC1 | A015-C-204 | Human | Colorectum | FAP | 2.16e-04 | -3.17e-01 | -0.0228 |
| 55227 | LRRC1 | A014-C-040 | Human | Colorectum | FAP | 3.35e-03 | -4.12e-01 | -0.1184 |
| 55227 | LRRC1 | A002-C-201 | Human | Colorectum | FAP | 4.65e-10 | -3.56e-01 | 0.0324 |
| 55227 | LRRC1 | A001-C-119 | Human | Colorectum | FAP | 4.76e-11 | -5.35e-01 | -0.1557 |
| 55227 | LRRC1 | A001-C-108 | Human | Colorectum | FAP | 4.55e-14 | -2.93e-01 | -0.0272 |
| 55227 | LRRC1 | A002-C-205 | Human | Colorectum | FAP | 8.13e-16 | -4.13e-01 | -0.1236 |
| 55227 | LRRC1 | A001-C-104 | Human | Colorectum | FAP | 6.73e-05 | -2.66e-01 | 0.0184 |
| 55227 | LRRC1 | A015-C-005 | Human | Colorectum | FAP | 2.03e-03 | -3.12e-01 | -0.0336 |
| 55227 | LRRC1 | A015-C-006 | Human | Colorectum | FAP | 8.17e-11 | -4.51e-01 | -0.0994 |
| Page: 1 2 3 4 5 6 7 |
| Tissue | Expression Dynamics | Abbreviation |
| Cervix |  | CC: Cervix cancer |
| HSIL_HPV: HPV-infected high-grade squamous intraepithelial lesions | ||
| N_HPV: HPV-infected normal cervix | ||
| Colorectum (GSE201348) |  | FAP: Familial adenomatous polyposis |
| CRC: Colorectal cancer | ||
| Colorectum (HTA11) |  | AD: Adenomas |
| SER: Sessile serrated lesions | ||
| MSI-H: Microsatellite-high colorectal cancer | ||
| MSS: Microsatellite stable colorectal cancer | ||
| Esophagus | 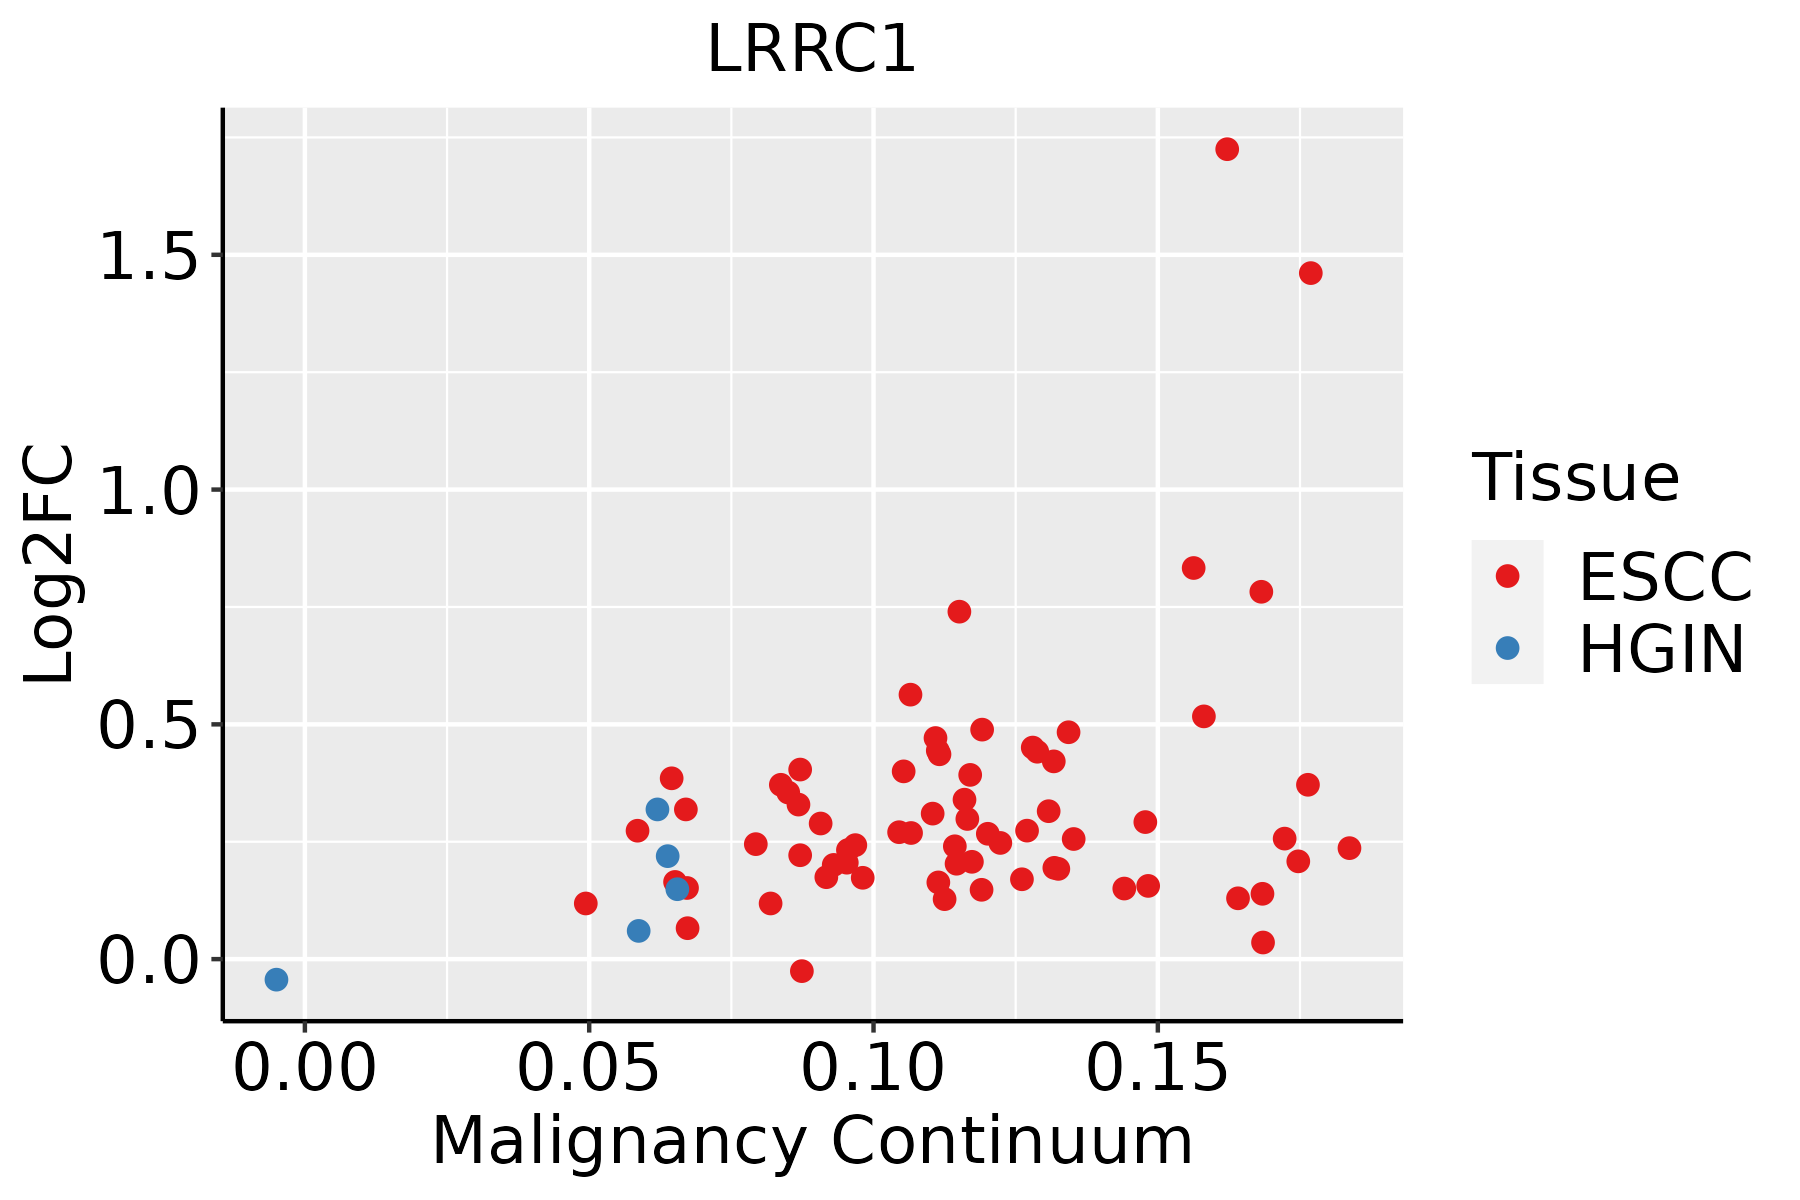 | ESCC: Esophageal squamous cell carcinoma |
| HGIN: High-grade intraepithelial neoplasias | ||
| LGIN: Low-grade intraepithelial neoplasias | ||
| Lung |  | AAH: Atypical adenomatous hyperplasia |
| AIS: Adenocarcinoma in situ | ||
| IAC: Invasive lung adenocarcinoma | ||
| MIA: Minimally invasive adenocarcinoma | ||
| Oral Cavity | 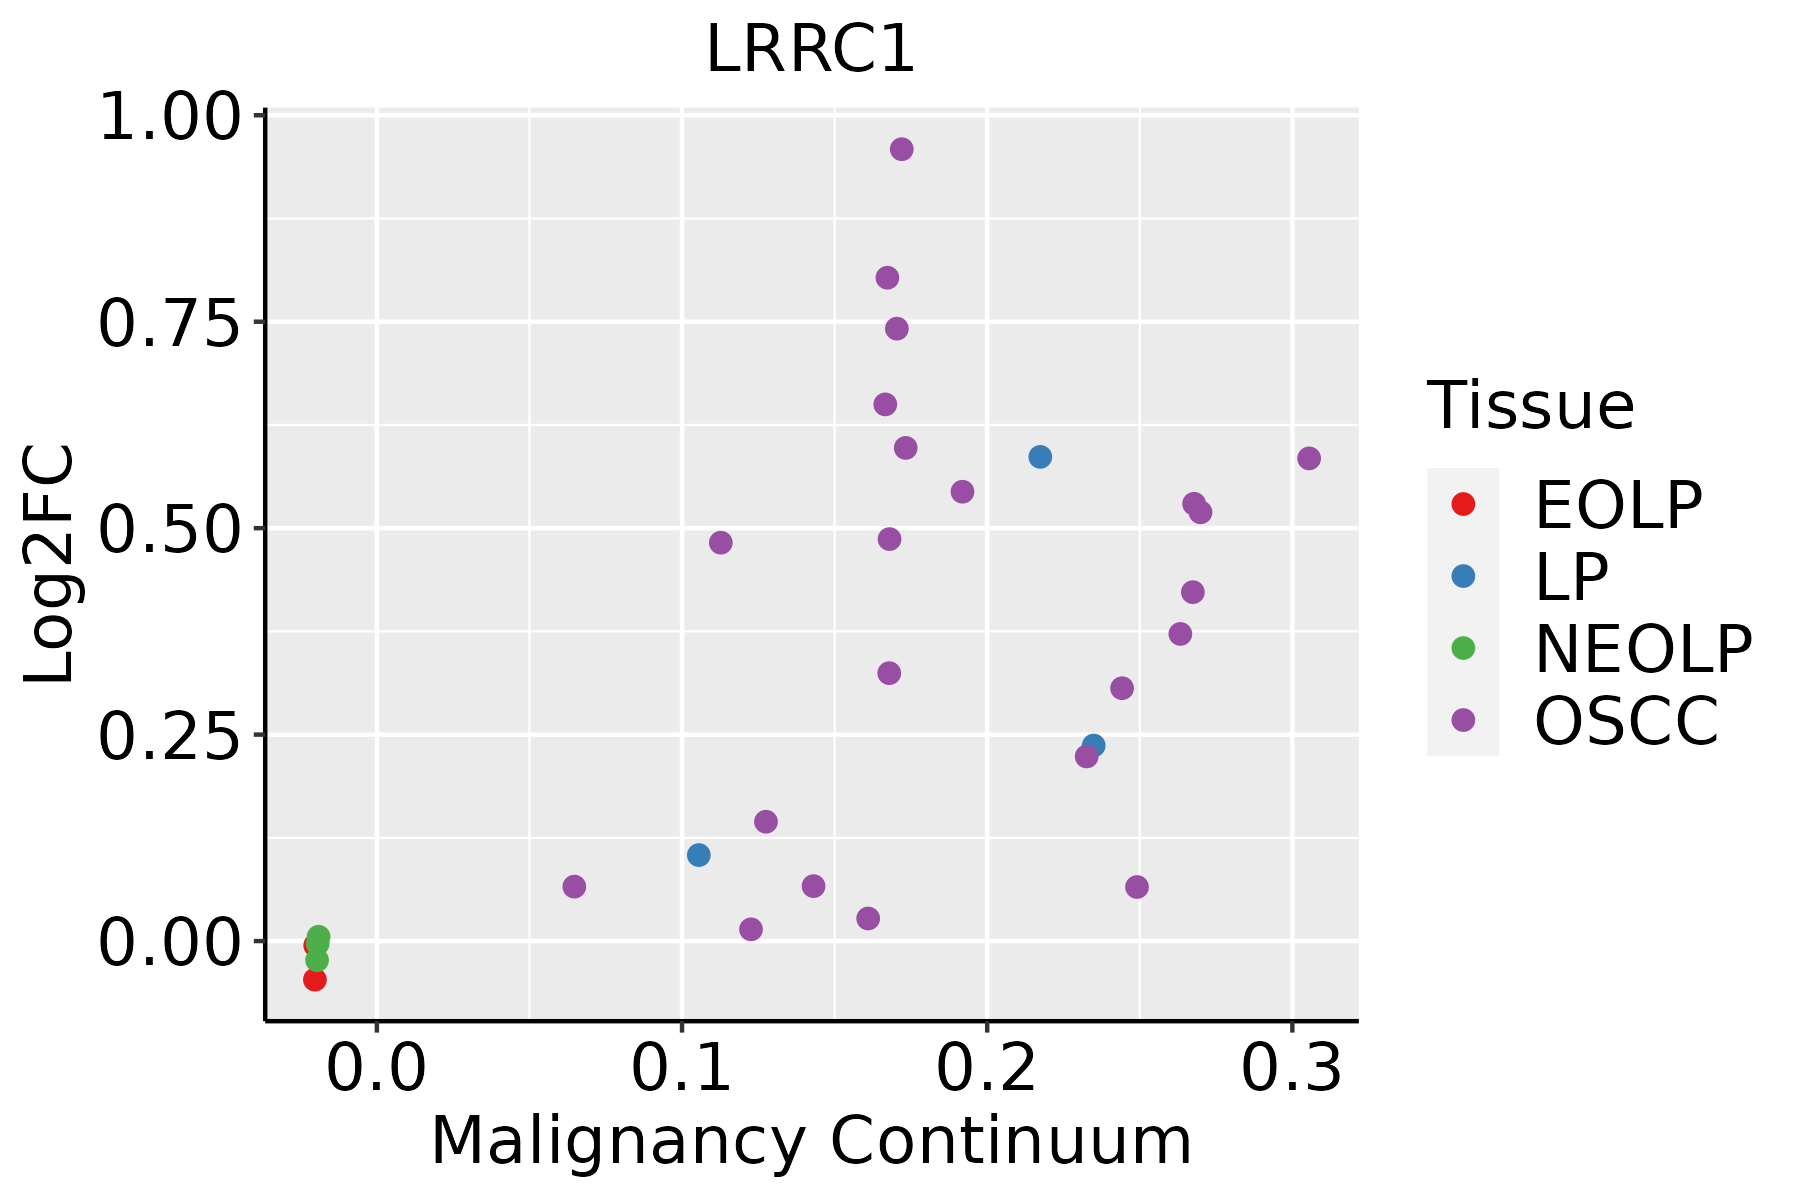 | EOLP: Erosive Oral lichen planus |
| LP: leukoplakia | ||
| NEOLP: Non-erosive oral lichen planus | ||
| OSCC: Oral squamous cell carcinoma | ||
| Skin | 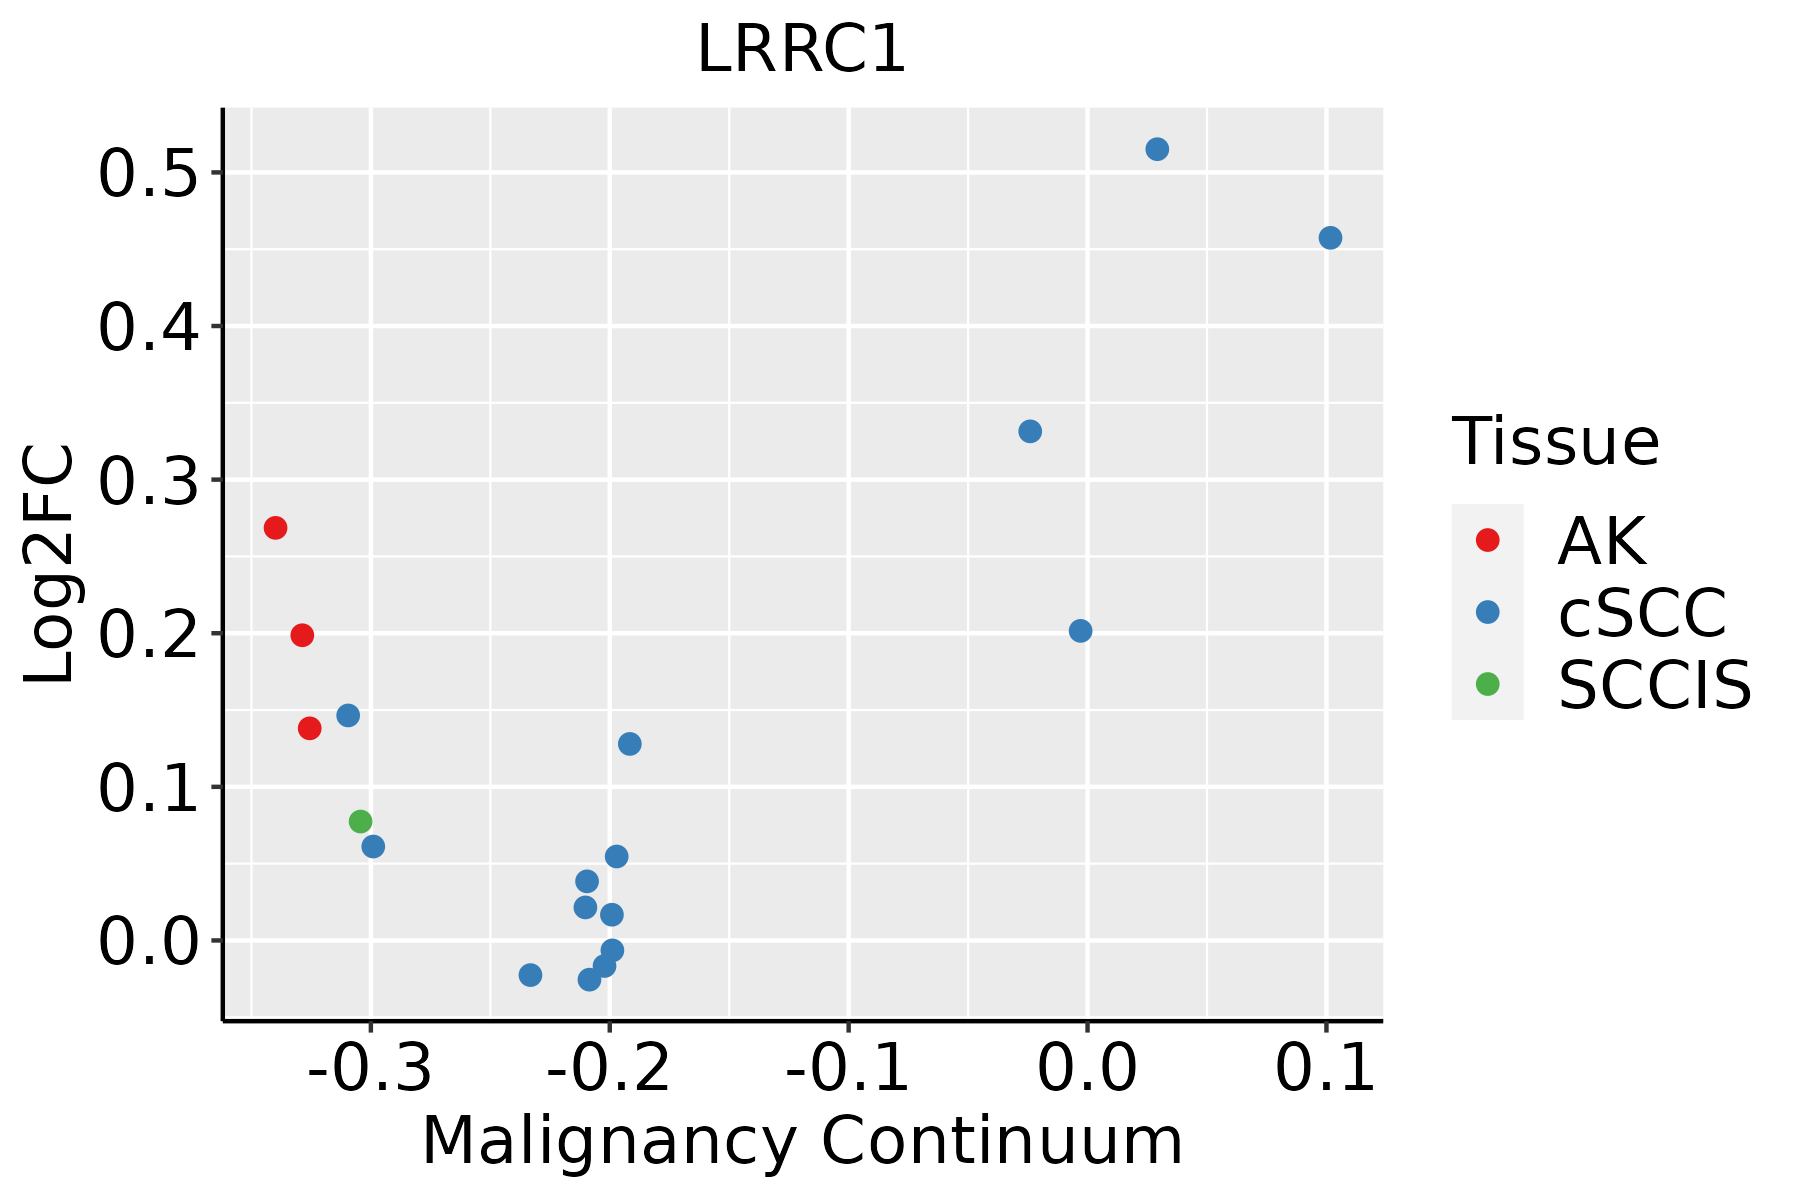 | AK: Actinic keratosis |
| cSCC: Cutaneous squamous cell carcinoma | ||
| SCCIS:squamous cell carcinoma in situ | ||
| Thyroid | 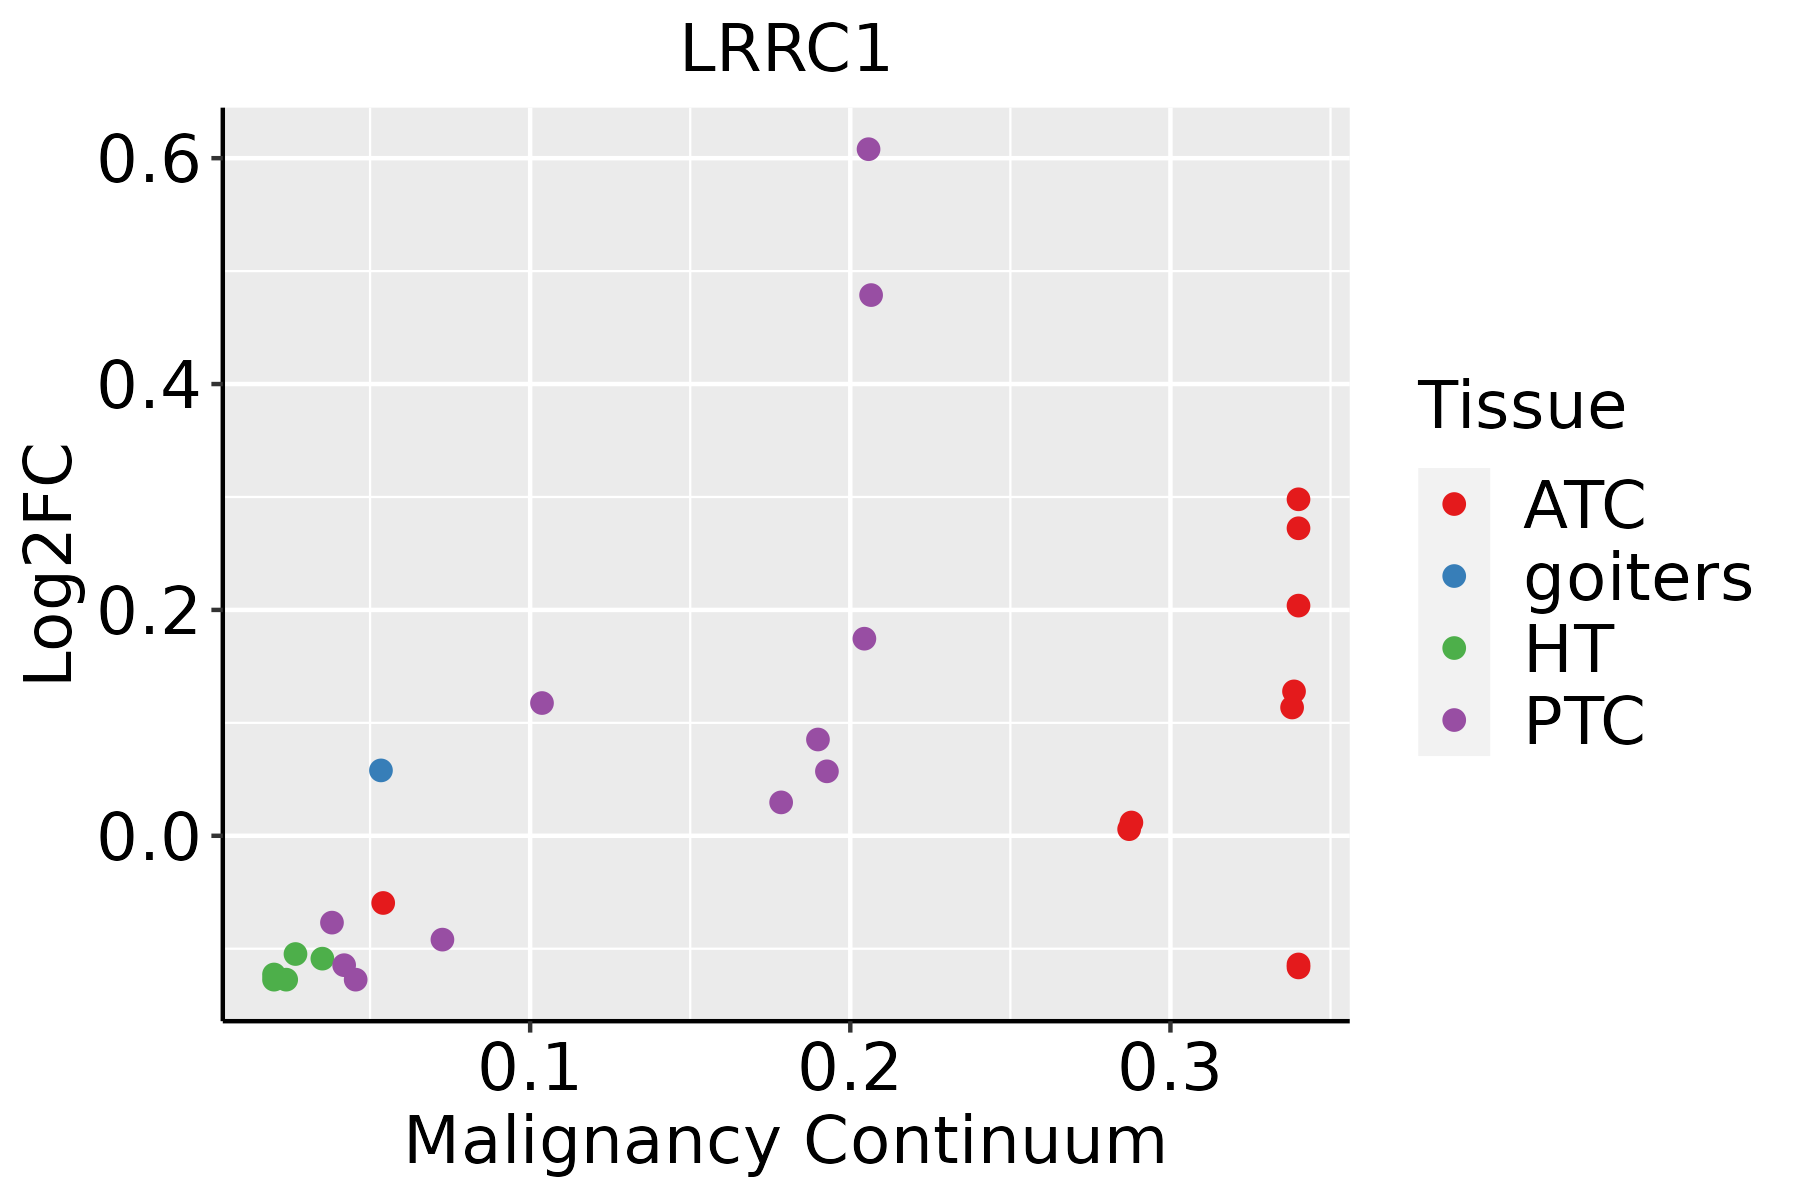 | ATC: Anaplastic thyroid cancer |
| HT: Hashimoto's thyroiditis | ||
| PTC: Papillary thyroid cancer |
| ∗log2FC in expression of this searched gene in stem-like cells from each diseased tissue sample relative to stem-like cells in normal samples in each tissue plotted against the malignancy continuum. Samples are colored based on if they are from different disease stage. |
Top |
Malignant transformation related pathway analysis |
| Find out the enriched GO biological processes and KEGG pathways involved in transition from healthy to precancer to cancer |
| Tissue | Disease Stage | Enriched GO biological Processes |
| Colorectum | AD |  |
| Colorectum | SER |  |
| Colorectum | MSS |  |
| Colorectum | MSI-H |  |
| Colorectum | FAP |  |
| ∗Top 15 enriched GO BP terms are showed in the bar plot of each disease state in each tissue. Each row represents a significant GO biological process which is colored according to the -log10(p.adjust). |
| Page: 1 2 3 4 5 6 7 8 9 |
| GO ID | Tissue | Disease Stage | Description | Gene Ratio | Bg Ratio | pvalue | p.adjust | Count |
| GO:0044403 | Colorectum | AD | biological process involved in symbiotic interaction | 99/3918 | 290/18723 | 1.02e-07 | 4.93e-06 | 99 |
| GO:0048872 | Colorectum | AD | homeostasis of number of cells | 87/3918 | 272/18723 | 1.16e-05 | 2.61e-04 | 87 |
| GO:0035821 | Colorectum | AD | modulation of process of other organism | 34/3918 | 106/18723 | 4.73e-03 | 3.22e-02 | 34 |
| GO:00444032 | Colorectum | MSS | biological process involved in symbiotic interaction | 93/3467 | 290/18723 | 1.72e-08 | 9.85e-07 | 93 |
| GO:00488722 | Colorectum | MSS | homeostasis of number of cells | 82/3467 | 272/18723 | 2.02e-06 | 6.28e-05 | 82 |
| GO:00358211 | Colorectum | MSS | modulation of process of other organism | 33/3467 | 106/18723 | 1.18e-03 | 1.14e-02 | 33 |
| GO:0002221 | Colorectum | MSS | pattern recognition receptor signaling pathway | 45/3467 | 172/18723 | 8.06e-03 | 4.91e-02 | 45 |
| GO:00444034 | Colorectum | FAP | biological process involved in symbiotic interaction | 66/2622 | 290/18723 | 3.47e-05 | 7.64e-04 | 66 |
| GO:00488724 | Colorectum | FAP | homeostasis of number of cells | 60/2622 | 272/18723 | 1.91e-04 | 2.79e-03 | 60 |
| GO:00444035 | Colorectum | CRC | biological process involved in symbiotic interaction | 55/2078 | 290/18723 | 4.82e-05 | 1.12e-03 | 55 |
| GO:00488725 | Colorectum | CRC | homeostasis of number of cells | 48/2078 | 272/18723 | 7.78e-04 | 9.87e-03 | 48 |
| GO:00510908 | Esophagus | ESCC | regulation of DNA-binding transcription factor activity | 252/8552 | 440/18723 | 5.22e-07 | 6.97e-06 | 252 |
| GO:00434332 | Esophagus | ESCC | negative regulation of DNA-binding transcription factor activity | 103/8552 | 185/18723 | 3.86e-03 | 1.57e-02 | 103 |
| GO:00320882 | Esophagus | ESCC | negative regulation of NF-kappaB transcription factor activity | 54/8552 | 93/18723 | 1.08e-02 | 3.67e-02 | 54 |
| GO:00022211 | Liver | HCC | pattern recognition receptor signaling pathway | 107/7958 | 172/18723 | 1.37e-07 | 2.58e-06 | 107 |
| GO:00510902 | Liver | HCC | regulation of DNA-binding transcription factor activity | 220/7958 | 440/18723 | 8.04e-04 | 4.82e-03 | 220 |
| GO:0002224 | Liver | HCC | toll-like receptor signaling pathway | 67/7958 | 121/18723 | 2.87e-03 | 1.34e-02 | 67 |
| GO:00622072 | Liver | HCC | regulation of pattern recognition receptor signaling pathway | 59/7958 | 105/18723 | 3.18e-03 | 1.47e-02 | 59 |
| GO:00510907 | Oral cavity | OSCC | regulation of DNA-binding transcription factor activity | 221/7305 | 440/18723 | 9.06e-07 | 1.23e-05 | 221 |
| GO:00022214 | Oral cavity | OSCC | pattern recognition receptor signaling pathway | 95/7305 | 172/18723 | 1.11e-05 | 1.15e-04 | 95 |
| Page: 1 2 |
| Pathway ID | Tissue | Disease Stage | Description | Gene Ratio | Bg Ratio | pvalue | p.adjust | qvalue | Count |
| Page: 1 |
Top |
Cell-cell communication analysis |
| Identification of potential cell-cell interactions between two cell types and their ligand-receptor pairs for different disease states |
| Ligand | Receptor | LRpair | Pathway | Tissue | Disease Stage |
| Page: 1 |
Top |
Single-cell gene regulatory network inference analysis |
| Find out the significant the regulons (TFs) and the target genes of each regulon across cell types for different disease states |
| TF | Cell Type | Tissue | Disease Stage | Target Gene | RSS | Regulon Activity |
| ∗The dot plots of a searched regulon are shown for all cell subpopulations in each disease state of each tissue based on the regulon specific score inferred using pySCENIC and by calculating the average expression. |
| Page: 1 |
Top |
Somatic mutation of malignant transformation related genes |
| Annotation of somatic variants for genes involved in malignant transformation |
| Hugo Symbol | Variant Class | Variant Classification | dbSNP RS | HGVSc | HGVSp | HGVSp Short | SWISSPROT | BIOTYPE | SIFT | PolyPhen | Tumor Sample Barcode | Tissue | Histology | Sex | Age | Stage | Therapy Types | Drugs | Outcome |
| LRRC1 | SNV | Missense_Mutation | novel | c.401C>T | p.Ser134Phe | p.S134F | Q9BTT6 | protein_coding | tolerated(0.64) | probably_damaging(0.996) | TCGA-AN-A046-01 | Breast | breast invasive carcinoma | Female | >=65 | I/II | Unknown | Unknown | SD |
| LRRC1 | SNV | Missense_Mutation | c.731N>T | p.Ser244Leu | p.S244L | Q9BTT6 | protein_coding | tolerated(0.21) | possibly_damaging(0.489) | TCGA-C8-A275-01 | Breast | breast invasive carcinoma | Female | <65 | I/II | Unknown | Unknown | SD | |
| LRRC1 | SNV | Missense_Mutation | c.1066C>G | p.Gln356Glu | p.Q356E | Q9BTT6 | protein_coding | tolerated(0.13) | benign(0.079) | TCGA-DR-A0ZM-01 | Cervix | cervical & endocervical cancer | Female | <65 | III/IV | Unspecific | Cisplatin | SD | |
| LRRC1 | SNV | Missense_Mutation | c.484C>T | p.Leu162Phe | p.L162F | Q9BTT6 | protein_coding | deleterious(0.03) | possibly_damaging(0.864) | TCGA-EK-A2PM-01 | Cervix | cervical & endocervical cancer | Female | >=65 | I/II | Unknown | Unknown | SD | |
| LRRC1 | SNV | Missense_Mutation | c.1568N>T | p.Ser523Phe | p.S523F | Q9BTT6 | protein_coding | deleterious_low_confidence(0) | probably_damaging(0.991) | TCGA-EK-A3GK-01 | Cervix | cervical & endocervical cancer | Female | <65 | I/II | Unknown | Unknown | SD | |
| LRRC1 | insertion | Frame_Shift_Ins | novel | c.625_626insT | p.Ser210ValfsTer20 | p.S210Vfs*20 | Q9BTT6 | protein_coding | TCGA-ZJ-AAXB-01 | Cervix | cervical & endocervical cancer | Female | <65 | I/II | Unknown | Unknown | SD | ||
| LRRC1 | SNV | Missense_Mutation | novel | c.1433N>C | p.Arg478Pro | p.R478P | Q9BTT6 | protein_coding | deleterious(0.01) | possibly_damaging(0.6) | TCGA-AA-3877-01 | Colorectum | colon adenocarcinoma | Female | >=65 | I/II | Unknown | Unknown | SD |
| LRRC1 | SNV | Missense_Mutation | novel | c.1055C>T | p.Ala352Val | p.A352V | Q9BTT6 | protein_coding | tolerated(0.13) | benign(0.01) | TCGA-AA-3949-01 | Colorectum | colon adenocarcinoma | Female | >=65 | III/IV | Unknown | Unknown | SD |
| LRRC1 | SNV | Missense_Mutation | rs751741483 | c.272N>A | p.Arg91Gln | p.R91Q | Q9BTT6 | protein_coding | deleterious(0.02) | probably_damaging(0.997) | TCGA-AA-3984-01 | Colorectum | colon adenocarcinoma | Female | <65 | I/II | Unknown | Unknown | SD |
| LRRC1 | SNV | Missense_Mutation | rs774261475 | c.1370C>T | p.Ala457Val | p.A457V | Q9BTT6 | protein_coding | tolerated(1) | benign(0.007) | TCGA-AM-5821-01 | Colorectum | colon adenocarcinoma | Female | >=65 | I/II | Unknown | Unknown | SD |
| Page: 1 2 3 4 5 |
Top |
Related drugs of malignant transformation related genes |
| Identification of chemicals and drugs interact with genes involved in malignant transfromation |
| (DGIdb 4.0) |
| Entrez ID | Symbol | Category | Interaction Types | Drug Claim Name | Drug Name | PMIDs |
| Page: 1 |

Copyright 2023-Present -The University of Texas Health Science Center at Houston |