
|
|||||
|
 | |
| |
| |
| |
| |
| |
|
Gene: LRR1 |
Gene summary for LRR1 |
| Gene information | Species | Human | Gene symbol | LRR1 | Gene ID | 122769 |
| Gene name | leucine rich repeat protein 1 | |
| Gene Alias | 4-1BBLRR | |
| Cytomap | 14q21.3 | |
| Gene Type | protein-coding | GO ID | GO:0006464 | UniProtAcc | Q6AWA7 |
Top |
Malignant transformation analysis |
| Identification of the aberrant gene expression in precancerous and cancerous lesions by comparing the gene expression of stem-like cells in diseased tissues with normal stem cells |
| Entrez ID | Symbol | Replicates | Species | Organ | Tissue | Adj P-value | Log2FC | Malignancy |
| 122769 | LRR1 | LZE2T | Human | Esophagus | ESCC | 1.95e-02 | 2.85e-01 | 0.082 |
| 122769 | LRR1 | LZE4T | Human | Esophagus | ESCC | 1.57e-02 | 1.18e-01 | 0.0811 |
| 122769 | LRR1 | LZE8T | Human | Esophagus | ESCC | 1.40e-02 | 8.61e-02 | 0.067 |
| 122769 | LRR1 | LZE20T | Human | Esophagus | ESCC | 2.51e-03 | 1.18e-01 | 0.0662 |
| 122769 | LRR1 | LZE24T | Human | Esophagus | ESCC | 2.70e-05 | 1.95e-01 | 0.0596 |
| 122769 | LRR1 | P2T-E | Human | Esophagus | ESCC | 8.55e-12 | 2.41e-01 | 0.1177 |
| 122769 | LRR1 | P4T-E | Human | Esophagus | ESCC | 7.15e-04 | 1.66e-01 | 0.1323 |
| 122769 | LRR1 | P5T-E | Human | Esophagus | ESCC | 8.48e-24 | 6.03e-01 | 0.1327 |
| 122769 | LRR1 | P8T-E | Human | Esophagus | ESCC | 6.01e-06 | 1.86e-01 | 0.0889 |
| 122769 | LRR1 | P9T-E | Human | Esophagus | ESCC | 1.81e-11 | 1.52e-01 | 0.1131 |
| 122769 | LRR1 | P10T-E | Human | Esophagus | ESCC | 1.36e-07 | 1.75e-01 | 0.116 |
| 122769 | LRR1 | P12T-E | Human | Esophagus | ESCC | 2.33e-11 | 2.14e-01 | 0.1122 |
| 122769 | LRR1 | P15T-E | Human | Esophagus | ESCC | 1.03e-12 | 3.18e-01 | 0.1149 |
| 122769 | LRR1 | P16T-E | Human | Esophagus | ESCC | 2.54e-03 | 9.28e-02 | 0.1153 |
| 122769 | LRR1 | P17T-E | Human | Esophagus | ESCC | 1.61e-06 | 3.20e-01 | 0.1278 |
| 122769 | LRR1 | P20T-E | Human | Esophagus | ESCC | 9.48e-04 | 1.04e-01 | 0.1124 |
| 122769 | LRR1 | P21T-E | Human | Esophagus | ESCC | 1.79e-13 | 2.91e-01 | 0.1617 |
| 122769 | LRR1 | P22T-E | Human | Esophagus | ESCC | 7.57e-07 | 1.09e-01 | 0.1236 |
| 122769 | LRR1 | P23T-E | Human | Esophagus | ESCC | 8.46e-11 | 1.98e-01 | 0.108 |
| 122769 | LRR1 | P24T-E | Human | Esophagus | ESCC | 1.76e-19 | 5.29e-01 | 0.1287 |
| Page: 1 2 3 4 |
| Tissue | Expression Dynamics | Abbreviation |
| Esophagus | 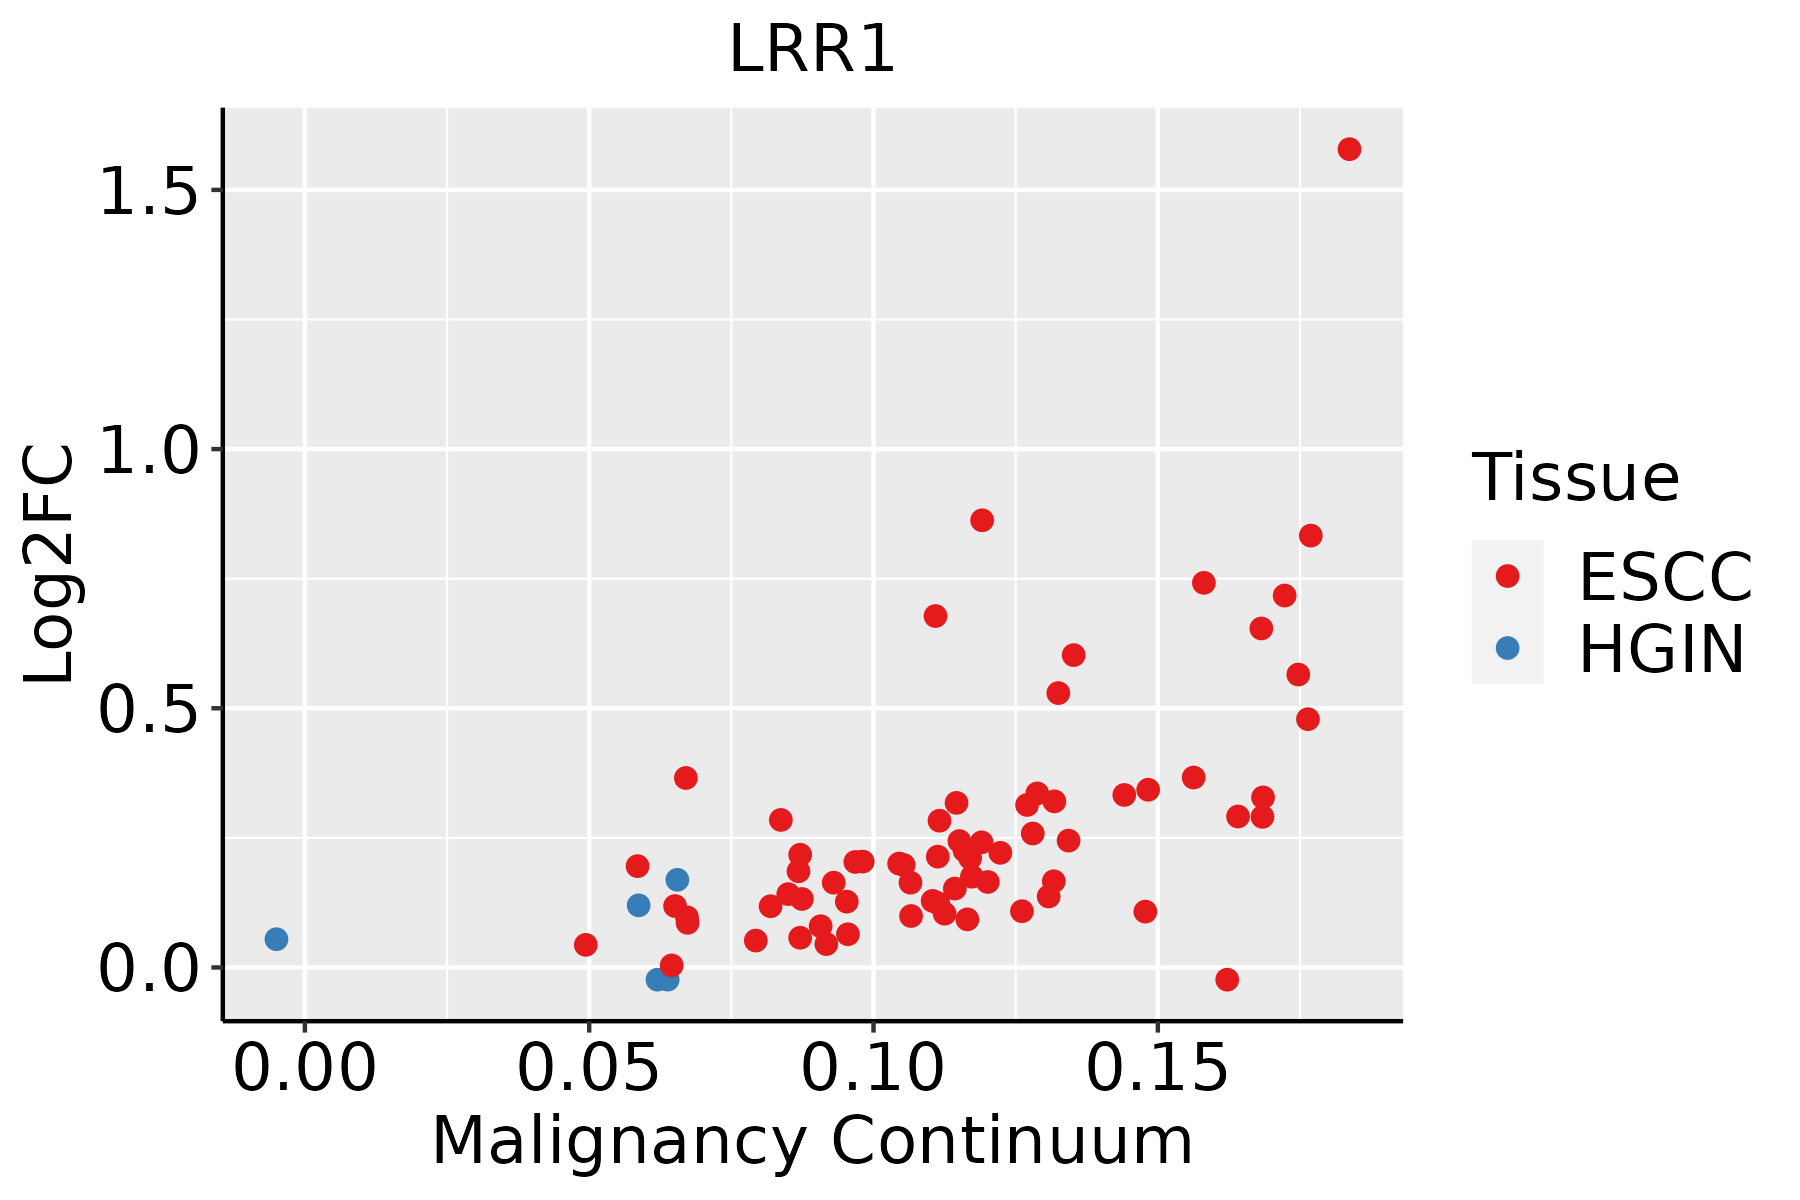 | ESCC: Esophageal squamous cell carcinoma |
| HGIN: High-grade intraepithelial neoplasias | ||
| LGIN: Low-grade intraepithelial neoplasias | ||
| Oral Cavity | 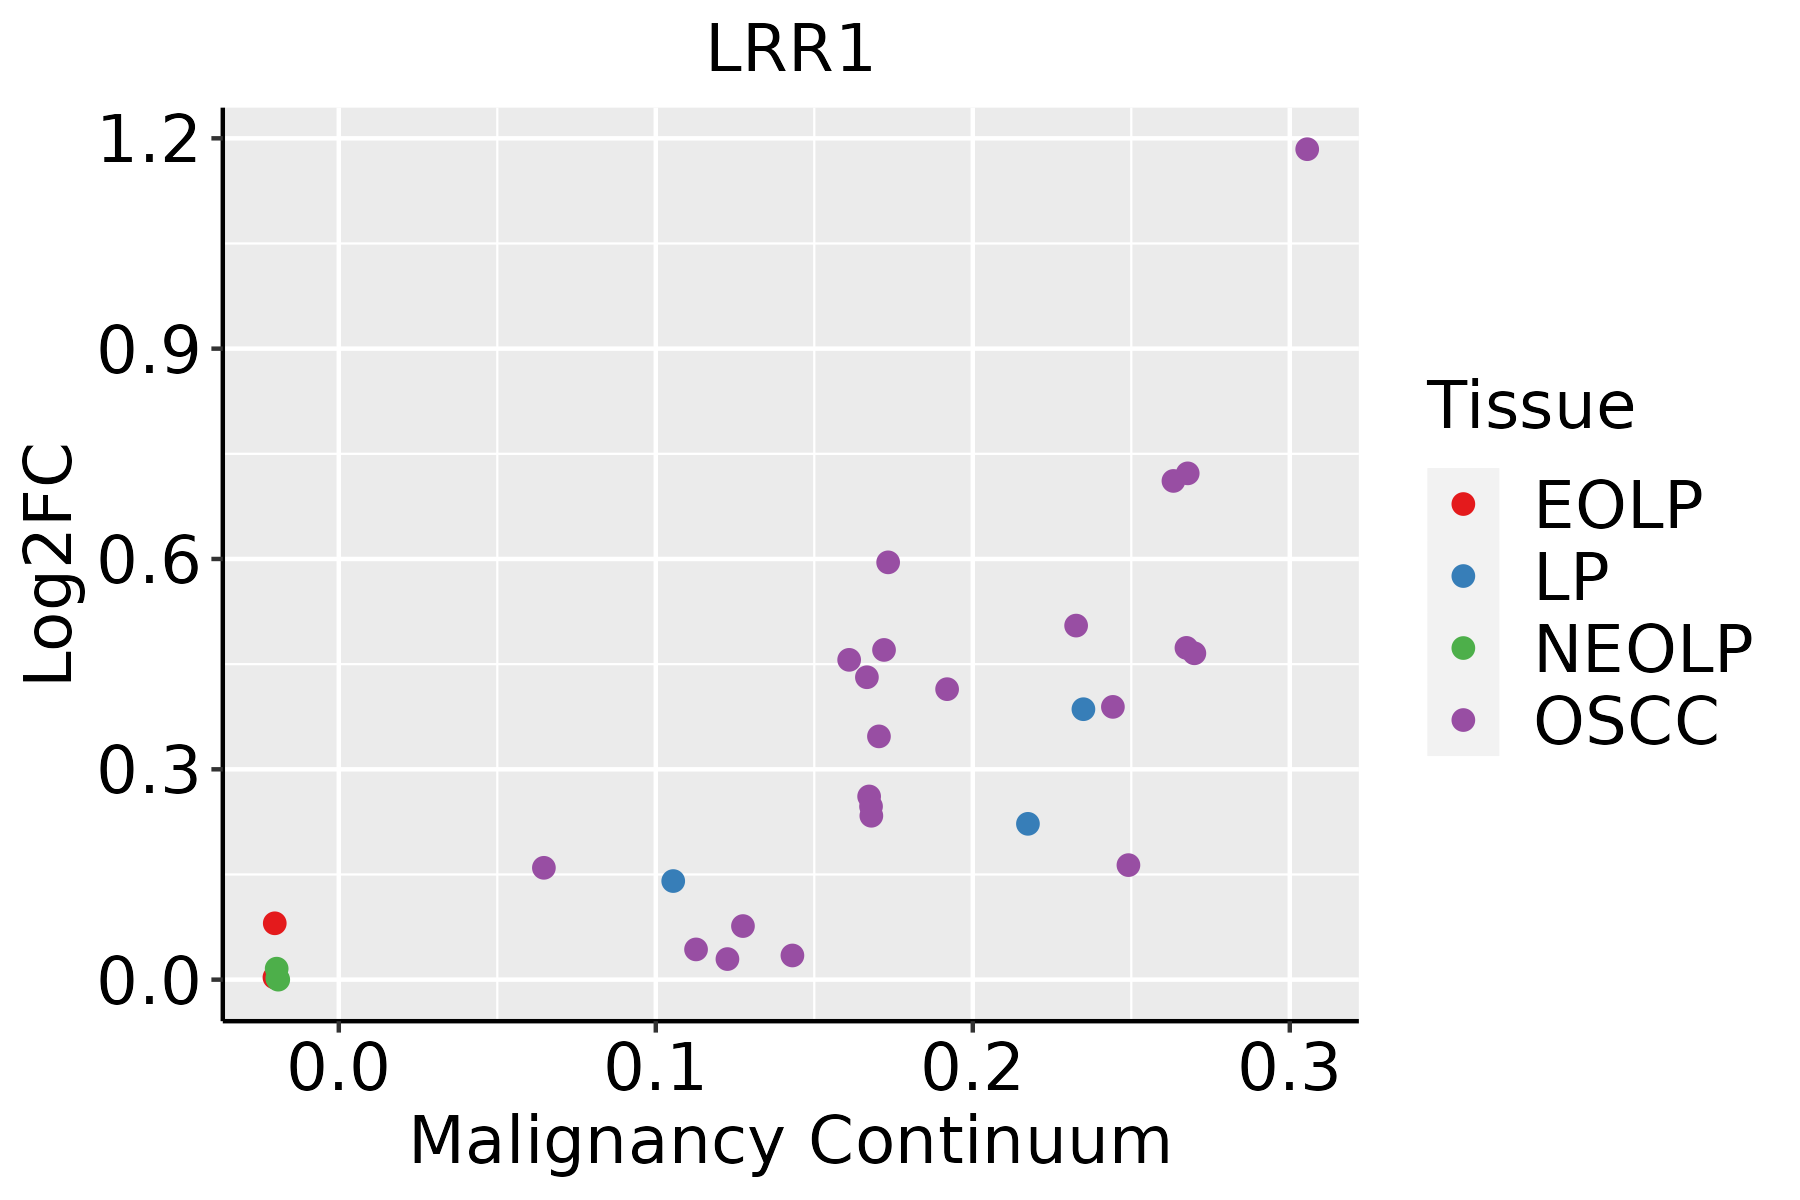 | EOLP: Erosive Oral lichen planus |
| LP: leukoplakia | ||
| NEOLP: Non-erosive oral lichen planus | ||
| OSCC: Oral squamous cell carcinoma | ||
| Skin | 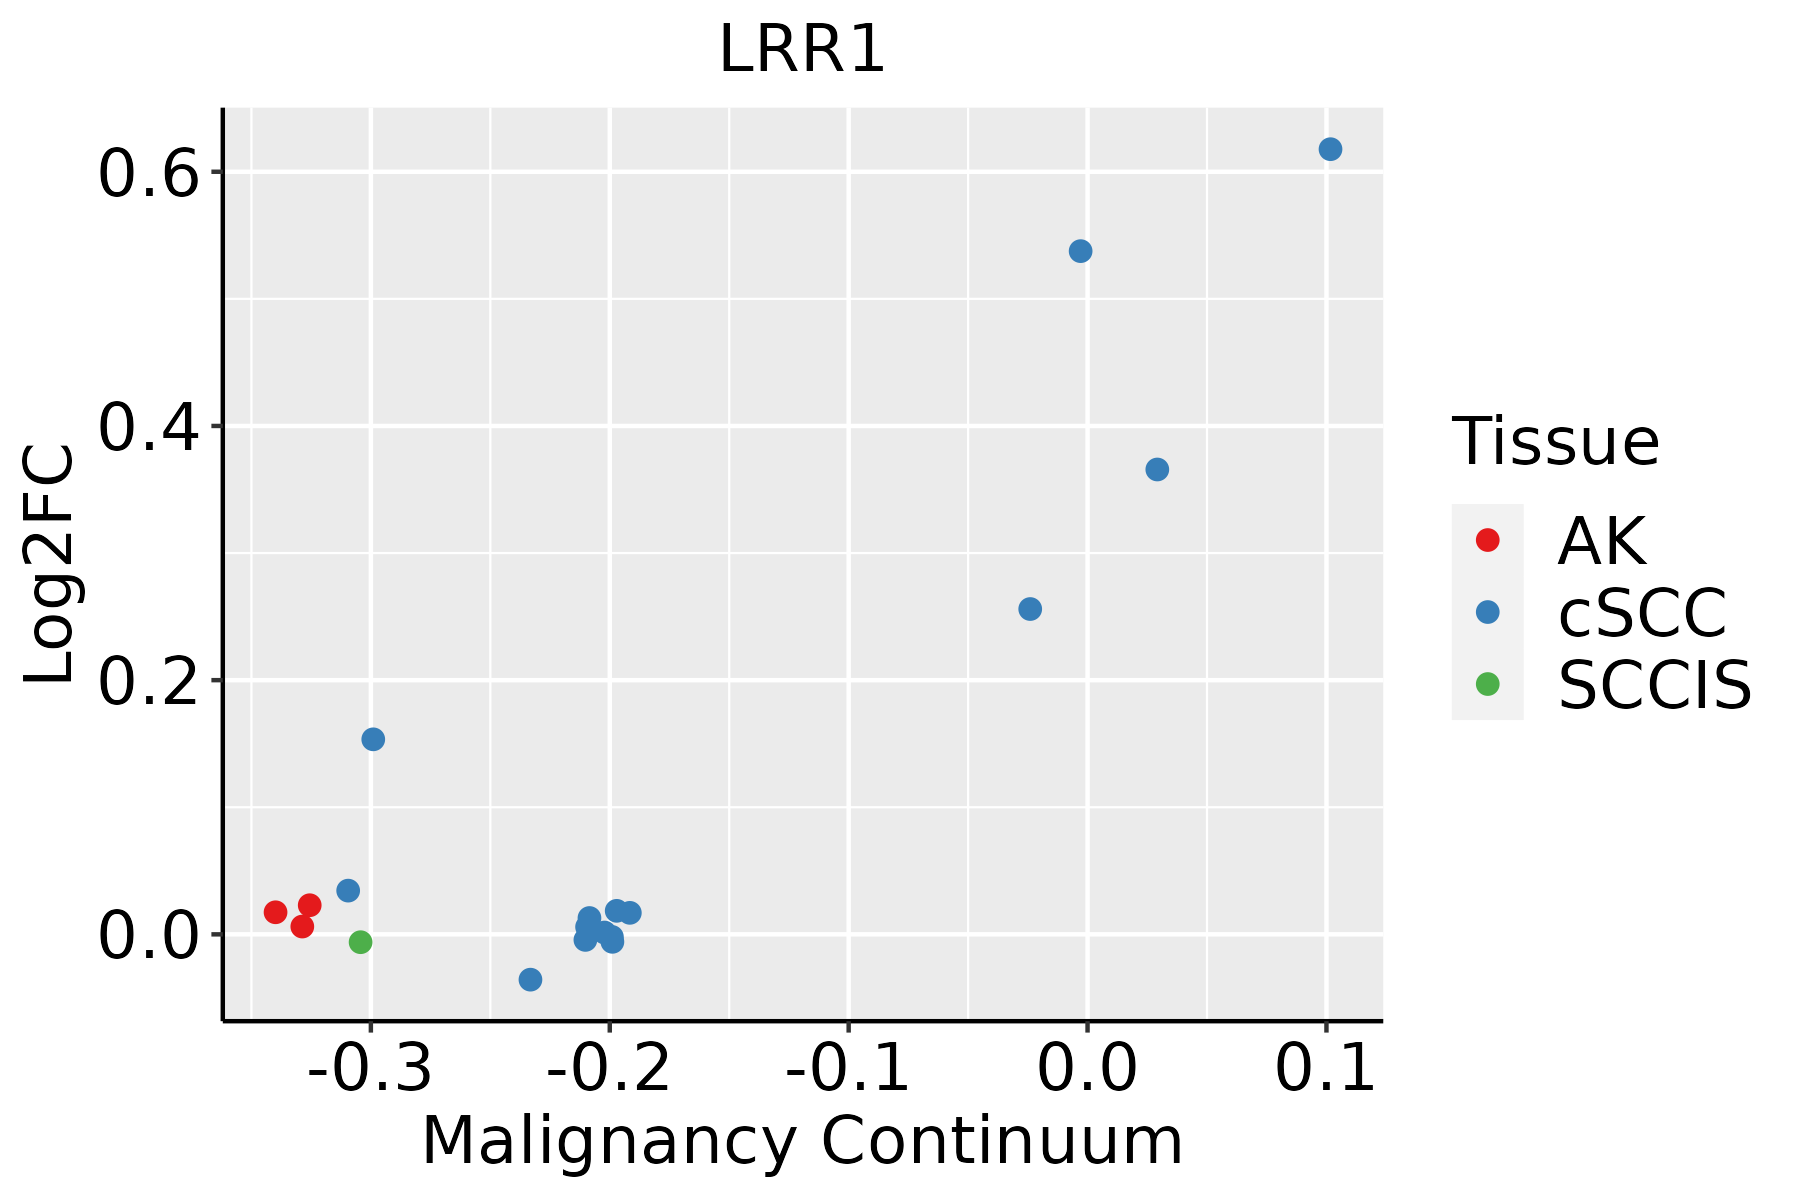 | AK: Actinic keratosis |
| cSCC: Cutaneous squamous cell carcinoma | ||
| SCCIS:squamous cell carcinoma in situ | ||
| Thyroid | 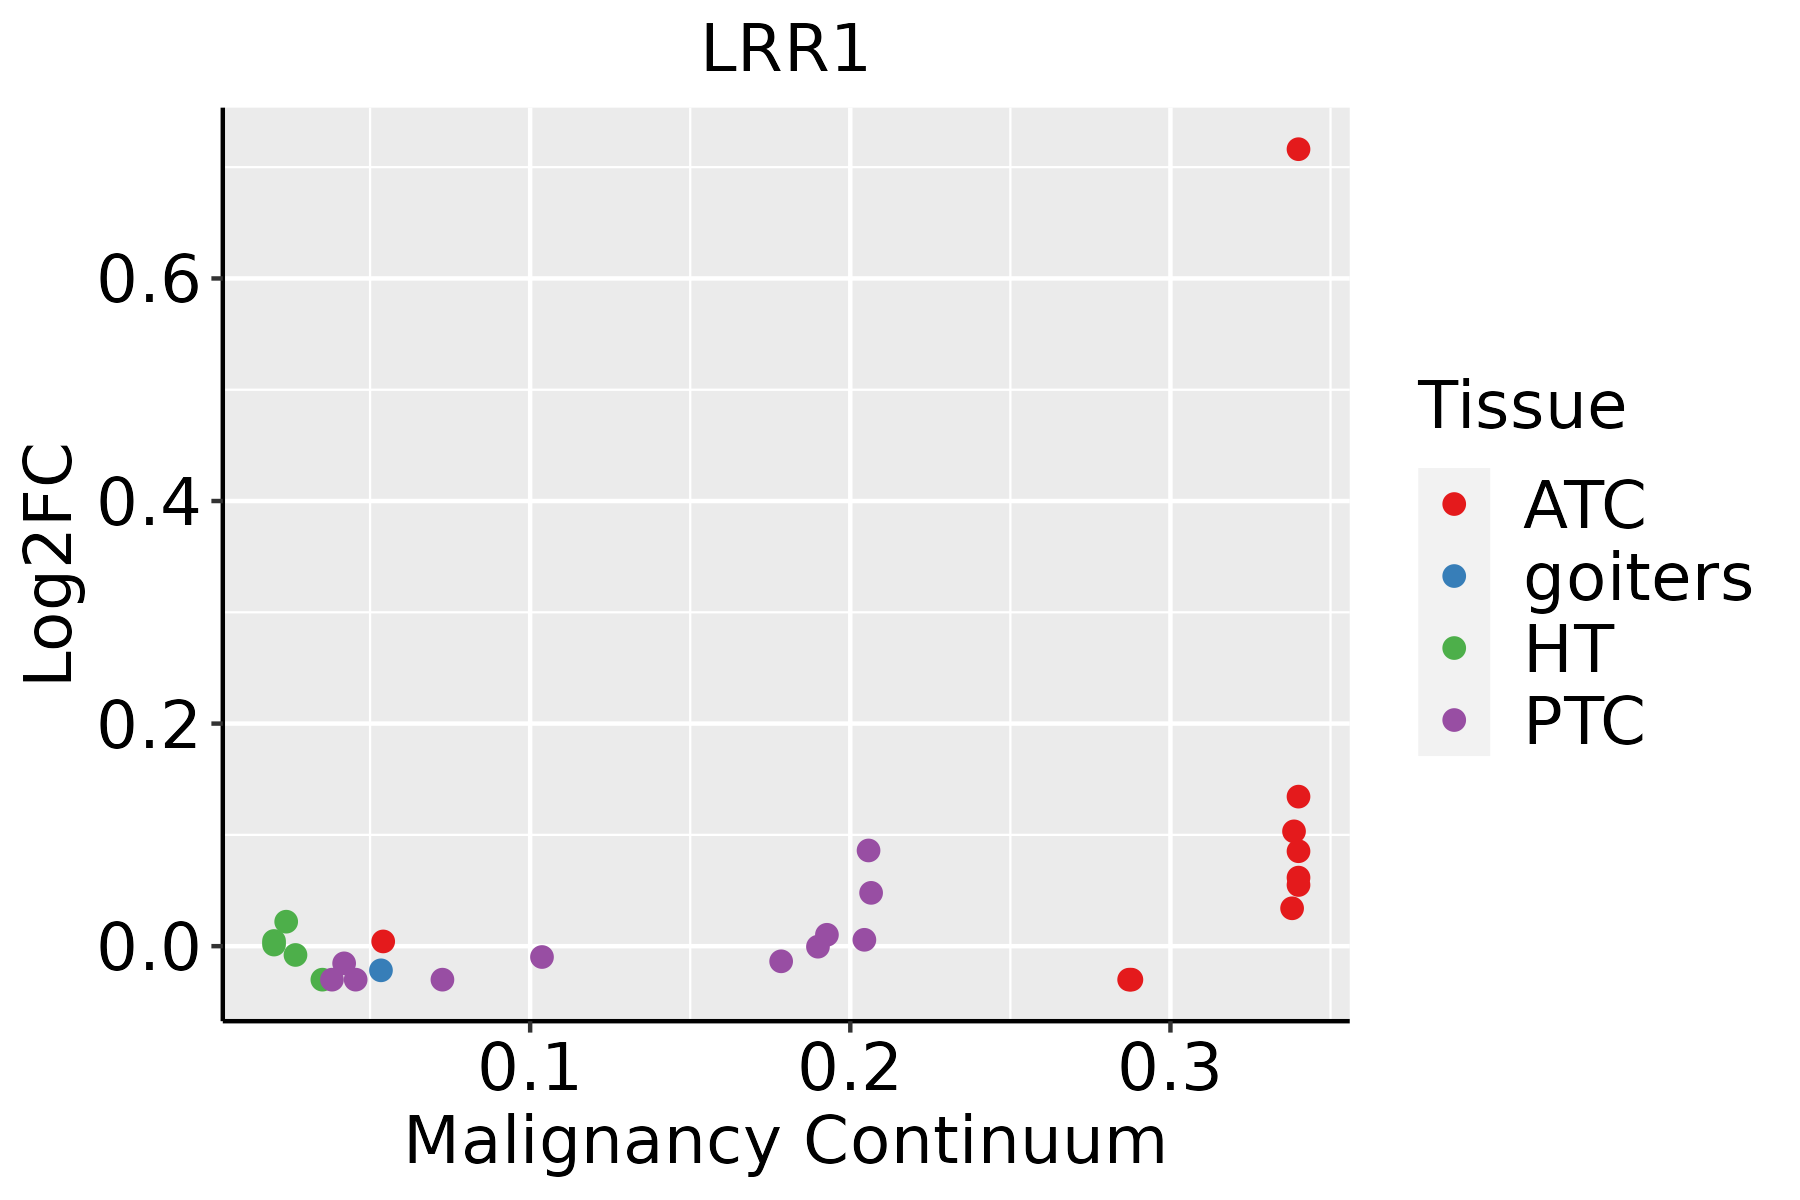 | ATC: Anaplastic thyroid cancer |
| HT: Hashimoto's thyroiditis | ||
| PTC: Papillary thyroid cancer |
| ∗log2FC in expression of this searched gene in stem-like cells from each diseased tissue sample relative to stem-like cells in normal samples in each tissue plotted against the malignancy continuum. Samples are colored based on if they are from different disease stage. |
Top |
Malignant transformation related pathway analysis |
| Find out the enriched GO biological processes and KEGG pathways involved in transition from healthy to precancer to cancer |
| Tissue | Disease Stage | Enriched GO biological Processes |
| Colorectum | AD |  |
| Colorectum | SER |  |
| Colorectum | MSS |  |
| Colorectum | MSI-H |  |
| Colorectum | FAP |  |
| ∗Top 15 enriched GO BP terms are showed in the bar plot of each disease state in each tissue. Each row represents a significant GO biological process which is colored according to the -log10(p.adjust). |
| Page: 1 2 3 4 5 6 7 8 9 |
| GO ID | Tissue | Disease Stage | Description | Gene Ratio | Bg Ratio | pvalue | p.adjust | Count |
| Page: 1 |
| Pathway ID | Tissue | Disease Stage | Description | Gene Ratio | Bg Ratio | pvalue | p.adjust | qvalue | Count |
| Page: 1 |
Top |
Cell-cell communication analysis |
| Identification of potential cell-cell interactions between two cell types and their ligand-receptor pairs for different disease states |
| Ligand | Receptor | LRpair | Pathway | Tissue | Disease Stage |
| Page: 1 |
Top |
Single-cell gene regulatory network inference analysis |
| Find out the significant the regulons (TFs) and the target genes of each regulon across cell types for different disease states |
| TF | Cell Type | Tissue | Disease Stage | Target Gene | RSS | Regulon Activity |
| ∗The dot plots of a searched regulon are shown for all cell subpopulations in each disease state of each tissue based on the regulon specific score inferred using pySCENIC and by calculating the average expression. |
| Page: 1 |
Top |
Somatic mutation of malignant transformation related genes |
| Annotation of somatic variants for genes involved in malignant transformation |
| Hugo Symbol | Variant Class | Variant Classification | dbSNP RS | HGVSc | HGVSp | HGVSp Short | SWISSPROT | BIOTYPE | SIFT | PolyPhen | Tumor Sample Barcode | Tissue | Histology | Sex | Age | Stage | Therapy Types | Drugs | Outcome |
| LRR1 | SNV | Missense_Mutation | novel | c.283N>A | p.Ala95Thr | p.A95T | Q96L50 | protein_coding | deleterious(0) | benign(0.417) | TCGA-AN-A046-01 | Breast | breast invasive carcinoma | Female | >=65 | I/II | Unknown | Unknown | SD |
| LRR1 | SNV | Missense_Mutation | c.775N>G | p.Asn259Asp | p.N259D | Q96L50 | protein_coding | deleterious(0) | probably_damaging(0.994) | TCGA-AN-A0AK-01 | Breast | breast invasive carcinoma | Female | >=65 | I/II | Unknown | Unknown | SD | |
| LRR1 | SNV | Missense_Mutation | rs777354325 | c.259N>T | p.Pro87Ser | p.P87S | Q96L50 | protein_coding | tolerated(0.1) | benign(0.049) | TCGA-BH-A1F8-01 | Breast | breast invasive carcinoma | Female | >=65 | III/IV | Unknown | Unknown | PD |
| LRR1 | SNV | Missense_Mutation | novel | c.155N>C | p.Leu52Pro | p.L52P | Q96L50 | protein_coding | tolerated(0.24) | benign(0.276) | TCGA-D8-A1XK-01 | Breast | breast invasive carcinoma | Female | <65 | I/II | Chemotherapy | doxorubicine+cyclophosphamide | SD |
| LRR1 | SNV | Missense_Mutation | c.464N>G | p.Ser155Cys | p.S155C | Q96L50 | protein_coding | deleterious(0) | possibly_damaging(0.594) | TCGA-JX-A3Q0-01 | Cervix | cervical & endocervical cancer | Female | <65 | III/IV | Unknown | Unknown | SD | |
| LRR1 | SNV | Missense_Mutation | novel | c.997N>A | p.His333Asn | p.H333N | Q96L50 | protein_coding | tolerated(0.79) | benign(0) | TCGA-5M-AAT6-01 | Colorectum | colon adenocarcinoma | Female | <65 | III/IV | Unknown | Unknown | PD |
| LRR1 | SNV | Missense_Mutation | rs777495090 | c.514C>T | p.Arg172Cys | p.R172C | Q96L50 | protein_coding | deleterious(0) | probably_damaging(0.997) | TCGA-A6-2671-01 | Colorectum | colon adenocarcinoma | Male | >=65 | III/IV | Other, specify in notesProtocol AMG 20060464 | study | PD |
| LRR1 | SNV | Missense_Mutation | c.737G>A | p.Cys246Tyr | p.C246Y | Q96L50 | protein_coding | deleterious(0) | probably_damaging(0.996) | TCGA-AA-A01P-01 | Colorectum | colon adenocarcinoma | Female | >=65 | III/IV | Unknown | Unknown | PD | |
| LRR1 | SNV | Missense_Mutation | rs777495090 | c.514N>T | p.Arg172Cys | p.R172C | Q96L50 | protein_coding | deleterious(0) | probably_damaging(0.997) | TCGA-CK-5916-01 | Colorectum | colon adenocarcinoma | Female | >=65 | I/II | Unknown | Unknown | PD |
| LRR1 | SNV | Missense_Mutation | novel | c.901N>A | p.Leu301Ile | p.L301I | Q96L50 | protein_coding | deleterious(0.01) | probably_damaging(0.991) | TCGA-F5-6814-01 | Colorectum | rectum adenocarcinoma | Male | <65 | I/II | Unknown | Unknown | SD |
| Page: 1 2 3 4 |
Top |
Related drugs of malignant transformation related genes |
| Identification of chemicals and drugs interact with genes involved in malignant transfromation |
| (DGIdb 4.0) |
| Entrez ID | Symbol | Category | Interaction Types | Drug Claim Name | Drug Name | PMIDs |
| Page: 1 |

Copyright 2023-Present -The University of Texas Health Science Center at Houston |