| Tissue | Expression Dynamics | Abbreviation |
| Cervix | 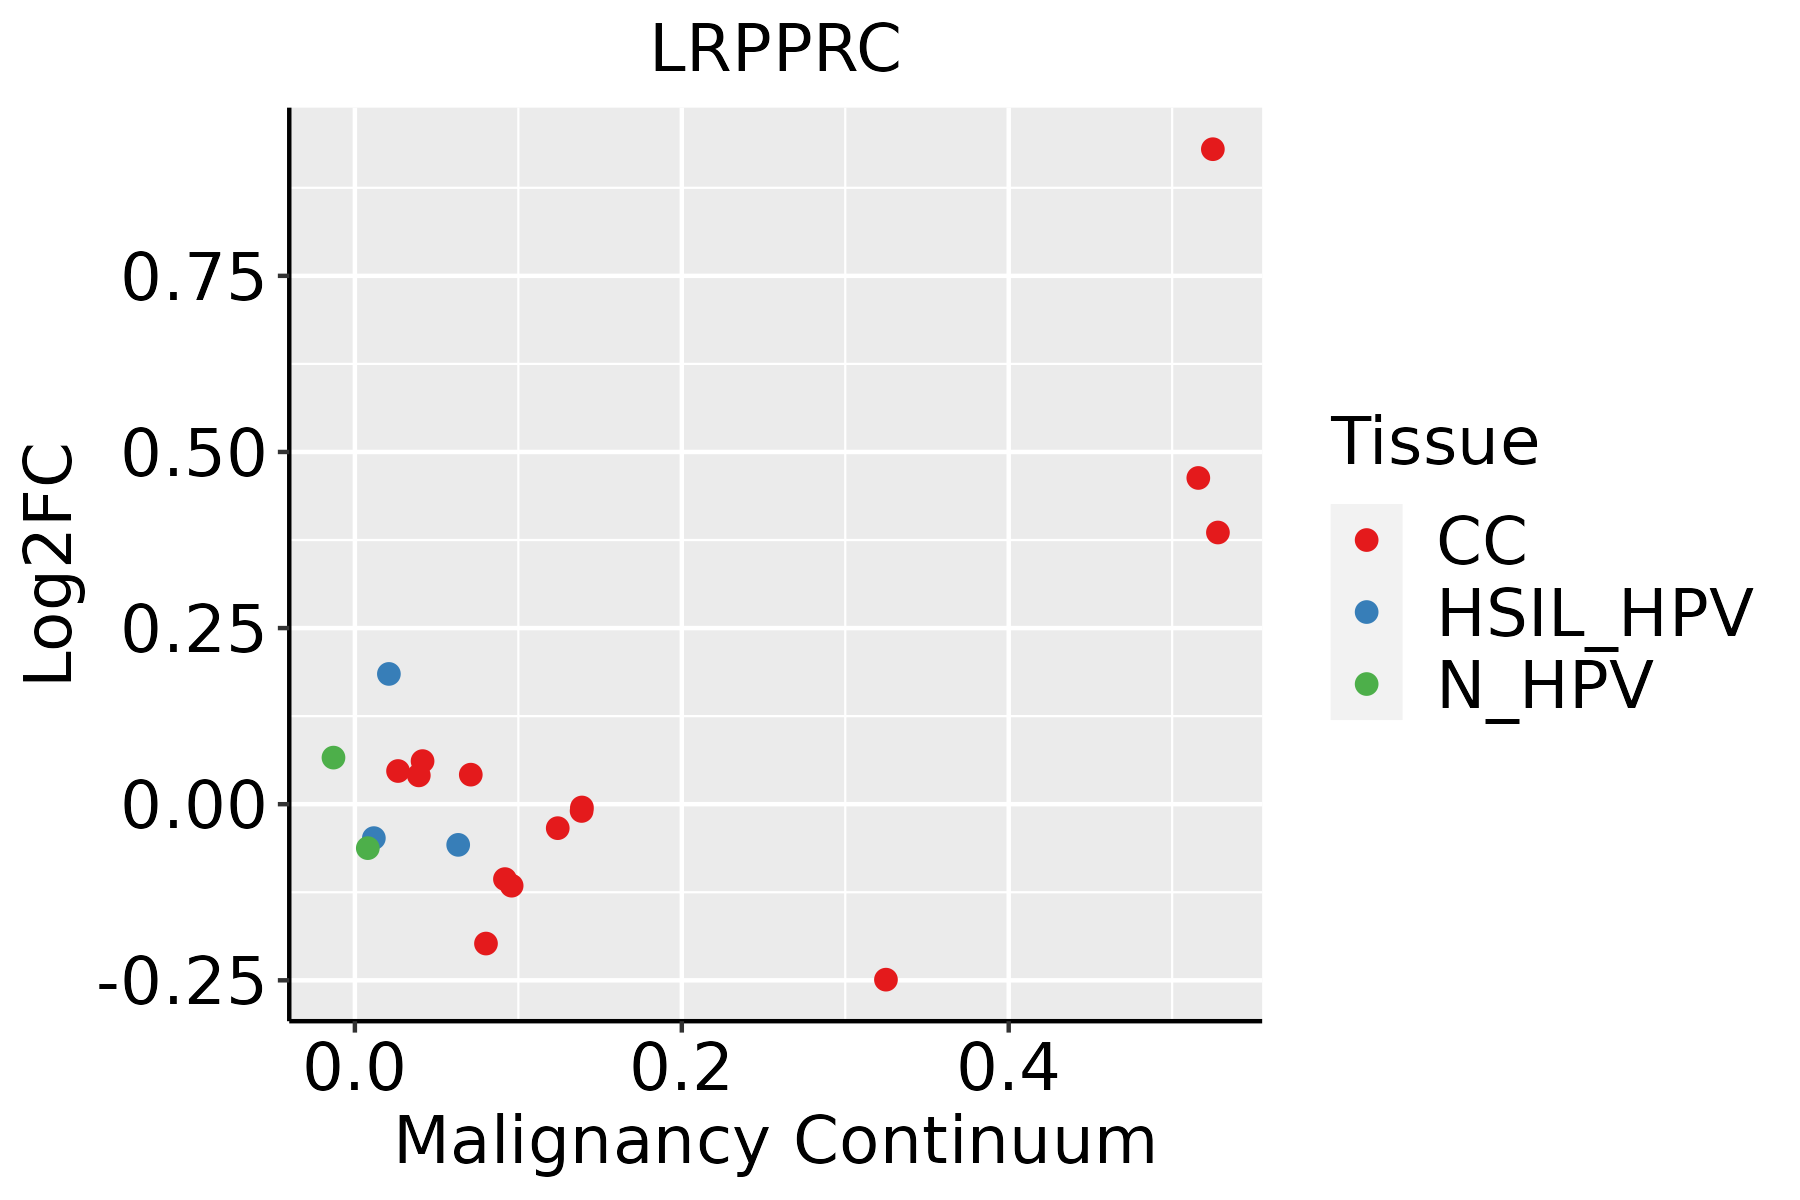 | CC: Cervix cancer |
| HSIL_HPV: HPV-infected high-grade squamous intraepithelial lesions |
| N_HPV: HPV-infected normal cervix |
| Colorectum (GSE201348) |  | FAP: Familial adenomatous polyposis |
| CRC: Colorectal cancer |
| Colorectum (HTA11) |  | AD: Adenomas |
| SER: Sessile serrated lesions |
| MSI-H: Microsatellite-high colorectal cancer |
| MSS: Microsatellite stable colorectal cancer |
| Esophagus | 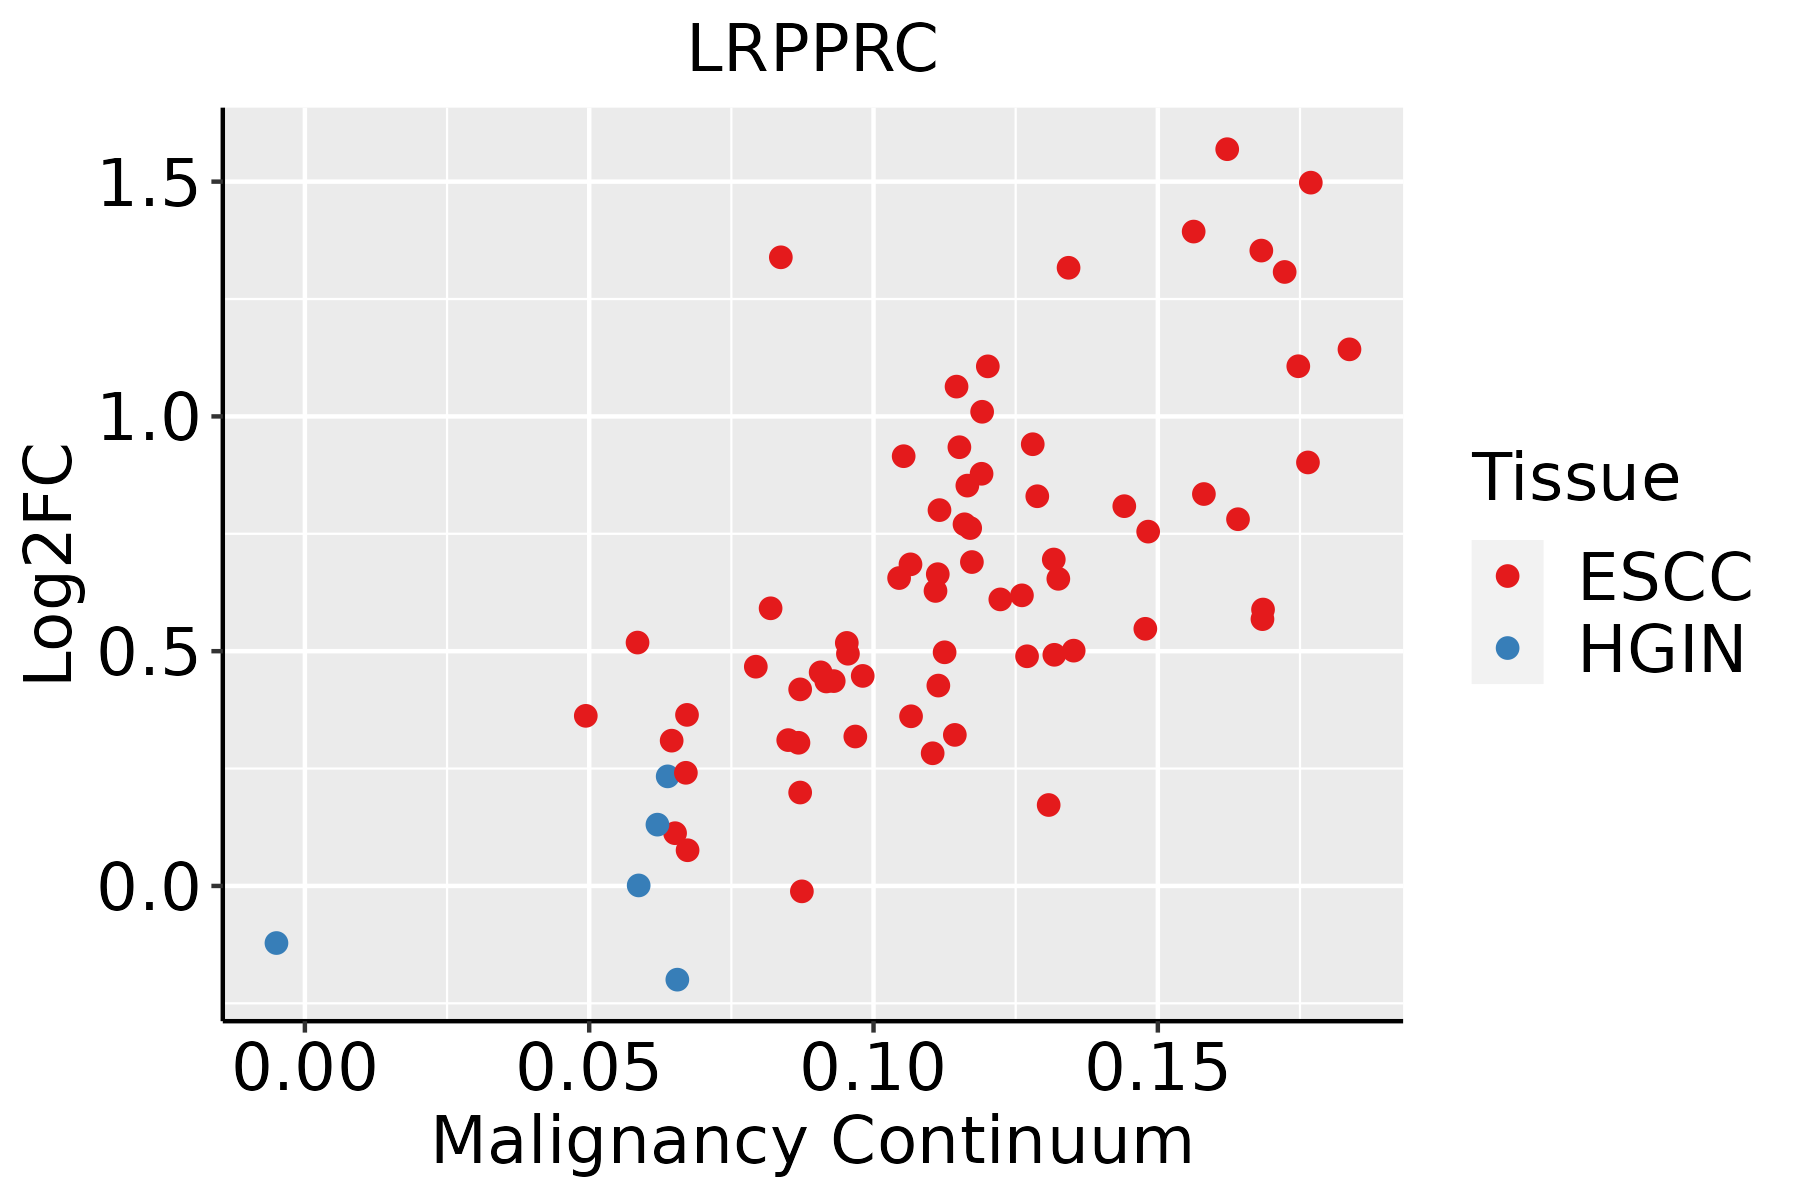 | ESCC: Esophageal squamous cell carcinoma |
| HGIN: High-grade intraepithelial neoplasias |
| LGIN: Low-grade intraepithelial neoplasias |
| Liver |  | HCC: Hepatocellular carcinoma |
| NAFLD: Non-alcoholic fatty liver disease |
| Oral Cavity | 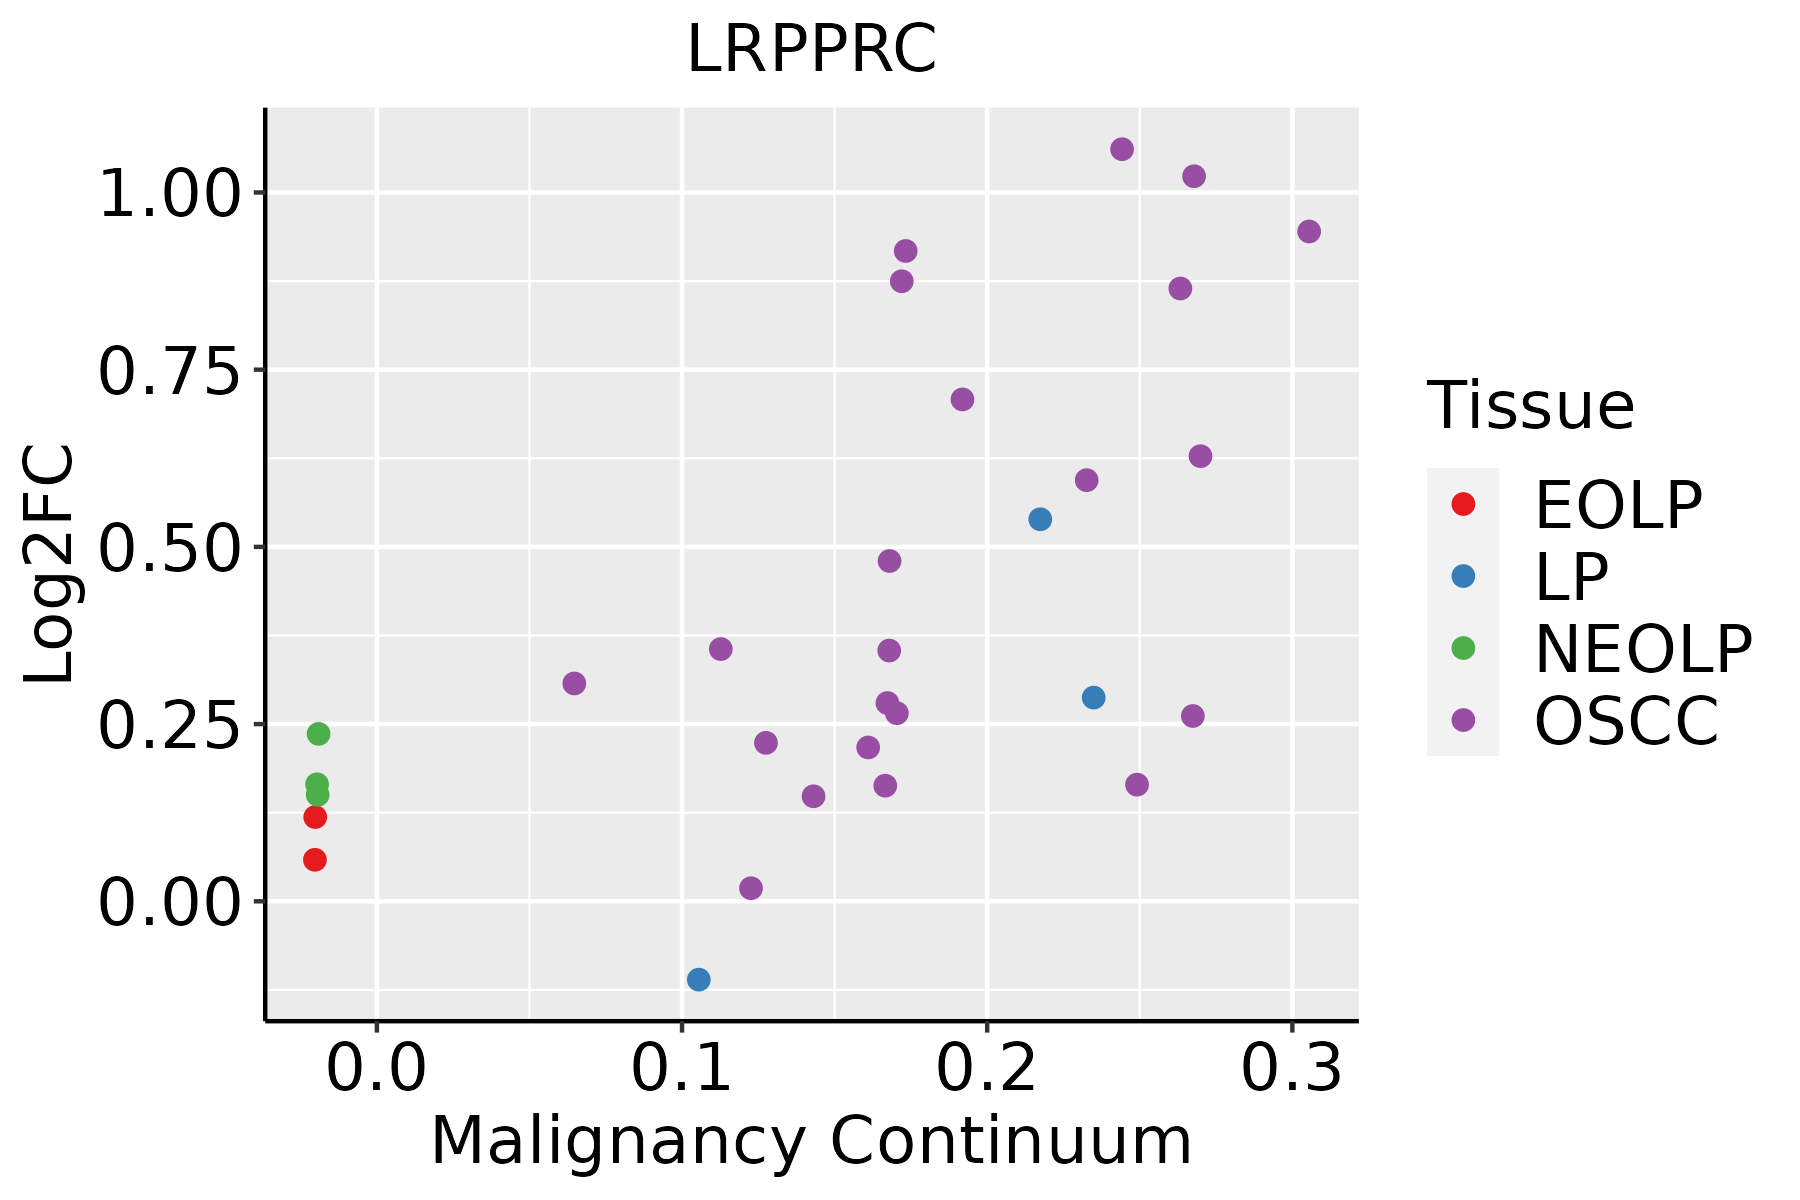 | EOLP: Erosive Oral lichen planus |
| LP: leukoplakia |
| NEOLP: Non-erosive oral lichen planus |
| OSCC: Oral squamous cell carcinoma |
| Prostate | 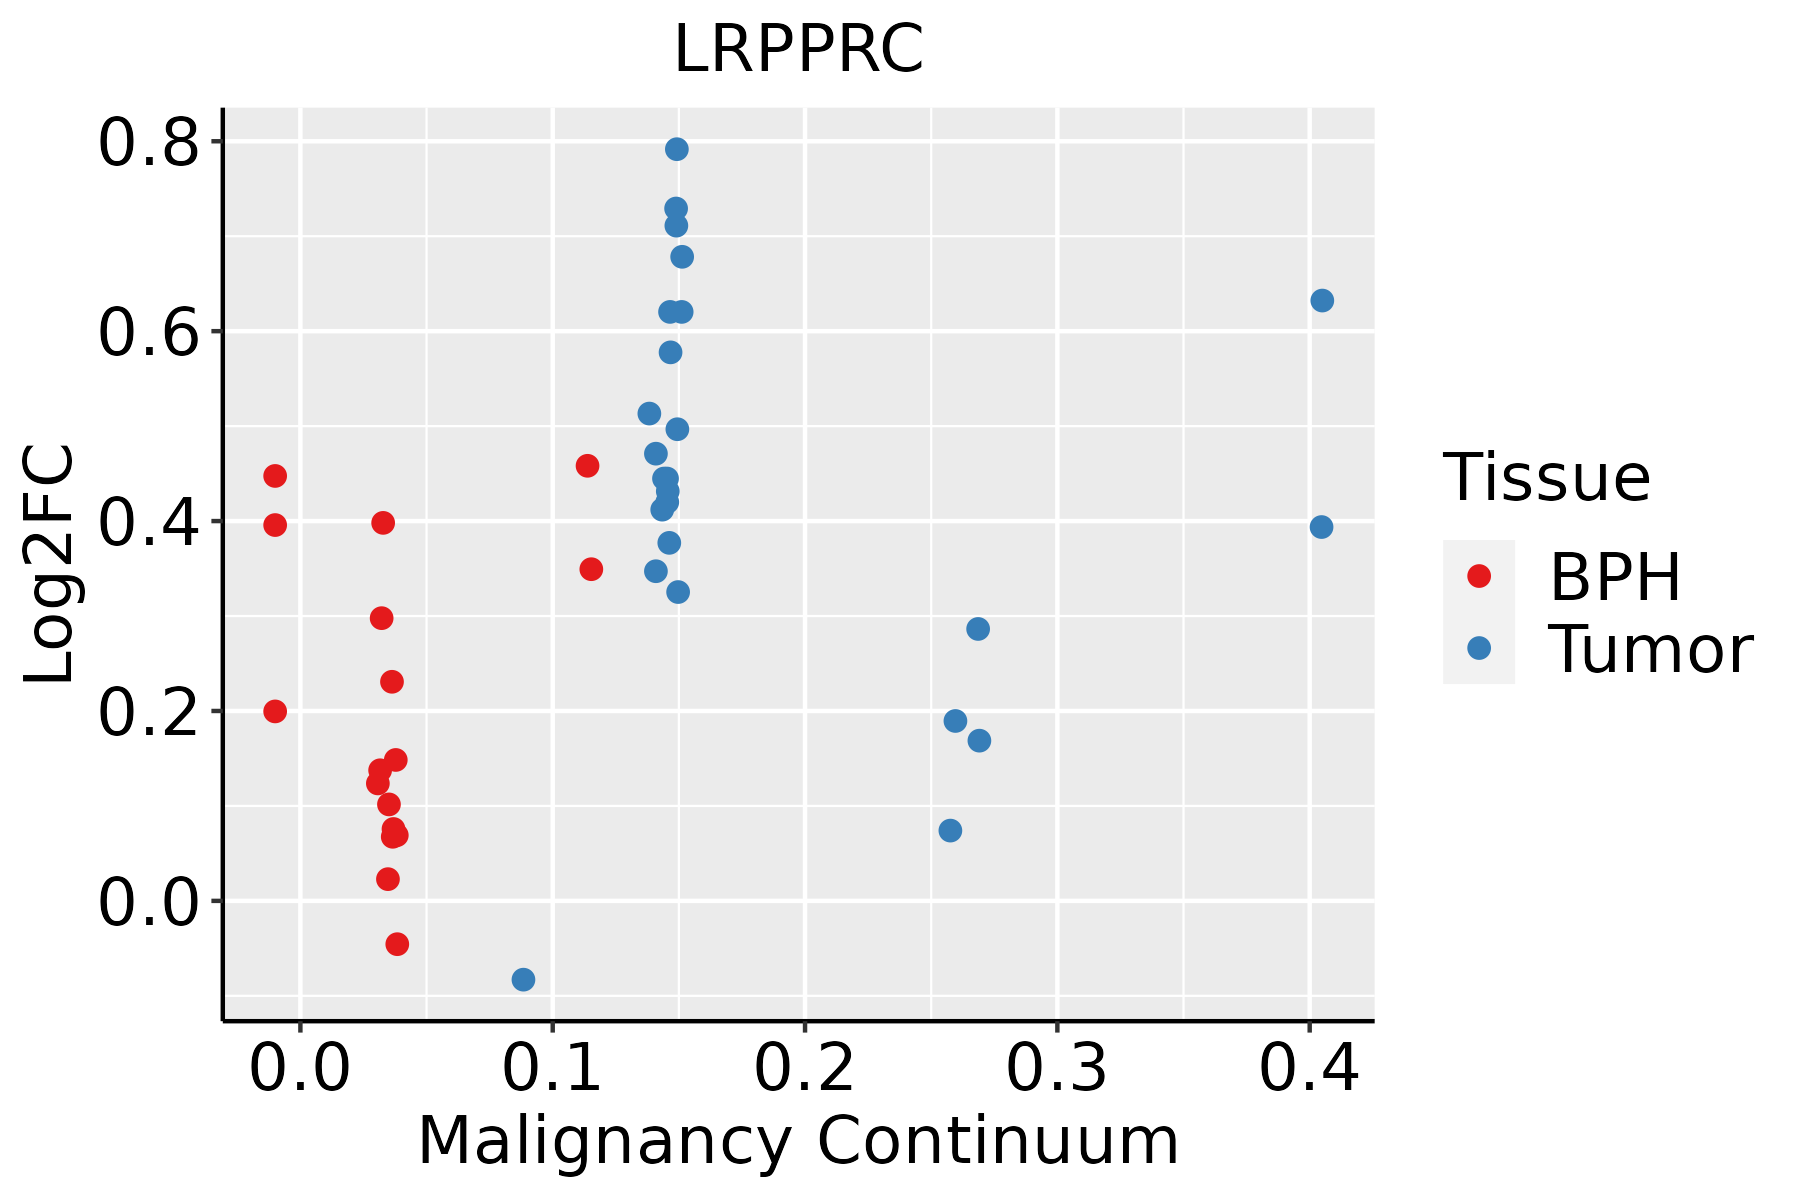 | BPH: Benign Prostatic Hyperplasia |
| Skin |  | AK: Actinic keratosis |
| cSCC: Cutaneous squamous cell carcinoma |
| SCCIS:squamous cell carcinoma in situ |
| Thyroid |  | ATC: Anaplastic thyroid cancer |
| HT: Hashimoto's thyroiditis |
| PTC: Papillary thyroid cancer |
| GO ID | Tissue | Disease Stage | Description | Gene Ratio | Bg Ratio | pvalue | p.adjust | Count |
| GO:003133010 | Cervix | CC | negative regulation of cellular catabolic process | 63/2311 | 262/18723 | 1.10e-07 | 5.68e-06 | 63 |
| GO:000989510 | Cervix | CC | negative regulation of catabolic process | 69/2311 | 320/18723 | 2.15e-06 | 6.55e-05 | 69 |
| GO:00064019 | Cervix | CC | RNA catabolic process | 62/2311 | 278/18723 | 2.18e-06 | 6.56e-05 | 62 |
| GO:000641710 | Cervix | CC | regulation of translation | 89/2311 | 468/18723 | 1.86e-05 | 3.46e-04 | 89 |
| GO:00516567 | Cervix | CC | establishment of organelle localization | 76/2311 | 390/18723 | 3.17e-05 | 5.21e-04 | 76 |
| GO:00512368 | Cervix | CC | establishment of RNA localization | 39/2311 | 166/18723 | 4.76e-05 | 7.25e-04 | 39 |
| GO:00506578 | Cervix | CC | nucleic acid transport | 38/2311 | 163/18723 | 7.06e-05 | 9.85e-04 | 38 |
| GO:00506588 | Cervix | CC | RNA transport | 38/2311 | 163/18723 | 7.06e-05 | 9.85e-04 | 38 |
| GO:000640310 | Cervix | CC | RNA localization | 43/2311 | 201/18723 | 2.00e-04 | 2.29e-03 | 43 |
| GO:00510284 | Cervix | CC | mRNA transport | 31/2311 | 130/18723 | 2.05e-04 | 2.33e-03 | 31 |
| GO:00467008 | Cervix | CC | heterocycle catabolic process | 80/2311 | 445/18723 | 3.23e-04 | 3.42e-03 | 80 |
| GO:00346559 | Cervix | CC | nucleobase-containing compound catabolic process | 74/2311 | 407/18723 | 3.77e-04 | 3.88e-03 | 74 |
| GO:00442709 | Cervix | CC | cellular nitrogen compound catabolic process | 79/2311 | 451/18723 | 7.80e-04 | 6.91e-03 | 79 |
| GO:00307057 | Cervix | CC | cytoskeleton-dependent intracellular transport | 40/2311 | 195/18723 | 7.92e-04 | 6.99e-03 | 40 |
| GO:19023698 | Cervix | CC | negative regulation of RNA catabolic process | 19/2311 | 75/18723 | 1.54e-03 | 1.19e-02 | 19 |
| GO:00159318 | Cervix | CC | nucleobase-containing compound transport | 43/2311 | 222/18723 | 1.72e-03 | 1.30e-02 | 43 |
| GO:00516541 | Cervix | CC | establishment of mitochondrion localization | 10/2311 | 29/18723 | 1.74e-03 | 1.31e-02 | 10 |
| GO:00194398 | Cervix | CC | aromatic compound catabolic process | 79/2311 | 467/18723 | 2.14e-03 | 1.54e-02 | 79 |
| GO:00516461 | Cervix | CC | mitochondrion localization | 13/2311 | 50/18723 | 6.42e-03 | 3.58e-02 | 13 |
| GO:19013618 | Cervix | CC | organic cyclic compound catabolic process | 80/2311 | 495/18723 | 6.77e-03 | 3.72e-02 | 80 |
| Hugo Symbol | Variant Class | Variant Classification | dbSNP RS | HGVSc | HGVSp | HGVSp Short | SWISSPROT | BIOTYPE | SIFT | PolyPhen | Tumor Sample Barcode | Tissue | Histology | Sex | Age | Stage | Therapy Types | Drugs | Outcome |
| LRPPRC | SNV | Missense_Mutation | | c.2065N>T | p.Leu689Phe | p.L689F | P42704 | protein_coding | deleterious(0.01) | probably_damaging(0.976) | TCGA-A2-A0EV-01 | Breast | breast invasive carcinoma | Female | >=65 | I/II | Unknown | Unknown | SD |
| LRPPRC | SNV | Missense_Mutation | | c.2881N>G | p.Leu961Val | p.L961V | P42704 | protein_coding | deleterious(0.03) | benign(0.291) | TCGA-AC-A23H-01 | Breast | breast invasive carcinoma | Female | >=65 | I/II | Unknown | Unknown | PD |
| LRPPRC | SNV | Missense_Mutation | novel | c.3668N>A | p.Arg1223Lys | p.R1223K | P42704 | protein_coding | tolerated(0.05) | benign(0.232) | TCGA-AC-A8OQ-01 | Breast | breast invasive carcinoma | Female | >=65 | I/II | Unknown | Unknown | SD |
| LRPPRC | SNV | Missense_Mutation | | c.4181N>A | p.Ser1394Tyr | p.S1394Y | P42704 | protein_coding | deleterious_low_confidence(0) | benign(0.005) | TCGA-AN-A046-01 | Breast | breast invasive carcinoma | Female | >=65 | I/II | Unknown | Unknown | SD |
| LRPPRC | SNV | Missense_Mutation | novel | c.656N>G | p.Ile219Ser | p.I219S | P42704 | protein_coding | deleterious(0) | probably_damaging(0.974) | TCGA-AN-A046-01 | Breast | breast invasive carcinoma | Female | >=65 | I/II | Unknown | Unknown | SD |
| LRPPRC | SNV | Missense_Mutation | novel | c.244N>A | p.Gln82Lys | p.Q82K | P42704 | protein_coding | deleterious(0.01) | benign(0.054) | TCGA-AN-A046-01 | Breast | breast invasive carcinoma | Female | >=65 | I/II | Unknown | Unknown | SD |
| LRPPRC | SNV | Missense_Mutation | | c.4157T>C | p.Leu1386Pro | p.L1386P | P42704 | protein_coding | deleterious(0) | benign(0.424) | TCGA-AO-A1KO-01 | Breast | breast invasive carcinoma | Female | <65 | I/II | Chemotherapy | paclitaxel | SD |
| LRPPRC | SNV | Missense_Mutation | | c.1733N>T | p.Thr578Met | p.T578M | P42704 | protein_coding | deleterious(0.02) | possibly_damaging(0.732) | TCGA-BH-A0HX-01 | Breast | breast invasive carcinoma | Female | <65 | I/II | Chemotherapy | adrimycin | SD |
| LRPPRC | SNV | Missense_Mutation | | c.778G>C | p.Asp260His | p.D260H | P42704 | protein_coding | tolerated(0.06) | benign(0.29) | TCGA-BH-A18P-01 | Breast | breast invasive carcinoma | Female | <65 | I/II | Unknown | Unknown | PD |
| LRPPRC | SNV | Missense_Mutation | novel | c.2734N>A | p.Glu912Lys | p.E912K | P42704 | protein_coding | deleterious(0) | probably_damaging(0.996) | TCGA-BH-A2L8-01 | Breast | breast invasive carcinoma | Female | <65 | I/II | Chemotherapy | cytoxan | CR |


