
|
|||||
|
 | |
| |
| |
| |
| |
| |
|
Gene: LRP4 |
Gene summary for LRP4 |
| Gene information | Species | Human | Gene symbol | LRP4 | Gene ID | 4038 |
| Gene name | LDL receptor related protein 4 | |
| Gene Alias | CLSS | |
| Cytomap | 11p11.2 | |
| Gene Type | protein-coding | GO ID | GO:0000902 | UniProtAcc | O75096 |
Top |
Malignant transformation analysis |
| Identification of the aberrant gene expression in precancerous and cancerous lesions by comparing the gene expression of stem-like cells in diseased tissues with normal stem cells |
| Entrez ID | Symbol | Replicates | Species | Organ | Tissue | Adj P-value | Log2FC | Malignancy |
| 4038 | LRP4 | HTA11_3410_2000001011 | Human | Colorectum | AD | 6.55e-07 | 5.45e-01 | 0.0155 |
| 4038 | LRP4 | HTA11_866_3004761011 | Human | Colorectum | AD | 1.32e-03 | 4.14e-01 | 0.096 |
| 4038 | LRP4 | HTA11_7696_3000711011 | Human | Colorectum | AD | 1.12e-26 | 1.35e+00 | 0.0674 |
| 4038 | LRP4 | HTA11_6818_2000001021 | Human | Colorectum | AD | 2.33e-02 | 5.97e-01 | 0.0588 |
| 4038 | LRP4 | HTA11_99999970781_79442 | Human | Colorectum | MSS | 7.12e-28 | 1.07e+00 | 0.294 |
| 4038 | LRP4 | HTA11_99999971662_82457 | Human | Colorectum | MSS | 1.30e-11 | 1.26e+00 | 0.3859 |
| 4038 | LRP4 | A015-C-203 | Human | Colorectum | FAP | 1.56e-09 | -3.07e-03 | -0.1294 |
| 4038 | LRP4 | A001-C-119 | Human | Colorectum | FAP | 8.94e-43 | 1.21e+00 | -0.1557 |
| 4038 | LRP4 | A001-C-108 | Human | Colorectum | FAP | 8.30e-10 | 3.79e-01 | -0.0272 |
| 4038 | LRP4 | A002-C-021 | Human | Colorectum | FAP | 3.50e-04 | 4.88e-01 | 0.1171 |
| 4038 | LRP4 | A002-C-205 | Human | Colorectum | FAP | 5.06e-09 | 2.48e-01 | -0.1236 |
| 4038 | LRP4 | A001-C-104 | Human | Colorectum | FAP | 6.65e-09 | 4.93e-01 | 0.0184 |
| 4038 | LRP4 | A015-C-006 | Human | Colorectum | FAP | 4.96e-17 | 6.73e-01 | -0.0994 |
| 4038 | LRP4 | A015-C-106 | Human | Colorectum | FAP | 3.92e-06 | 2.41e-01 | -0.0511 |
| 4038 | LRP4 | A002-C-114 | Human | Colorectum | FAP | 2.65e-04 | 1.36e-01 | -0.1561 |
| 4038 | LRP4 | A015-C-104 | Human | Colorectum | FAP | 3.16e-13 | 5.19e-02 | -0.1899 |
| 4038 | LRP4 | A001-C-014 | Human | Colorectum | FAP | 4.45e-09 | 4.29e-01 | 0.0135 |
| 4038 | LRP4 | A002-C-016 | Human | Colorectum | FAP | 4.89e-08 | 1.58e-01 | 0.0521 |
| 4038 | LRP4 | A015-C-002 | Human | Colorectum | FAP | 4.37e-03 | 1.63e-01 | -0.0763 |
| 4038 | LRP4 | A001-C-203 | Human | Colorectum | FAP | 1.78e-05 | 3.18e-01 | -0.0481 |
| Page: 1 2 |
| Tissue | Expression Dynamics | Abbreviation |
| Colorectum (GSE201348) | 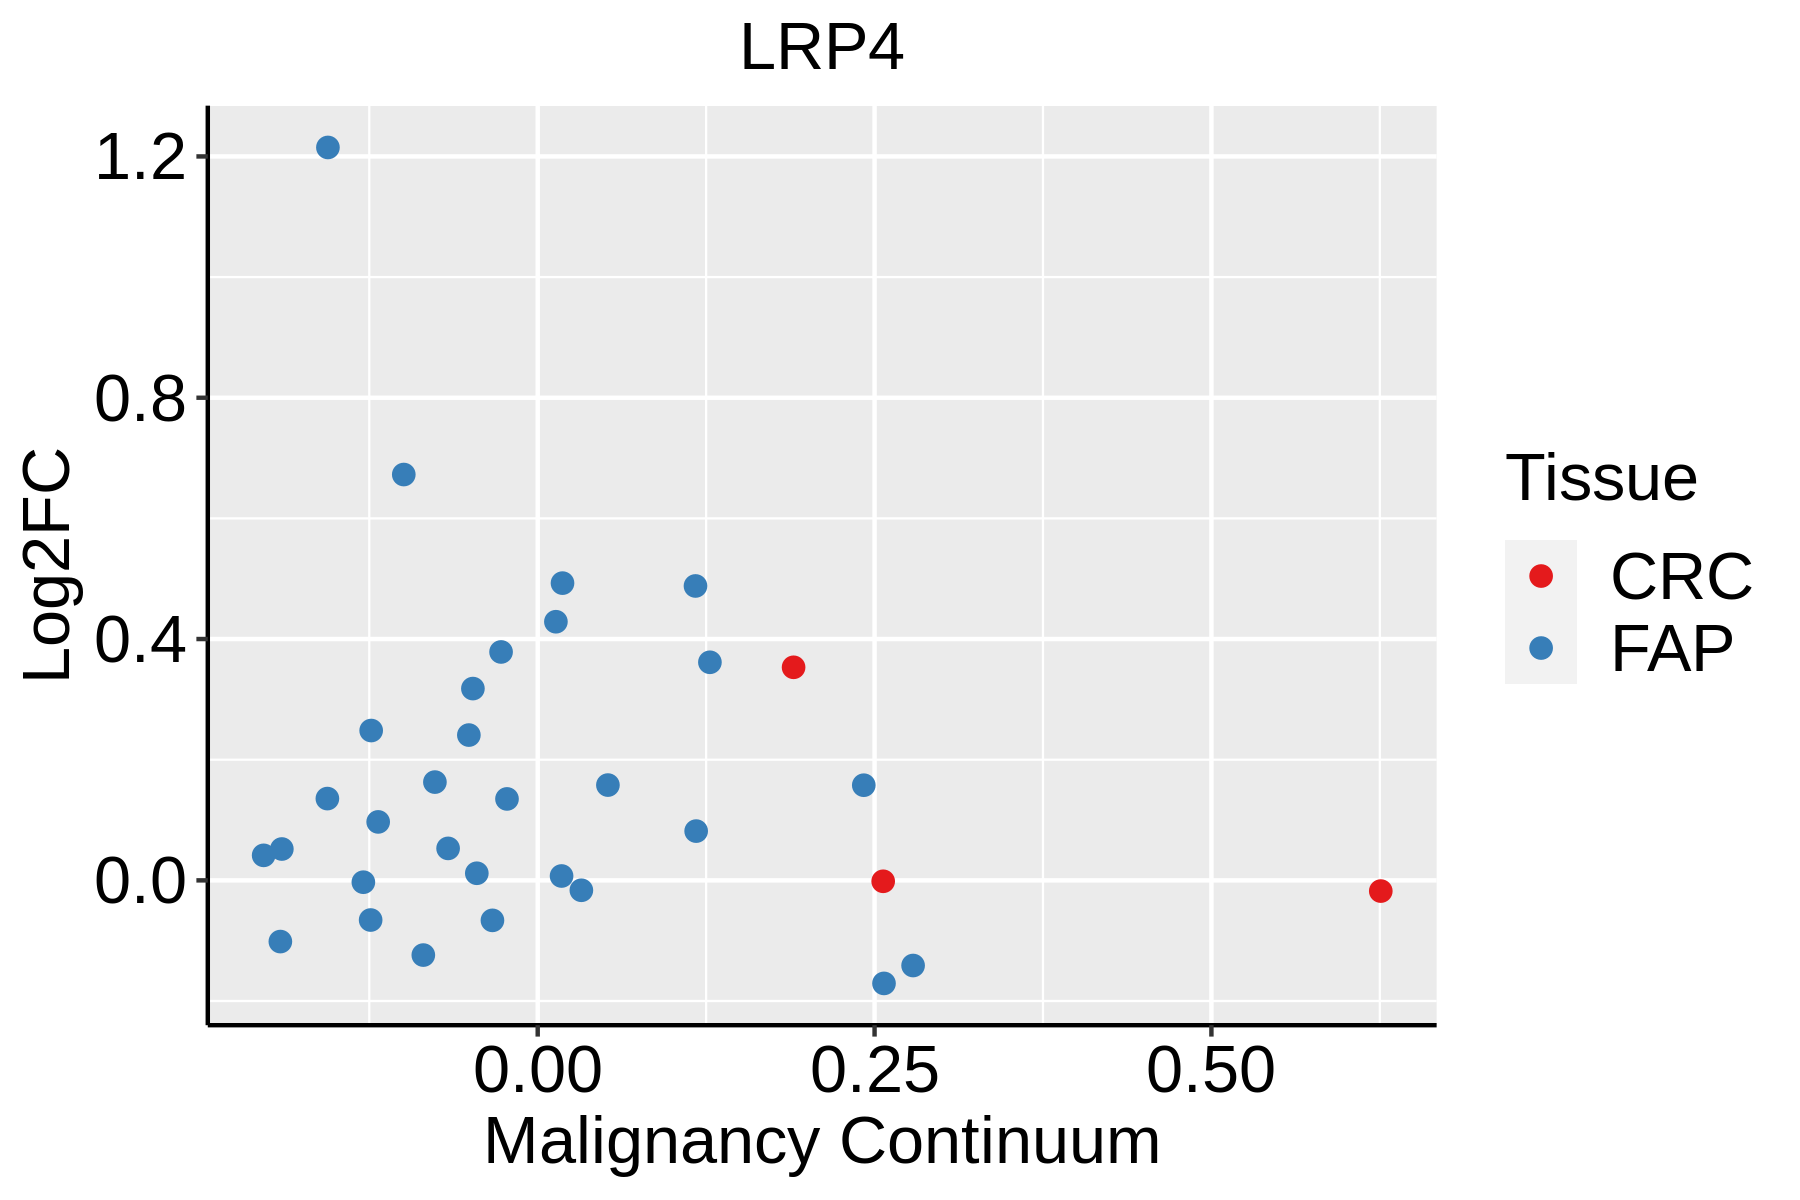 | FAP: Familial adenomatous polyposis |
| CRC: Colorectal cancer | ||
| Colorectum (HTA11) | 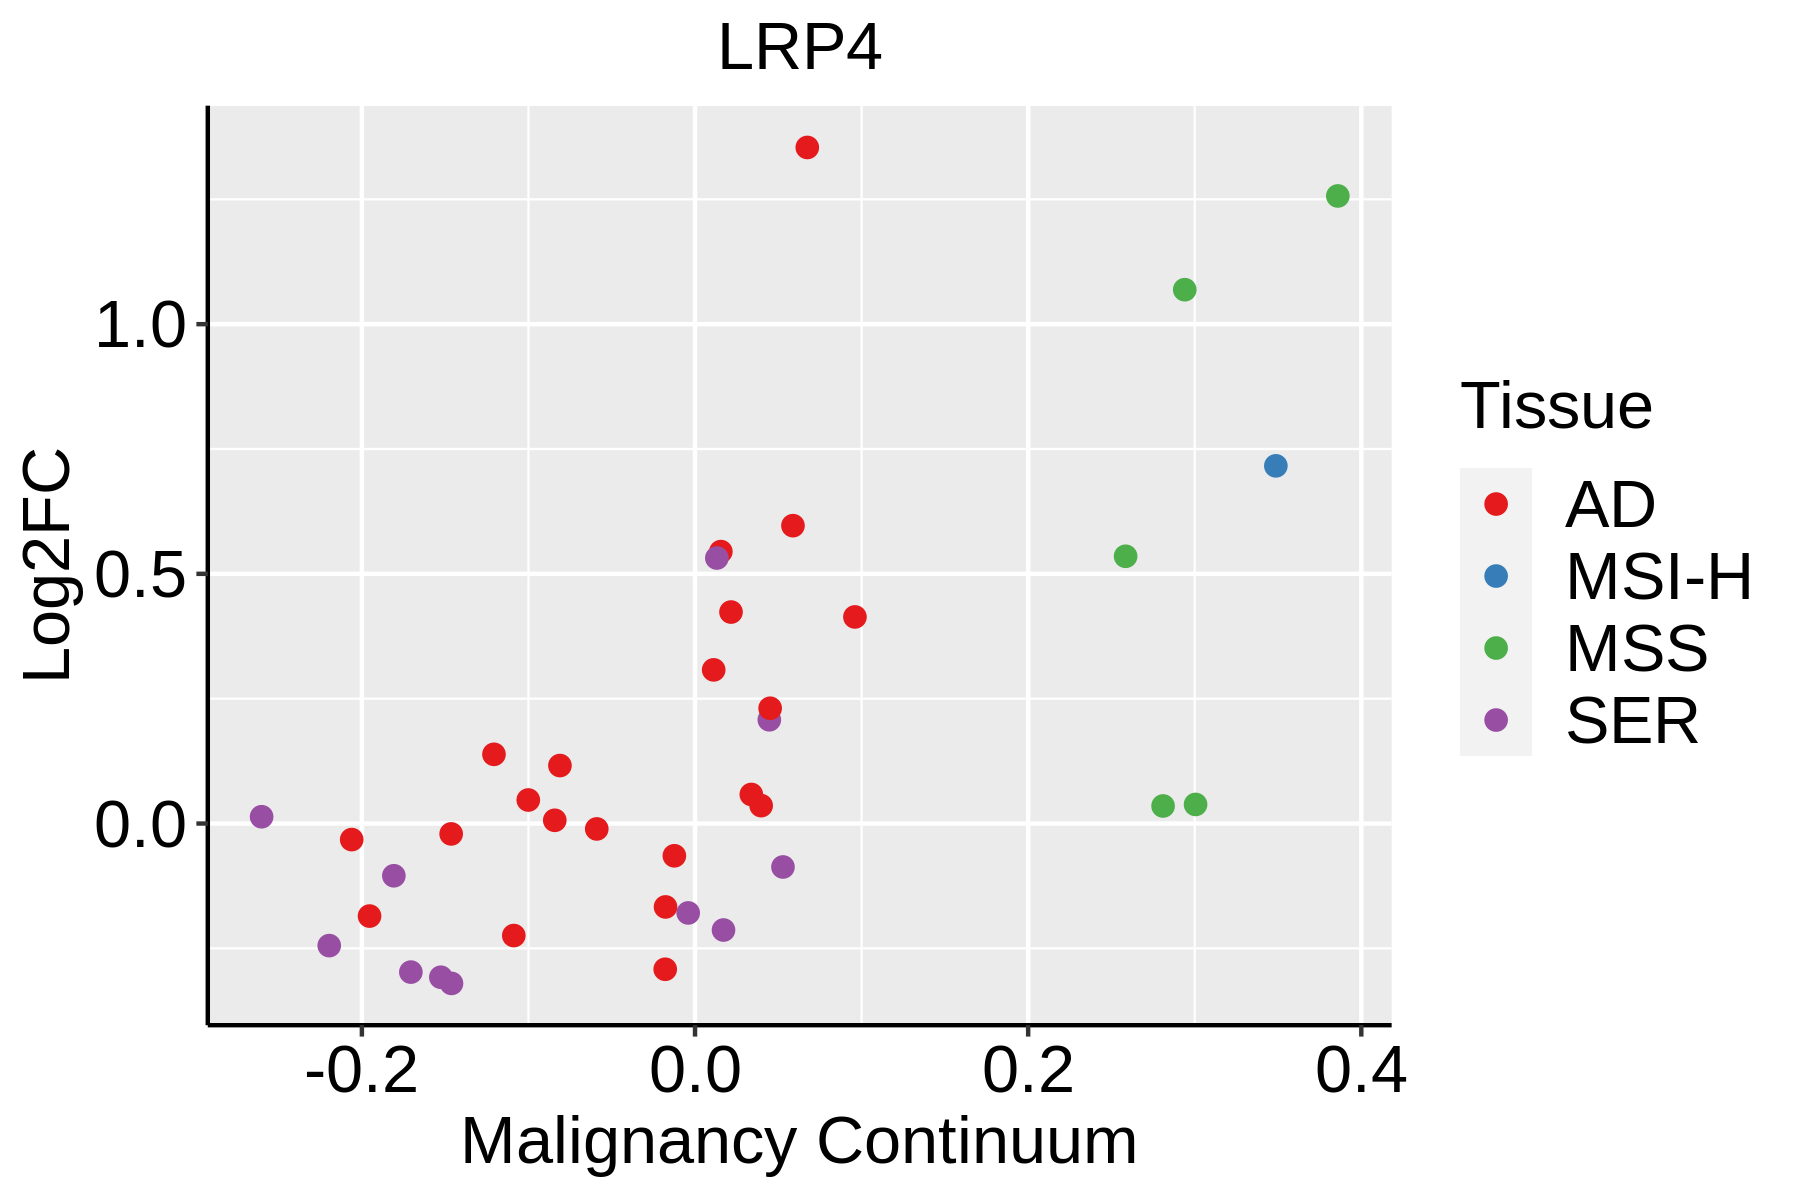 | AD: Adenomas |
| SER: Sessile serrated lesions | ||
| MSI-H: Microsatellite-high colorectal cancer | ||
| MSS: Microsatellite stable colorectal cancer | ||
| Thyroid | 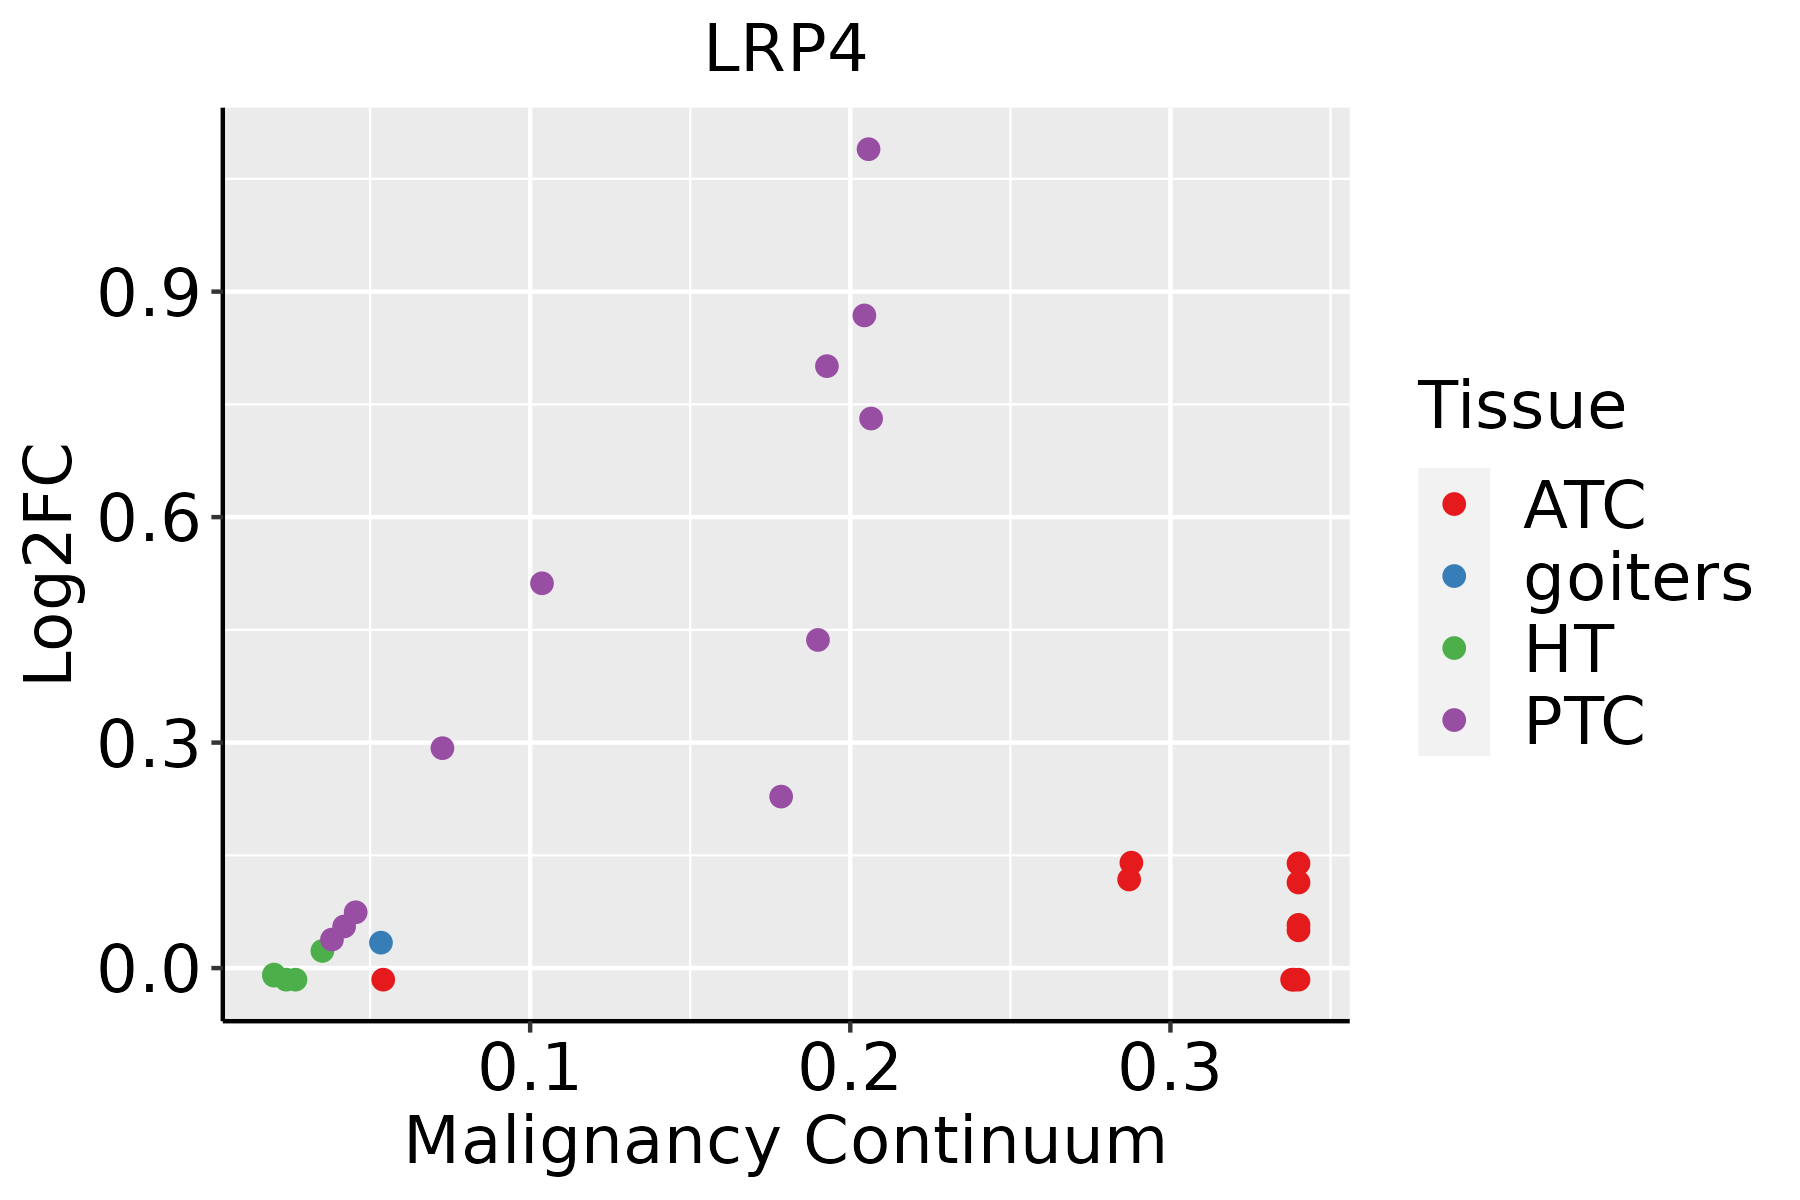 | ATC: Anaplastic thyroid cancer |
| HT: Hashimoto's thyroiditis | ||
| PTC: Papillary thyroid cancer |
| ∗log2FC in expression of this searched gene in stem-like cells from each diseased tissue sample relative to stem-like cells in normal samples in each tissue plotted against the malignancy continuum. Samples are colored based on if they are from different disease stage. |
Top |
Malignant transformation related pathway analysis |
| Find out the enriched GO biological processes and KEGG pathways involved in transition from healthy to precancer to cancer |
| Tissue | Disease Stage | Enriched GO biological Processes |
| Colorectum | AD |  |
| Colorectum | SER |  |
| Colorectum | MSS |  |
| Colorectum | MSI-H |  |
| Colorectum | FAP |  |
| ∗Top 15 enriched GO BP terms are showed in the bar plot of each disease state in each tissue. Each row represents a significant GO biological process which is colored according to the -log10(p.adjust). |
| Page: 1 2 3 4 5 6 7 8 9 |
| GO ID | Tissue | Disease Stage | Description | Gene Ratio | Bg Ratio | pvalue | p.adjust | Count |
| GO:1903829 | Colorectum | AD | positive regulation of cellular protein localization | 110/3918 | 276/18723 | 4.58e-13 | 8.44e-11 | 110 |
| GO:1905475 | Colorectum | AD | regulation of protein localization to membrane | 73/3918 | 175/18723 | 3.37e-10 | 2.93e-08 | 73 |
| GO:0034329 | Colorectum | AD | cell junction assembly | 136/3918 | 420/18723 | 2.02e-08 | 1.15e-06 | 136 |
| GO:1905477 | Colorectum | AD | positive regulation of protein localization to membrane | 46/3918 | 106/18723 | 1.47e-07 | 6.64e-06 | 46 |
| GO:0030111 | Colorectum | AD | regulation of Wnt signaling pathway | 102/3918 | 328/18723 | 8.51e-06 | 2.03e-04 | 102 |
| GO:0016055 | Colorectum | AD | Wnt signaling pathway | 130/3918 | 444/18723 | 1.60e-05 | 3.37e-04 | 130 |
| GO:0198738 | Colorectum | AD | cell-cell signaling by wnt | 130/3918 | 446/18723 | 2.02e-05 | 4.10e-04 | 130 |
| GO:0010975 | Colorectum | AD | regulation of neuron projection development | 129/3918 | 445/18723 | 2.88e-05 | 5.37e-04 | 129 |
| GO:0007409 | Colorectum | AD | axonogenesis | 122/3918 | 418/18723 | 3.36e-05 | 6.15e-04 | 122 |
| GO:0061564 | Colorectum | AD | axon development | 132/3918 | 467/18723 | 8.40e-05 | 1.31e-03 | 132 |
| GO:0060070 | Colorectum | AD | canonical Wnt signaling pathway | 90/3918 | 303/18723 | 1.76e-04 | 2.38e-03 | 90 |
| GO:0071709 | Colorectum | AD | membrane assembly | 22/3918 | 50/18723 | 2.00e-04 | 2.66e-03 | 22 |
| GO:0060828 | Colorectum | AD | regulation of canonical Wnt signaling pathway | 77/3918 | 253/18723 | 2.19e-04 | 2.87e-03 | 77 |
| GO:0031345 | Colorectum | AD | negative regulation of cell projection organization | 58/3918 | 186/18723 | 6.37e-04 | 6.58e-03 | 58 |
| GO:0044091 | Colorectum | AD | membrane biogenesis | 22/3918 | 55/18723 | 9.88e-04 | 9.28e-03 | 22 |
| GO:0050770 | Colorectum | AD | regulation of axonogenesis | 49/3918 | 154/18723 | 9.88e-04 | 9.28e-03 | 49 |
| GO:0050767 | Colorectum | AD | regulation of neurogenesis | 99/3918 | 364/18723 | 2.35e-03 | 1.82e-02 | 99 |
| GO:0099173 | Colorectum | AD | postsynapse organization | 51/3918 | 168/18723 | 2.47e-03 | 1.90e-02 | 51 |
| GO:0010977 | Colorectum | AD | negative regulation of neuron projection development | 43/3918 | 137/18723 | 2.60e-03 | 1.97e-02 | 43 |
| GO:0016358 | Colorectum | AD | dendrite development | 69/3918 | 243/18723 | 3.32e-03 | 2.42e-02 | 69 |
| Page: 1 2 3 4 5 6 7 8 9 |
| Pathway ID | Tissue | Disease Stage | Description | Gene Ratio | Bg Ratio | pvalue | p.adjust | qvalue | Count |
| Page: 1 |
Top |
Cell-cell communication analysis |
| Identification of potential cell-cell interactions between two cell types and their ligand-receptor pairs for different disease states |
| Ligand | Receptor | LRpair | Pathway | Tissue | Disease Stage |
| Page: 1 |
Top |
Single-cell gene regulatory network inference analysis |
| Find out the significant the regulons (TFs) and the target genes of each regulon across cell types for different disease states |
| TF | Cell Type | Tissue | Disease Stage | Target Gene | RSS | Regulon Activity |
| ∗The dot plots of a searched regulon are shown for all cell subpopulations in each disease state of each tissue based on the regulon specific score inferred using pySCENIC and by calculating the average expression. |
| Page: 1 |
Top |
Somatic mutation of malignant transformation related genes |
| Annotation of somatic variants for genes involved in malignant transformation |
| Hugo Symbol | Variant Class | Variant Classification | dbSNP RS | HGVSc | HGVSp | HGVSp Short | SWISSPROT | BIOTYPE | SIFT | PolyPhen | Tumor Sample Barcode | Tissue | Histology | Sex | Age | Stage | Therapy Types | Drugs | Outcome |
| LRP4 | SNV | Missense_Mutation | c.4423N>A | p.Ala1475Thr | p.A1475T | O75096 | protein_coding | deleterious(0.02) | probably_damaging(0.95) | TCGA-A8-A06T-01 | Breast | breast invasive carcinoma | Female | >=65 | III/IV | Hormone Therapy | anastrozole | SD | |
| LRP4 | SNV | Missense_Mutation | rs772706817 | c.5424G>C | p.Lys1808Asn | p.K1808N | O75096 | protein_coding | deleterious_low_confidence(0.03) | benign(0.04) | TCGA-AC-A23H-01 | Breast | breast invasive carcinoma | Female | >=65 | I/II | Unknown | Unknown | PD |
| LRP4 | SNV | Missense_Mutation | c.2761G>A | p.Asp921Asn | p.D921N | O75096 | protein_coding | deleterious(0) | probably_damaging(0.999) | TCGA-AC-A23H-01 | Breast | breast invasive carcinoma | Female | >=65 | I/II | Unknown | Unknown | PD | |
| LRP4 | SNV | Missense_Mutation | c.4620N>C | p.Glu1540Asp | p.E1540D | O75096 | protein_coding | tolerated(0.09) | probably_damaging(0.992) | TCGA-AR-A0TX-01 | Breast | breast invasive carcinoma | Female | <65 | I/II | Unknown | Unknown | SD | |
| LRP4 | SNV | Missense_Mutation | c.3361N>G | p.Thr1121Ala | p.T1121A | O75096 | protein_coding | tolerated(0.7) | benign(0.27) | TCGA-BH-A0HA-01 | Breast | breast invasive carcinoma | Female | <65 | I/II | Unknown | Unknown | SD | |
| LRP4 | SNV | Missense_Mutation | c.4199A>G | p.Tyr1400Cys | p.Y1400C | O75096 | protein_coding | deleterious(0) | probably_damaging(0.997) | TCGA-BH-A18K-01 | Breast | breast invasive carcinoma | Female | <65 | I/II | Unknown | Unknown | PD | |
| LRP4 | SNV | Missense_Mutation | c.5018N>G | p.Asn1673Ser | p.N1673S | O75096 | protein_coding | tolerated(0.29) | possibly_damaging(0.899) | TCGA-C8-A12P-01 | Breast | breast invasive carcinoma | Female | <65 | I/II | Unknown | Unknown | SD | |
| LRP4 | SNV | Missense_Mutation | c.631N>C | p.Asp211His | p.D211H | O75096 | protein_coding | deleterious(0) | probably_damaging(0.971) | TCGA-D8-A1JC-01 | Breast | breast invasive carcinoma | Female | <65 | III/IV | Chemotherapy | adriamycin | SD | |
| LRP4 | SNV | Missense_Mutation | novel | c.2072A>C | p.His691Pro | p.H691P | O75096 | protein_coding | deleterious(0) | possibly_damaging(0.884) | TCGA-D8-A1JI-01 | Breast | breast invasive carcinoma | Female | <65 | I/II | Chemotherapy | doxorubicine | SD |
| LRP4 | SNV | Missense_Mutation | novel | c.3907N>C | p.Asp1303His | p.D1303H | O75096 | protein_coding | tolerated(0.26) | benign(0.014) | TCGA-E2-A1LG-01 | Breast | breast invasive carcinoma | Female | <65 | I/II | Chemotherapy | doxorubicin | SD |
| Page: 1 2 3 4 5 6 7 8 9 10 11 12 13 14 15 16 17 18 19 20 21 |
Top |
Related drugs of malignant transformation related genes |
| Identification of chemicals and drugs interact with genes involved in malignant transfromation |
| (DGIdb 4.0) |
| Entrez ID | Symbol | Category | Interaction Types | Drug Claim Name | Drug Name | PMIDs |
| Page: 1 |

Copyright 2023-Present -The University of Texas Health Science Center at Houston |