
|
|||||
|
 | |
| |
| |
| |
| |
| |
|
Gene: LRP3 |
Gene summary for LRP3 |
| Gene information | Species | Human | Gene symbol | LRP3 | Gene ID | 4037 |
| Gene name | LDL receptor related protein 3 | |
| Gene Alias | LRP3 | |
| Cytomap | 19q13.11 | |
| Gene Type | protein-coding | GO ID | GO:0001503 | UniProtAcc | O75074 |
Top |
Malignant transformation analysis |
| Identification of the aberrant gene expression in precancerous and cancerous lesions by comparing the gene expression of stem-like cells in diseased tissues with normal stem cells |
| Entrez ID | Symbol | Replicates | Species | Organ | Tissue | Adj P-value | Log2FC | Malignancy |
| 4037 | LRP3 | HCC1_Meng | Human | Liver | HCC | 9.50e-24 | 4.64e-02 | 0.0246 |
| 4037 | LRP3 | HCC2_Meng | Human | Liver | HCC | 1.99e-04 | 5.41e-02 | 0.0107 |
| 4037 | LRP3 | cirrhotic3 | Human | Liver | Cirrhotic | 1.86e-02 | 1.00e-01 | 0.0215 |
| 4037 | LRP3 | HCC2 | Human | Liver | HCC | 4.35e-04 | 1.45e+00 | 0.5341 |
| 4037 | LRP3 | Pt14.a | Human | Liver | HCC | 4.24e-03 | 2.13e-01 | 0.0169 |
| 4037 | LRP3 | S015 | Human | Liver | HCC | 1.32e-02 | 1.88e-01 | 0.2375 |
| 4037 | LRP3 | S027 | Human | Liver | HCC | 9.06e-12 | 6.13e-01 | 0.2446 |
| 4037 | LRP3 | S028 | Human | Liver | HCC | 1.57e-31 | 1.04e+00 | 0.2503 |
| 4037 | LRP3 | S029 | Human | Liver | HCC | 2.75e-23 | 8.05e-01 | 0.2581 |
| 4037 | LRP3 | PTC03 | Human | Thyroid | PTC | 3.03e-02 | 1.61e-01 | 0.1784 |
| 4037 | LRP3 | PTC05 | Human | Thyroid | PTC | 4.74e-09 | 2.65e-01 | 0.2065 |
| 4037 | LRP3 | PTC06 | Human | Thyroid | PTC | 7.51e-14 | 3.19e-01 | 0.2057 |
| 4037 | LRP3 | PTC07 | Human | Thyroid | PTC | 2.42e-09 | 1.99e-01 | 0.2044 |
| 4037 | LRP3 | ATC12 | Human | Thyroid | ATC | 2.23e-04 | 1.14e-01 | 0.34 |
| 4037 | LRP3 | ATC13 | Human | Thyroid | ATC | 6.86e-35 | 6.84e-01 | 0.34 |
| 4037 | LRP3 | ATC2 | Human | Thyroid | ATC | 1.72e-11 | 9.17e-01 | 0.34 |
| 4037 | LRP3 | ATC4 | Human | Thyroid | ATC | 1.34e-08 | 1.53e-01 | 0.34 |
| 4037 | LRP3 | ATC5 | Human | Thyroid | ATC | 2.01e-36 | 7.32e-01 | 0.34 |
| Page: 1 |
| Tissue | Expression Dynamics | Abbreviation |
| Liver |  | HCC: Hepatocellular carcinoma |
| NAFLD: Non-alcoholic fatty liver disease | ||
| Thyroid | 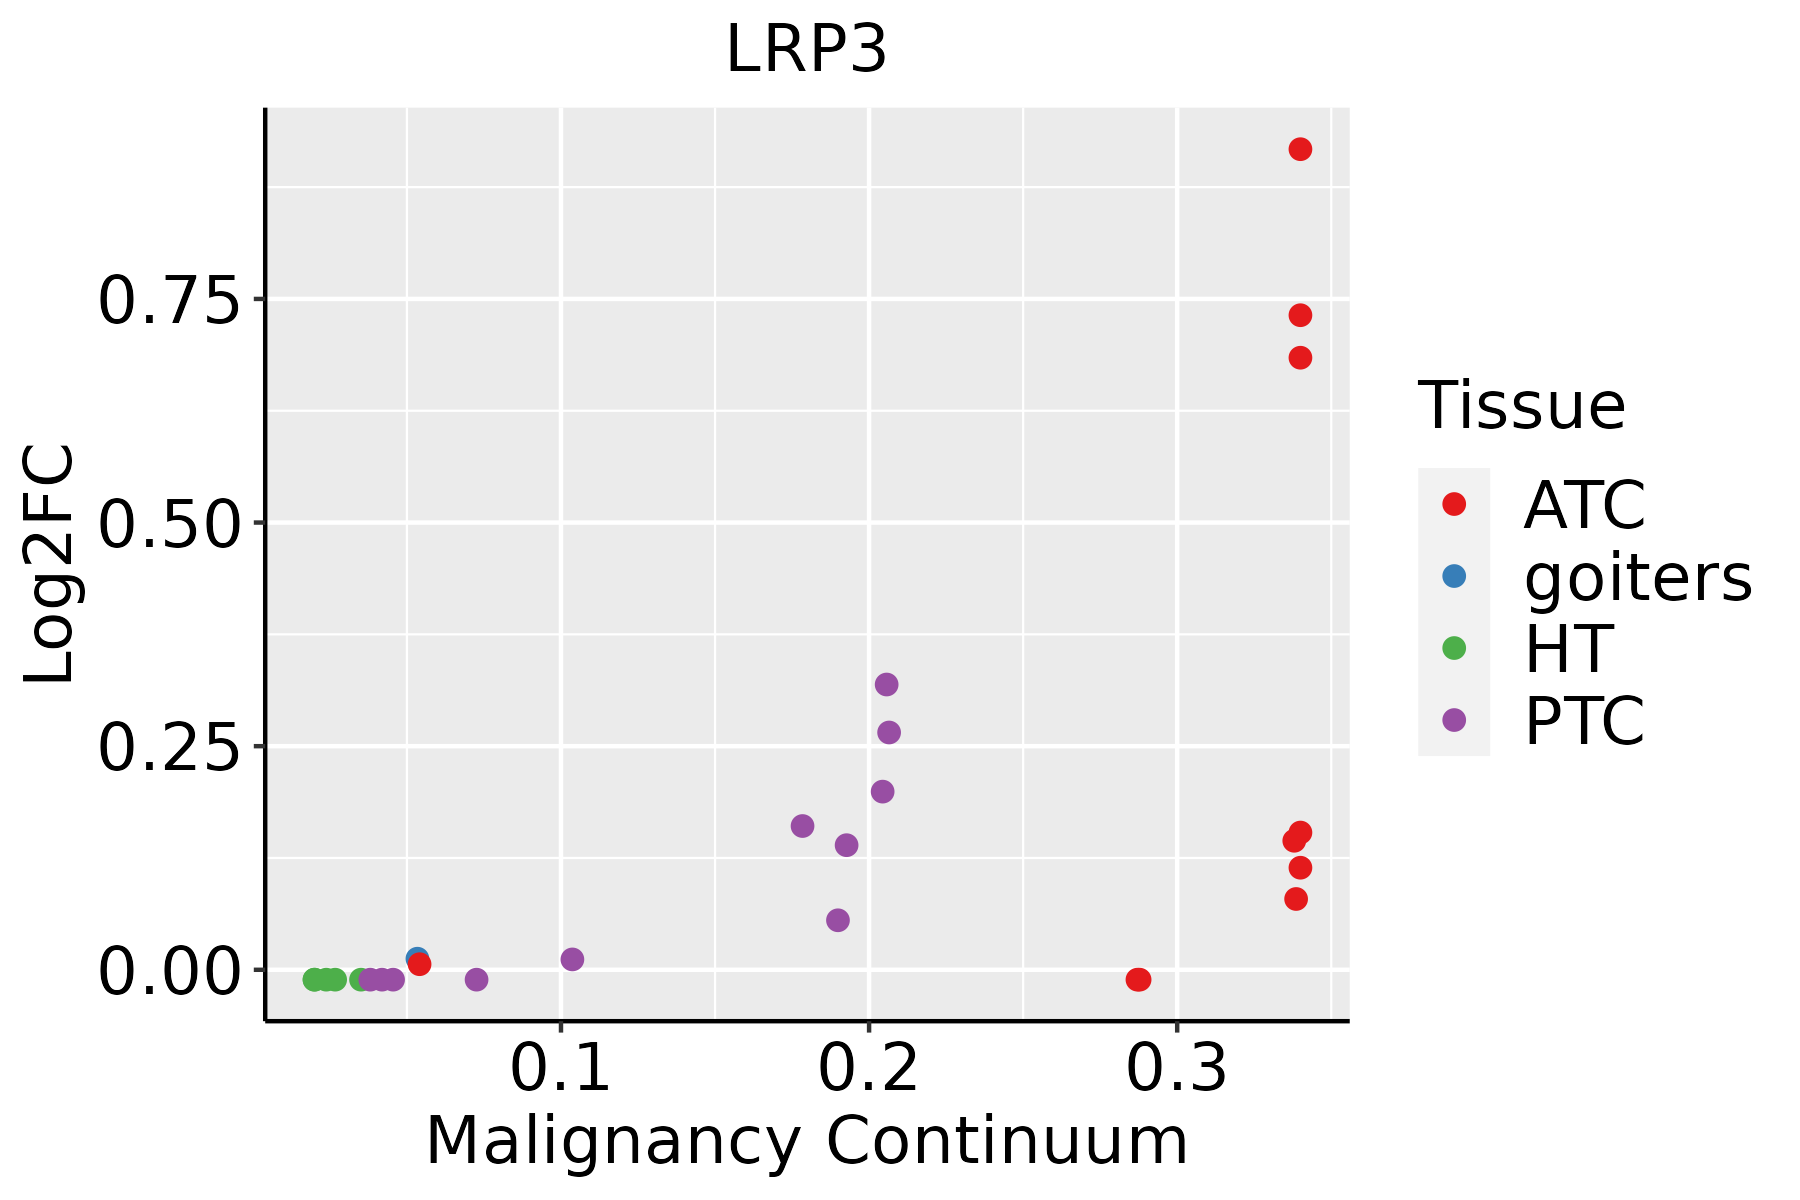 | ATC: Anaplastic thyroid cancer |
| HT: Hashimoto's thyroiditis | ||
| PTC: Papillary thyroid cancer |
| ∗log2FC in expression of this searched gene in stem-like cells from each diseased tissue sample relative to stem-like cells in normal samples in each tissue plotted against the malignancy continuum. Samples are colored based on if they are from different disease stage. |
Top |
Malignant transformation related pathway analysis |
| Find out the enriched GO biological processes and KEGG pathways involved in transition from healthy to precancer to cancer |
| Tissue | Disease Stage | Enriched GO biological Processes |
| Colorectum | AD |  |
| Colorectum | SER |  |
| Colorectum | MSS |  |
| Colorectum | MSI-H |  |
| Colorectum | FAP |  |
| ∗Top 15 enriched GO BP terms are showed in the bar plot of each disease state in each tissue. Each row represents a significant GO biological process which is colored according to the -log10(p.adjust). |
| Page: 1 2 3 4 5 6 7 8 9 |
| GO ID | Tissue | Disease Stage | Description | Gene Ratio | Bg Ratio | pvalue | p.adjust | Count |
| GO:000689811 | Liver | Cirrhotic | receptor-mediated endocytosis | 91/4634 | 244/18723 | 8.13e-06 | 1.22e-04 | 91 |
| GO:00016495 | Liver | Cirrhotic | osteoblast differentiation | 80/4634 | 229/18723 | 3.39e-04 | 2.91e-03 | 80 |
| GO:00015035 | Liver | Cirrhotic | ossification | 127/4634 | 408/18723 | 1.89e-03 | 1.19e-02 | 127 |
| GO:00454442 | Liver | Cirrhotic | fat cell differentiation | 73/4634 | 229/18723 | 8.57e-03 | 3.97e-02 | 73 |
| GO:000689821 | Liver | HCC | receptor-mediated endocytosis | 134/7958 | 244/18723 | 5.73e-05 | 5.31e-04 | 134 |
| GO:00454441 | Liver | HCC | fat cell differentiation | 120/7958 | 229/18723 | 1.52e-03 | 8.05e-03 | 120 |
| GO:015010411 | Liver | HCC | transport across blood-brain barrier | 50/7958 | 87/18723 | 3.42e-03 | 1.55e-02 | 50 |
| GO:001023211 | Liver | HCC | vascular transport | 50/7958 | 88/18723 | 4.69e-03 | 2.02e-02 | 50 |
| GO:000164911 | Liver | HCC | osteoblast differentiation | 115/7958 | 229/18723 | 1.08e-02 | 3.99e-02 | 115 |
| GO:0001503110 | Thyroid | PTC | ossification | 176/5968 | 408/18723 | 9.26e-07 | 1.40e-05 | 176 |
| GO:0006898110 | Thyroid | PTC | receptor-mediated endocytosis | 112/5968 | 244/18723 | 2.87e-06 | 3.74e-05 | 112 |
| GO:0001649111 | Thyroid | PTC | osteoblast differentiation | 102/5968 | 229/18723 | 3.66e-05 | 3.40e-04 | 102 |
| GO:004544418 | Thyroid | PTC | fat cell differentiation | 102/5968 | 229/18723 | 3.66e-05 | 3.40e-04 | 102 |
| GO:004559814 | Thyroid | PTC | regulation of fat cell differentiation | 59/5968 | 139/18723 | 5.50e-03 | 2.50e-02 | 59 |
| GO:00456697 | Thyroid | PTC | positive regulation of osteoblast differentiation | 32/5968 | 69/18723 | 8.16e-03 | 3.44e-02 | 32 |
| GO:000150332 | Thyroid | ATC | ossification | 206/6293 | 408/18723 | 9.23e-13 | 3.95e-11 | 206 |
| GO:000164932 | Thyroid | ATC | osteoblast differentiation | 122/6293 | 229/18723 | 6.04e-10 | 1.60e-08 | 122 |
| GO:000689826 | Thyroid | ATC | receptor-mediated endocytosis | 118/6293 | 244/18723 | 1.17e-06 | 1.50e-05 | 118 |
| GO:004566721 | Thyroid | ATC | regulation of osteoblast differentiation | 66/6293 | 132/18723 | 7.03e-05 | 5.36e-04 | 66 |
| GO:004544423 | Thyroid | ATC | fat cell differentiation | 105/6293 | 229/18723 | 7.42e-05 | 5.62e-04 | 105 |
| Page: 1 2 |
| Pathway ID | Tissue | Disease Stage | Description | Gene Ratio | Bg Ratio | pvalue | p.adjust | qvalue | Count |
| Page: 1 |
Top |
Cell-cell communication analysis |
| Identification of potential cell-cell interactions between two cell types and their ligand-receptor pairs for different disease states |
| Ligand | Receptor | LRpair | Pathway | Tissue | Disease Stage |
| Page: 1 |
Top |
Single-cell gene regulatory network inference analysis |
| Find out the significant the regulons (TFs) and the target genes of each regulon across cell types for different disease states |
| TF | Cell Type | Tissue | Disease Stage | Target Gene | RSS | Regulon Activity |
| ∗The dot plots of a searched regulon are shown for all cell subpopulations in each disease state of each tissue based on the regulon specific score inferred using pySCENIC and by calculating the average expression. |
| Page: 1 |
Top |
Somatic mutation of malignant transformation related genes |
| Annotation of somatic variants for genes involved in malignant transformation |
| Hugo Symbol | Variant Class | Variant Classification | dbSNP RS | HGVSc | HGVSp | HGVSp Short | SWISSPROT | BIOTYPE | SIFT | PolyPhen | Tumor Sample Barcode | Tissue | Histology | Sex | Age | Stage | Therapy Types | Drugs | Outcome |
| LRP3 | SNV | Missense_Mutation | c.373N>A | p.Pro125Thr | p.P125T | O75074 | protein_coding | deleterious(0) | probably_damaging(0.999) | TCGA-BH-A18G-01 | Breast | breast invasive carcinoma | Female | >=65 | I/II | Unknown | Unknown | SD | |
| LRP3 | SNV | Missense_Mutation | novel | c.983N>A | p.Arg328His | p.R328H | O75074 | protein_coding | tolerated(0.63) | benign(0) | TCGA-2W-A8YY-01 | Cervix | cervical & endocervical cancer | Female | <65 | I/II | Chemotherapy | cisplatin | CR |
| LRP3 | SNV | Missense_Mutation | rs546341155 | c.1387N>A | p.Gly463Ser | p.G463S | O75074 | protein_coding | tolerated(0.05) | probably_damaging(1) | TCGA-2W-A8YY-01 | Cervix | cervical & endocervical cancer | Female | <65 | I/II | Chemotherapy | cisplatin | CR |
| LRP3 | SNV | Missense_Mutation | rs762589974 | c.922N>A | p.Val308Met | p.V308M | O75074 | protein_coding | deleterious(0) | possibly_damaging(0.905) | TCGA-A6-3809-01 | Colorectum | colon adenocarcinoma | Female | >=65 | I/II | Unknown | Unknown | SD |
| LRP3 | SNV | Missense_Mutation | c.2296N>A | p.Ala766Thr | p.A766T | O75074 | protein_coding | deleterious_low_confidence(0.01) | benign(0.003) | TCGA-A6-5665-01 | Colorectum | colon adenocarcinoma | Female | >=65 | I/II | Unknown | Unknown | PD | |
| LRP3 | SNV | Missense_Mutation | novel | c.1744C>A | p.Leu582Ile | p.L582I | O75074 | protein_coding | tolerated(0.23) | benign(0.011) | TCGA-AA-3947-01 | Colorectum | colon adenocarcinoma | Female | <65 | I/II | Unknown | Unknown | SD |
| LRP3 | SNV | Missense_Mutation | rs755299962 | c.2113G>A | p.Glu705Lys | p.E705K | O75074 | protein_coding | deleterious_low_confidence(0.04) | benign(0.003) | TCGA-AA-3984-01 | Colorectum | colon adenocarcinoma | Female | <65 | I/II | Unknown | Unknown | SD |
| LRP3 | SNV | Missense_Mutation | c.155N>G | p.Glu52Gly | p.E52G | O75074 | protein_coding | deleterious(0.05) | benign(0.329) | TCGA-AD-6901-01 | Colorectum | colon adenocarcinoma | Male | >=65 | I/II | Chemotherapy | xeloda | PD | |
| LRP3 | SNV | Missense_Mutation | c.359N>A | p.Cys120Tyr | p.C120Y | O75074 | protein_coding | deleterious(0) | probably_damaging(0.999) | TCGA-AZ-6598-01 | Colorectum | colon adenocarcinoma | Female | >=65 | I/II | Unknown | Unknown | SD | |
| LRP3 | SNV | Missense_Mutation | c.1411N>T | p.Thr471Ser | p.T471S | O75074 | protein_coding | tolerated(0.64) | probably_damaging(0.925) | TCGA-DM-A28A-01 | Colorectum | colon adenocarcinoma | Male | >=65 | III/IV | Unknown | Unknown | SD |
| Page: 1 2 3 4 5 6 7 |
Top |
Related drugs of malignant transformation related genes |
| Identification of chemicals and drugs interact with genes involved in malignant transfromation |
| (DGIdb 4.0) |
| Entrez ID | Symbol | Category | Interaction Types | Drug Claim Name | Drug Name | PMIDs |
| Page: 1 |

Copyright 2023-Present -The University of Texas Health Science Center at Houston |