
|
|||||
|
 | |
| |
| |
| |
| |
| |
|
Gene: LRP2 |
Gene summary for LRP2 |
| Gene information | Species | Human | Gene symbol | LRP2 | Gene ID | 4036 |
| Gene name | LDL receptor related protein 2 | |
| Gene Alias | DBS | |
| Cytomap | 2q31.1 | |
| Gene Type | protein-coding | GO ID | GO:0000003 | UniProtAcc | P98164 |
Top |
Malignant transformation analysis |
| Identification of the aberrant gene expression in precancerous and cancerous lesions by comparing the gene expression of stem-like cells in diseased tissues with normal stem cells |
| Entrez ID | Symbol | Replicates | Species | Organ | Tissue | Adj P-value | Log2FC | Malignancy |
| 4036 | LRP2 | RNA-P25T1-P25T1-1 | Human | Lung | AIS | 5.55e-20 | 8.29e-01 | -0.2116 |
| 4036 | LRP2 | RNA-P25T1-P25T1-2 | Human | Lung | AIS | 3.88e-05 | 8.00e-01 | -0.1941 |
| 4036 | LRP2 | RNA-P25T1-P25T1-3 | Human | Lung | AIS | 4.56e-10 | 9.09e-01 | -0.2107 |
| 4036 | LRP2 | RNA-P25T1-P25T1-4 | Human | Lung | AIS | 2.79e-18 | 1.02e+00 | -0.2119 |
| 4036 | LRP2 | Adj_PTCwithHT_6 | Human | Thyroid | HT | 1.19e-10 | -4.35e-01 | 0.02 |
| 4036 | LRP2 | PTCwithHT_6 | Human | Thyroid | HT | 5.71e-10 | -4.34e-01 | 0.02 |
| 4036 | LRP2 | PTCwithHT_8 | Human | Thyroid | HT | 1.73e-08 | -4.20e-01 | 0.0351 |
| 4036 | LRP2 | PTCwithoutHT_2 | Human | Thyroid | PTC | 2.61e-10 | -4.40e-01 | 0.0419 |
| 4036 | LRP2 | male-WTA | Human | Thyroid | PTC | 1.15e-29 | 1.26e-01 | 0.1037 |
| 4036 | LRP2 | PTC01 | Human | Thyroid | PTC | 9.20e-09 | -2.44e-01 | 0.1899 |
| 4036 | LRP2 | PTC03 | Human | Thyroid | PTC | 8.29e-03 | -1.15e-01 | 0.1784 |
| 4036 | LRP2 | PTC04 | Human | Thyroid | PTC | 7.56e-06 | 2.12e-01 | 0.1927 |
| 4036 | LRP2 | PTC06 | Human | Thyroid | PTC | 2.34e-15 | 7.49e-04 | 0.2057 |
| 4036 | LRP2 | PTC07 | Human | Thyroid | PTC | 8.86e-14 | 2.46e-01 | 0.2044 |
| 4036 | LRP2 | ATC12 | Human | Thyroid | ATC | 5.45e-11 | -4.40e-01 | 0.34 |
| 4036 | LRP2 | ATC13 | Human | Thyroid | ATC | 2.48e-11 | -4.39e-01 | 0.34 |
| 4036 | LRP2 | ATC4 | Human | Thyroid | ATC | 1.39e-07 | -4.40e-01 | 0.34 |
| 4036 | LRP2 | ATC5 | Human | Thyroid | ATC | 1.19e-10 | -4.39e-01 | 0.34 |
| Page: 1 |
| Tissue | Expression Dynamics | Abbreviation |
| Lung | 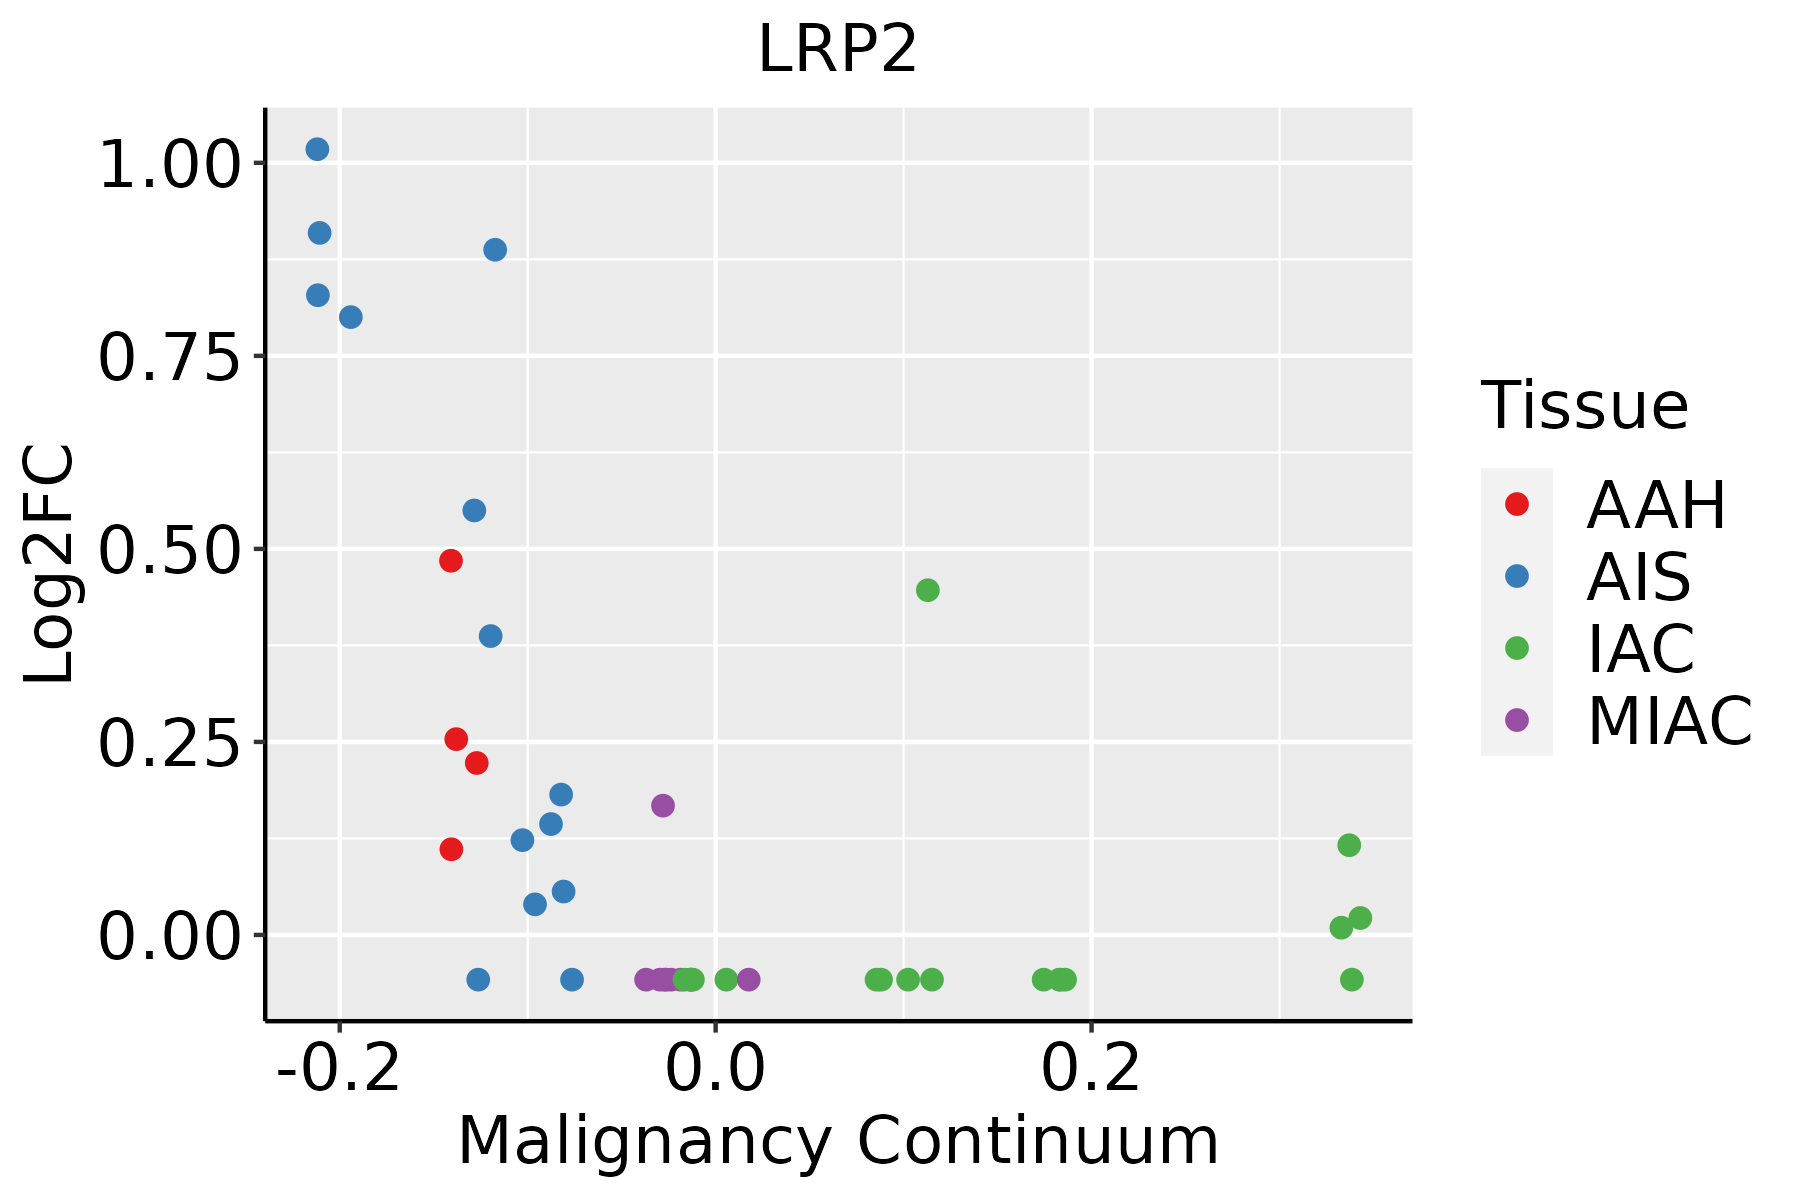 | AAH: Atypical adenomatous hyperplasia |
| AIS: Adenocarcinoma in situ | ||
| IAC: Invasive lung adenocarcinoma | ||
| MIA: Minimally invasive adenocarcinoma | ||
| Thyroid |  | ATC: Anaplastic thyroid cancer |
| HT: Hashimoto's thyroiditis | ||
| PTC: Papillary thyroid cancer |
| ∗log2FC in expression of this searched gene in stem-like cells from each diseased tissue sample relative to stem-like cells in normal samples in each tissue plotted against the malignancy continuum. Samples are colored based on if they are from different disease stage. |
Top |
Malignant transformation related pathway analysis |
| Find out the enriched GO biological processes and KEGG pathways involved in transition from healthy to precancer to cancer |
| Tissue | Disease Stage | Enriched GO biological Processes |
| Colorectum | AD |  |
| Colorectum | SER |  |
| Colorectum | MSS |  |
| Colorectum | MSI-H |  |
| Colorectum | FAP |  |
| ∗Top 15 enriched GO BP terms are showed in the bar plot of each disease state in each tissue. Each row represents a significant GO biological process which is colored according to the -log10(p.adjust). |
| Page: 1 2 3 4 5 6 7 8 9 |
| GO ID | Tissue | Disease Stage | Description | Gene Ratio | Bg Ratio | pvalue | p.adjust | Count |
| GO:004217613 | Lung | AIS | regulation of protein catabolic process | 92/1849 | 391/18723 | 1.34e-15 | 3.91e-12 | 92 |
| GO:000989613 | Lung | AIS | positive regulation of catabolic process | 103/1849 | 492/18723 | 9.59e-14 | 1.86e-10 | 103 |
| GO:004573213 | Lung | AIS | positive regulation of protein catabolic process | 60/1849 | 231/18723 | 1.47e-12 | 2.14e-09 | 60 |
| GO:003133113 | Lung | AIS | positive regulation of cellular catabolic process | 89/1849 | 427/18723 | 6.12e-12 | 4.46e-09 | 89 |
| GO:190336213 | Lung | AIS | regulation of cellular protein catabolic process | 62/1849 | 255/18723 | 1.37e-11 | 6.13e-09 | 62 |
| GO:190336413 | Lung | AIS | positive regulation of cellular protein catabolic process | 41/1849 | 155/18723 | 2.79e-09 | 4.92e-07 | 41 |
| GO:000689812 | Lung | AIS | receptor-mediated endocytosis | 50/1849 | 244/18723 | 4.47e-07 | 3.52e-05 | 50 |
| GO:000165511 | Lung | AIS | urogenital system development | 63/1849 | 338/18723 | 5.46e-07 | 4.08e-05 | 63 |
| GO:000182211 | Lung | AIS | kidney development | 53/1849 | 293/18723 | 1.04e-05 | 4.25e-04 | 53 |
| GO:007200111 | Lung | AIS | renal system development | 54/1849 | 302/18723 | 1.21e-05 | 4.71e-04 | 54 |
| GO:006056211 | Lung | AIS | epithelial tube morphogenesis | 57/1849 | 325/18723 | 1.27e-05 | 4.78e-04 | 57 |
| GO:006145812 | Lung | AIS | reproductive system development | 70/1849 | 427/18723 | 1.52e-05 | 5.50e-04 | 70 |
| GO:004860811 | Lung | AIS | reproductive structure development | 69/1849 | 424/18723 | 2.23e-05 | 7.42e-04 | 69 |
| GO:000184111 | Lung | AIS | neural tube formation | 23/1849 | 102/18723 | 1.24e-04 | 2.82e-03 | 23 |
| GO:001402011 | Lung | AIS | primary neural tube formation | 21/1849 | 94/18723 | 2.75e-04 | 5.19e-03 | 21 |
| GO:000184311 | Lung | AIS | neural tube closure | 20/1849 | 88/18723 | 2.99e-04 | 5.54e-03 | 20 |
| GO:006060611 | Lung | AIS | tube closure | 20/1849 | 89/18723 | 3.50e-04 | 6.28e-03 | 20 |
| GO:000183811 | Lung | AIS | embryonic epithelial tube formation | 24/1849 | 121/18723 | 6.82e-04 | 1.02e-02 | 24 |
| GO:002191511 | Lung | AIS | neural tube development | 28/1849 | 152/18723 | 8.81e-04 | 1.19e-02 | 28 |
| GO:00163311 | Lung | AIS | morphogenesis of embryonic epithelium | 27/1849 | 147/18723 | 1.13e-03 | 1.45e-02 | 27 |
| Page: 1 2 3 4 5 6 7 8 9 |
| Pathway ID | Tissue | Disease Stage | Description | Gene Ratio | Bg Ratio | pvalue | p.adjust | qvalue | Count |
| hsa04340 | Lung | AIS | Hedgehog signaling pathway | 14/961 | 56/8465 | 3.21e-03 | 1.82e-02 | 1.17e-02 | 14 |
| hsa043401 | Lung | AIS | Hedgehog signaling pathway | 14/961 | 56/8465 | 3.21e-03 | 1.82e-02 | 1.17e-02 | 14 |
| Page: 1 |
Top |
Cell-cell communication analysis |
| Identification of potential cell-cell interactions between two cell types and their ligand-receptor pairs for different disease states |
| Ligand | Receptor | LRpair | Pathway | Tissue | Disease Stage |
| Page: 1 |
Top |
Single-cell gene regulatory network inference analysis |
| Find out the significant the regulons (TFs) and the target genes of each regulon across cell types for different disease states |
| TF | Cell Type | Tissue | Disease Stage | Target Gene | RSS | Regulon Activity |
| ∗The dot plots of a searched regulon are shown for all cell subpopulations in each disease state of each tissue based on the regulon specific score inferred using pySCENIC and by calculating the average expression. |
| Page: 1 |
Top |
Somatic mutation of malignant transformation related genes |
| Annotation of somatic variants for genes involved in malignant transformation |
| Hugo Symbol | Variant Class | Variant Classification | dbSNP RS | HGVSc | HGVSp | HGVSp Short | SWISSPROT | BIOTYPE | SIFT | PolyPhen | Tumor Sample Barcode | Tissue | Histology | Sex | Age | Stage | Therapy Types | Drugs | Outcome |
| LRP2 | SNV | Missense_Mutation | novel | c.12085G>C | p.Glu4029Gln | p.E4029Q | P98164 | protein_coding | tolerated(0.21) | probably_damaging(0.999) | TCGA-5L-AAT1-01 | Breast | breast invasive carcinoma | Female | <65 | III/IV | Hormone Therapy | letrozol | SD |
| LRP2 | SNV | Missense_Mutation | c.5960N>C | p.Asp1987Ala | p.D1987A | P98164 | protein_coding | deleterious(0.02) | probably_damaging(0.997) | TCGA-A1-A0SD-01 | Breast | breast invasive carcinoma | Female | <65 | I/II | Unknown | Unknown | SD | |
| LRP2 | SNV | Missense_Mutation | c.7867N>C | p.Gly2623Arg | p.G2623R | P98164 | protein_coding | deleterious(0) | probably_damaging(0.999) | TCGA-A2-A04X-01 | Breast | breast invasive carcinoma | Female | <65 | I/II | Chemotherapy | adriamycin | SD | |
| LRP2 | SNV | Missense_Mutation | c.9674N>A | p.Gly3225Glu | p.G3225E | P98164 | protein_coding | deleterious(0.04) | probably_damaging(0.999) | TCGA-A2-A0CW-01 | Breast | breast invasive carcinoma | Female | >=65 | I/II | Hormone Therapy | anastrozole | SD | |
| LRP2 | SNV | Missense_Mutation | c.6733N>C | p.Asp2245His | p.D2245H | P98164 | protein_coding | deleterious(0) | benign(0.276) | TCGA-A2-A0CX-01 | Breast | breast invasive carcinoma | Female | <65 | I/II | Chemotherapy | adriamycin | SD | |
| LRP2 | SNV | Missense_Mutation | c.7850G>T | p.Arg2617Leu | p.R2617L | P98164 | protein_coding | deleterious(0) | probably_damaging(0.997) | TCGA-A2-A0T4-01 | Breast | breast invasive carcinoma | Female | <65 | I/II | Hormone Therapy | femara | SD | |
| LRP2 | SNV | Missense_Mutation | rs745739674 | c.9265N>A | p.Glu3089Lys | p.E3089K | P98164 | protein_coding | deleterious(0.02) | benign(0.322) | TCGA-A7-A26H-01 | Breast | breast invasive carcinoma | Female | >=65 | I/II | Hormone Therapy | anastrozole | PD |
| LRP2 | SNV | Missense_Mutation | c.5339N>A | p.Gly1780Asp | p.G1780D | P98164 | protein_coding | deleterious(0) | possibly_damaging(0.903) | TCGA-A7-A6VW-01 | Breast | breast invasive carcinoma | Female | <65 | I/II | Chemotherapy | doxorubicin | CR | |
| LRP2 | SNV | Missense_Mutation | c.5356N>C | p.Asp1786His | p.D1786H | P98164 | protein_coding | deleterious(0) | probably_damaging(0.999) | TCGA-A8-A09G-01 | Breast | breast invasive carcinoma | Female | >=65 | III/IV | Unknown | Unknown | SD | |
| LRP2 | SNV | Missense_Mutation | c.11075N>A | p.Cys3692Tyr | p.C3692Y | P98164 | protein_coding | deleterious(0) | probably_damaging(0.999) | TCGA-A8-A0A1-01 | Breast | breast invasive carcinoma | Female | >=65 | I/II | Hormone Therapy | tamoxiphen | SD |
| Page: 1 2 3 4 5 6 7 8 9 10 11 12 13 14 15 16 17 18 19 20 21 22 23 24 25 26 27 28 29 30 31 32 33 34 35 36 37 38 39 40 41 42 43 44 45 46 47 48 49 50 51 52 53 54 55 56 57 58 59 60 61 62 63 64 65 66 67 68 69 70 71 72 73 |
Top |
Related drugs of malignant transformation related genes |
| Identification of chemicals and drugs interact with genes involved in malignant transfromation |
| (DGIdb 4.0) |
| Entrez ID | Symbol | Category | Interaction Types | Drug Claim Name | Drug Name | PMIDs |
| 4036 | LRP2 | EXTERNAL SIDE OF PLASMA MEMBRANE, TRANSPORTER, KINASE | cisplatin | CISPLATIN | 23274376,31666714,17457342 |
| Page: 1 |

Copyright 2023-Present -The University of Texas Health Science Center at Houston |