| Tissue | Expression Dynamics | Abbreviation |
| Esophagus | 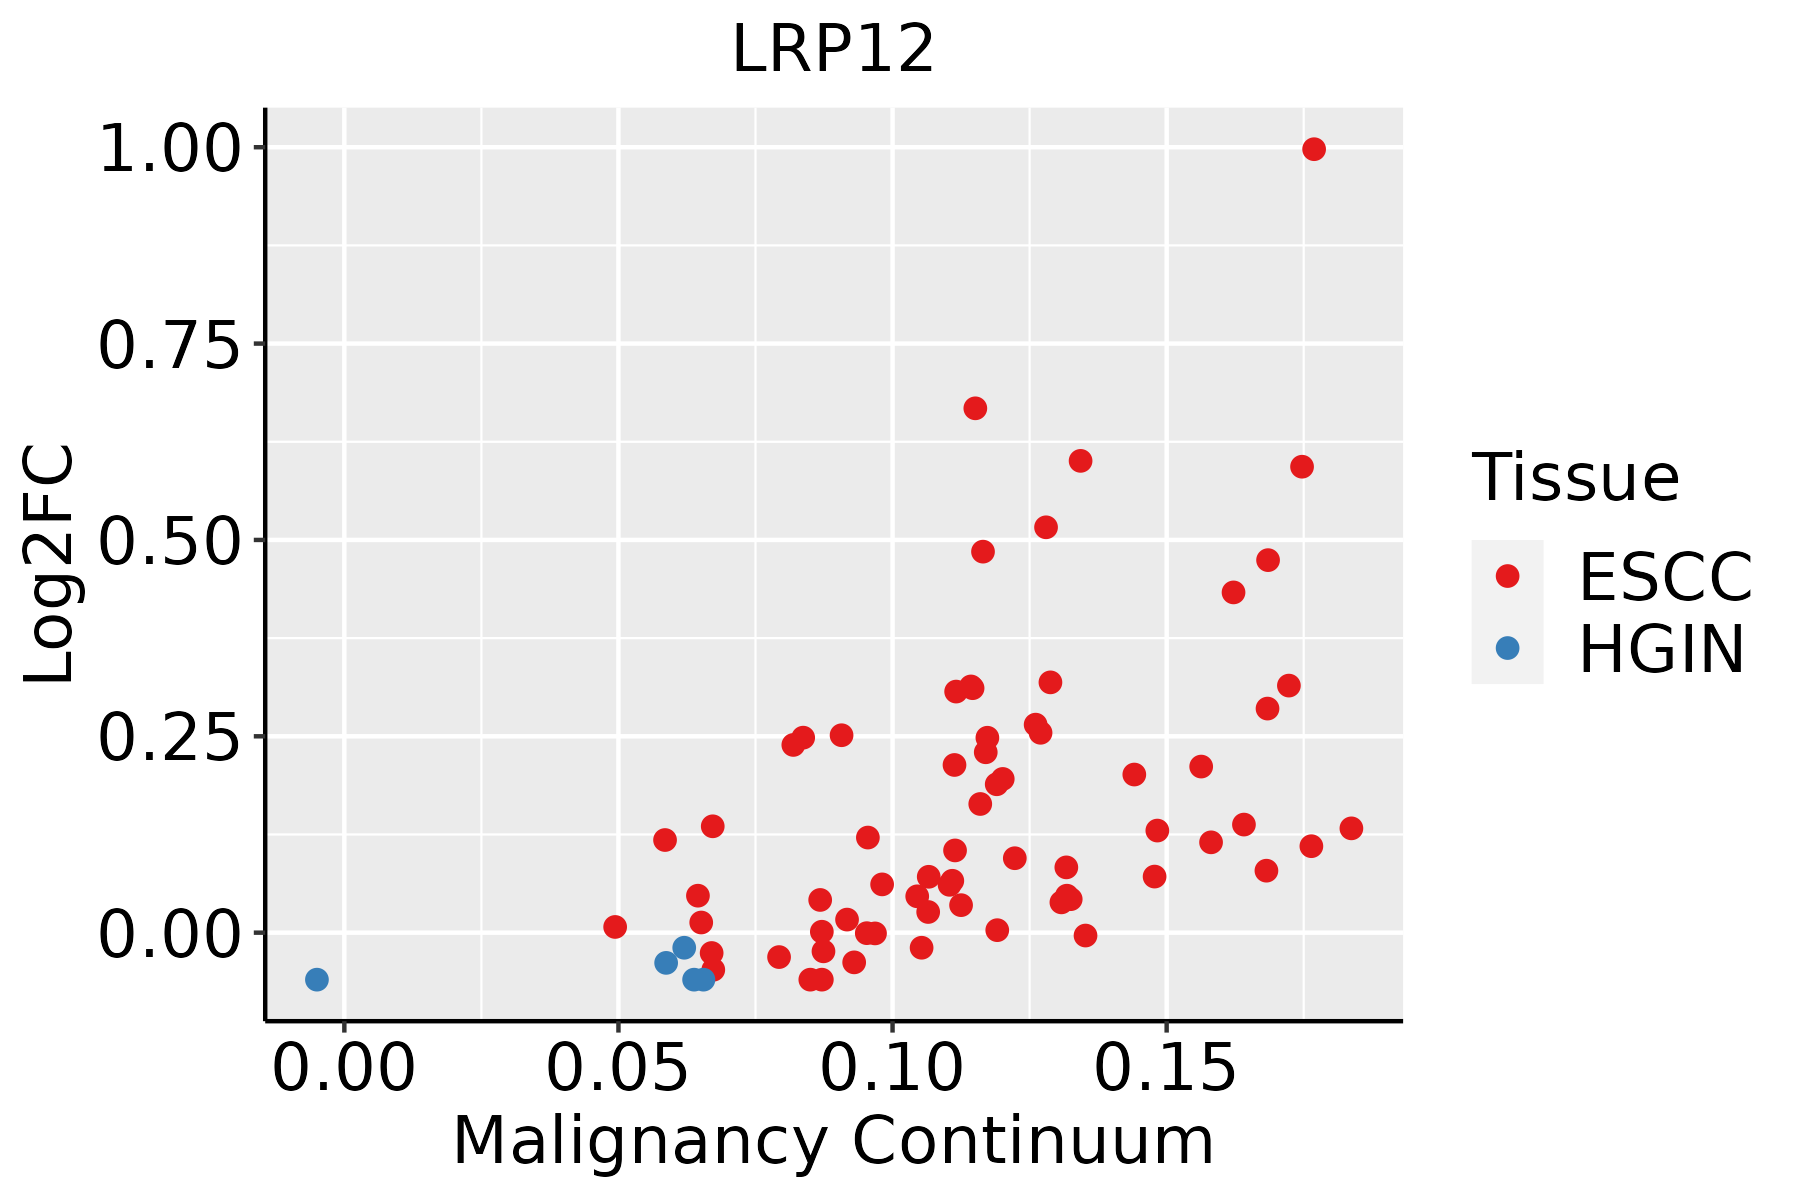 | ESCC: Esophageal squamous cell carcinoma |
| HGIN: High-grade intraepithelial neoplasias |
| LGIN: Low-grade intraepithelial neoplasias |
| Oral Cavity |  | EOLP: Erosive Oral lichen planus |
| LP: leukoplakia |
| NEOLP: Non-erosive oral lichen planus |
| OSCC: Oral squamous cell carcinoma |
| Thyroid | 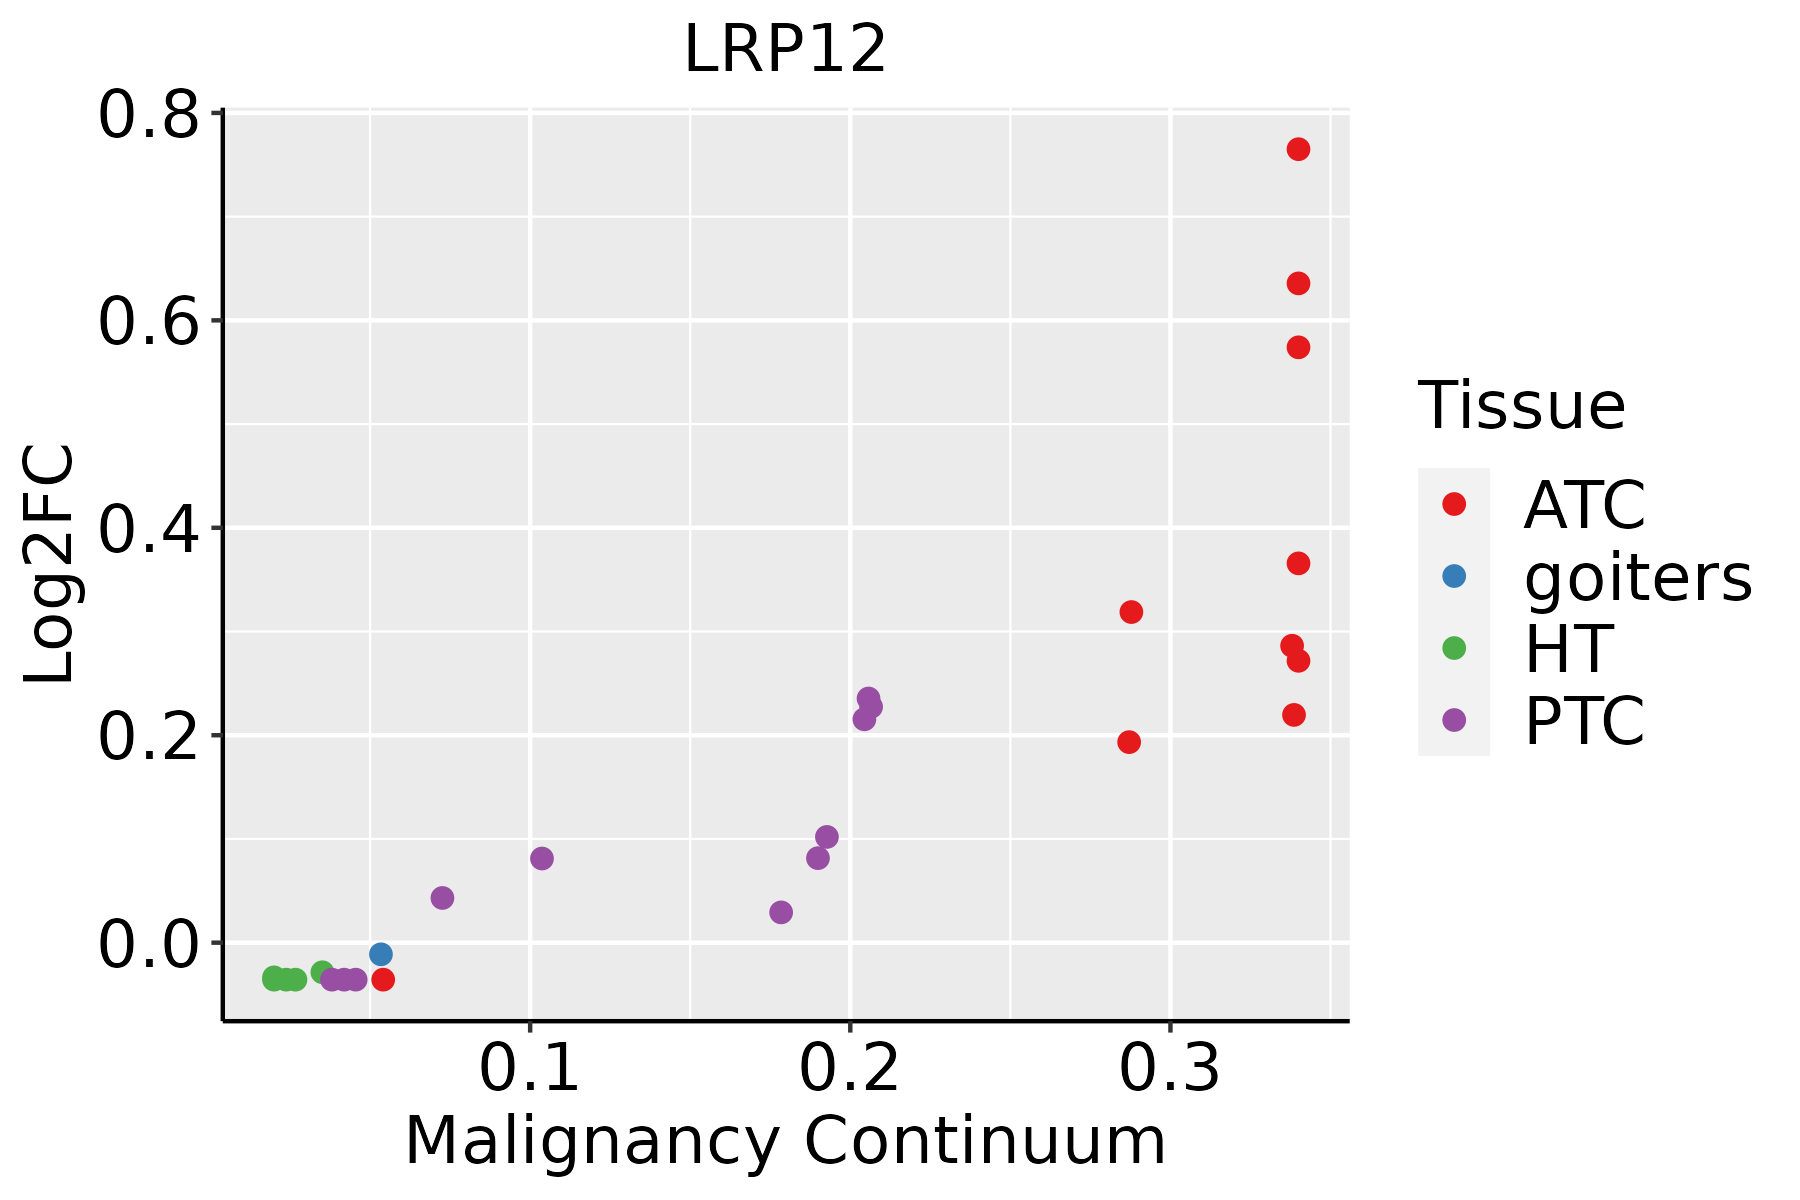 | ATC: Anaplastic thyroid cancer |
| HT: Hashimoto's thyroiditis |
| PTC: Papillary thyroid cancer |
| GO ID | Tissue | Disease Stage | Description | Gene Ratio | Bg Ratio | pvalue | p.adjust | Count |
| GO:004586222 | Liver | HCC | positive regulation of proteolysis | 232/7958 | 372/18723 | 5.66e-15 | 3.98e-13 | 232 |
| GO:001056322 | Liver | HCC | negative regulation of phosphorus metabolic process | 259/7958 | 442/18723 | 4.29e-12 | 1.92e-10 | 259 |
| GO:004593622 | Liver | HCC | negative regulation of phosphate metabolic process | 258/7958 | 441/18723 | 6.00e-12 | 2.60e-10 | 258 |
| GO:004232622 | Liver | HCC | negative regulation of phosphorylation | 227/7958 | 385/18723 | 3.98e-11 | 1.52e-09 | 227 |
| GO:000193322 | Liver | HCC | negative regulation of protein phosphorylation | 196/7958 | 342/18723 | 1.95e-08 | 4.63e-07 | 196 |
| GO:004328112 | Liver | HCC | regulation of cysteine-type endopeptidase activity involved in apoptotic process | 125/7958 | 209/18723 | 3.12e-07 | 5.42e-06 | 125 |
| GO:200011612 | Liver | HCC | regulation of cysteine-type endopeptidase activity | 137/7958 | 235/18723 | 6.91e-07 | 1.08e-05 | 137 |
| GO:005254722 | Liver | HCC | regulation of peptidase activity | 247/7958 | 461/18723 | 8.28e-07 | 1.27e-05 | 247 |
| GO:005254822 | Liver | HCC | regulation of endopeptidase activity | 230/7958 | 432/18723 | 3.58e-06 | 4.68e-05 | 230 |
| GO:000724912 | Liver | HCC | I-kappaB kinase/NF-kappaB signaling | 156/7958 | 281/18723 | 6.66e-06 | 8.00e-05 | 156 |
| GO:004312212 | Liver | HCC | regulation of I-kappaB kinase/NF-kappaB signaling | 138/7958 | 249/18723 | 2.47e-05 | 2.58e-04 | 138 |
| GO:001095212 | Liver | HCC | positive regulation of peptidase activity | 110/7958 | 197/18723 | 1.04e-04 | 8.98e-04 | 110 |
| GO:00467775 | Liver | HCC | protein autophosphorylation | 123/7958 | 227/18723 | 2.40e-04 | 1.80e-03 | 123 |
| GO:00434097 | Liver | HCC | negative regulation of MAPK cascade | 98/7958 | 180/18723 | 7.88e-04 | 4.74e-03 | 98 |
| GO:00510902 | Liver | HCC | regulation of DNA-binding transcription factor activity | 220/7958 | 440/18723 | 8.04e-04 | 4.82e-03 | 220 |
| GO:001095012 | Liver | HCC | positive regulation of endopeptidase activity | 96/7958 | 179/18723 | 1.68e-03 | 8.79e-03 | 96 |
| GO:19012242 | Liver | HCC | positive regulation of NIK/NF-kappaB signaling | 41/7958 | 69/18723 | 3.38e-03 | 1.54e-02 | 41 |
| GO:00380611 | Liver | HCC | NIK/NF-kappaB signaling | 77/7958 | 143/18723 | 3.98e-03 | 1.76e-02 | 77 |
| GO:004328012 | Liver | HCC | positive regulation of cysteine-type endopeptidase activity involved in apoptotic process | 70/7958 | 129/18723 | 4.58e-03 | 1.97e-02 | 70 |
| GO:200105612 | Liver | HCC | positive regulation of cysteine-type endopeptidase activity | 79/7958 | 148/18723 | 4.82e-03 | 2.03e-02 | 79 |
| Hugo Symbol | Variant Class | Variant Classification | dbSNP RS | HGVSc | HGVSp | HGVSp Short | SWISSPROT | BIOTYPE | SIFT | PolyPhen | Tumor Sample Barcode | Tissue | Histology | Sex | Age | Stage | Therapy Types | Drugs | Outcome |
| LRP12 | SNV | Missense_Mutation | rs776663032 | c.1946C>T | p.Ser649Phe | p.S649F | Q9Y561 | protein_coding | deleterious(0.01) | possibly_damaging(0.726) | TCGA-A2-A0D1-01 | Breast | breast invasive carcinoma | Female | >=65 | I/II | Chemotherapy | taxotere | SD |
| LRP12 | SNV | Missense_Mutation | rs147788045 | c.2048N>T | p.Thr683Met | p.T683M | Q9Y561 | protein_coding | deleterious(0.01) | possibly_damaging(0.513) | TCGA-A7-A0CJ-01 | Breast | breast invasive carcinoma | Female | <65 | I/II | Chemotherapy | cytoxan | SD |
| LRP12 | SNV | Missense_Mutation | | c.2369N>C | p.Asp790Ala | p.D790A | Q9Y561 | protein_coding | deleterious_low_confidence(0.01) | benign(0.057) | TCGA-A8-A06Z-01 | Breast | breast invasive carcinoma | Female | >=65 | I/II | Unknown | Unknown | SD |
| LRP12 | SNV | Missense_Mutation | rs375726206 | c.2554N>A | p.Asp852Asn | p.D852N | Q9Y561 | protein_coding | deleterious_low_confidence(0) | probably_damaging(0.984) | TCGA-AC-A3W6-01 | Breast | breast invasive carcinoma | Female | >=65 | III/IV | Unknown | Unknown | SD |
| LRP12 | SNV | Missense_Mutation | | c.428N>T | p.Ser143Leu | p.S143L | Q9Y561 | protein_coding | deleterious(0) | probably_damaging(0.992) | TCGA-AC-A4ZE-01 | Breast | breast invasive carcinoma | Female | <65 | I/II | Unknown | Unknown | SD |
| LRP12 | SNV | Missense_Mutation | novel | c.1577G>A | p.Arg526Lys | p.R526K | Q9Y561 | protein_coding | tolerated(0.73) | probably_damaging(0.952) | TCGA-AC-A5XS-01 | Breast | breast invasive carcinoma | Female | >=65 | I/II | Hormone Therapy | femara | SD |
| LRP12 | SNV | Missense_Mutation | | c.1015N>A | p.Ala339Thr | p.A339T | Q9Y561 | protein_coding | tolerated(0.22) | benign(0.047) | TCGA-B6-A0IA-01 | Breast | breast invasive carcinoma | Female | <65 | I/II | Unknown | Unknown | SD |
| LRP12 | SNV | Missense_Mutation | | c.586G>A | p.Asp196Asn | p.D196N | Q9Y561 | protein_coding | deleterious(0.02) | probably_damaging(0.996) | TCGA-GM-A2DA-01 | Breast | breast invasive carcinoma | Female | <65 | I/II | Chemotherapy | fluorouracil | PD |
| LRP12 | SNV | Missense_Mutation | | c.922G>T | p.Gly308Cys | p.G308C | Q9Y561 | protein_coding | deleterious_low_confidence(0) | probably_damaging(0.975) | TCGA-S3-AA17-01 | Breast | breast invasive carcinoma | Female | <65 | I/II | Hormone Therapy | anastrozole | SD |
| LRP12 | deletion | Frame_Shift_Del | rs35928649 | c.1351delN | p.Cys451AlafsTer37 | p.C451Afs*37 | Q9Y561 | protein_coding | | | TCGA-A8-A09Z-01 | Breast | breast invasive carcinoma | Female | >=65 | I/II | Unknown | Unknown | SD |


