
|
|||||
|
 | |
| |
| |
| |
| |
| |
|
Gene: LRP1 |
Gene summary for LRP1 |
| Gene information | Species | Human | Gene symbol | LRP1 | Gene ID | 4035 |
| Gene name | LDL receptor related protein 1 | |
| Gene Alias | A2MR | |
| Cytomap | 12q13.3 | |
| Gene Type | protein-coding | GO ID | GO:0000165 | UniProtAcc | Q07954 |
Top |
Malignant transformation analysis |
| Identification of the aberrant gene expression in precancerous and cancerous lesions by comparing the gene expression of stem-like cells in diseased tissues with normal stem cells |
| Entrez ID | Symbol | Replicates | Species | Organ | Tissue | Adj P-value | Log2FC | Malignancy |
| 4035 | LRP1 | CA_HPV_3 | Human | Cervix | CC | 1.24e-03 | -1.44e-02 | 0.0414 |
| 4035 | LRP1 | CCI_1 | Human | Cervix | CC | 2.83e-03 | 9.08e-01 | 0.528 |
| 4035 | LRP1 | CCI_3 | Human | Cervix | CC | 7.50e-20 | 1.34e+00 | 0.516 |
| 4035 | LRP1 | sample3 | Human | Cervix | CC | 7.98e-24 | 4.17e-01 | 0.1387 |
| 4035 | LRP1 | T3 | Human | Cervix | CC | 1.68e-13 | 4.17e-01 | 0.1389 |
| 4035 | LRP1 | HTA11_2487_2000001011 | Human | Colorectum | SER | 8.12e-03 | 3.26e-01 | -0.1808 |
| 4035 | LRP1 | HTA11_1938_2000001011 | Human | Colorectum | AD | 1.69e-05 | 3.99e-01 | -0.0811 |
| 4035 | LRP1 | HTA11_347_2000001011 | Human | Colorectum | AD | 3.82e-09 | 4.38e-01 | -0.1954 |
| 4035 | LRP1 | HTA11_411_2000001011 | Human | Colorectum | SER | 3.93e-05 | 7.58e-01 | -0.2602 |
| 4035 | LRP1 | HTA11_3361_2000001011 | Human | Colorectum | AD | 3.40e-03 | 3.21e-01 | -0.1207 |
| 4035 | LRP1 | HTA11_696_2000001011 | Human | Colorectum | AD | 1.14e-15 | 5.67e-01 | -0.1464 |
| 4035 | LRP1 | HTA11_866_2000001011 | Human | Colorectum | AD | 3.86e-16 | 5.03e-01 | -0.1001 |
| 4035 | LRP1 | HTA11_1391_2000001011 | Human | Colorectum | AD | 5.71e-09 | 5.78e-01 | -0.059 |
| 4035 | LRP1 | HTA11_546_2000001011 | Human | Colorectum | AD | 4.78e-06 | 5.47e-01 | -0.0842 |
| 4035 | LRP1 | HTA11_866_3004761011 | Human | Colorectum | AD | 1.76e-10 | 4.06e-01 | 0.096 |
| 4035 | LRP1 | HTA11_7696_3000711011 | Human | Colorectum | AD | 1.26e-06 | 3.56e-01 | 0.0674 |
| 4035 | LRP1 | HTA11_99999971662_82457 | Human | Colorectum | MSS | 8.52e-10 | 5.27e-01 | 0.3859 |
| 4035 | LRP1 | HTA11_99999974143_84620 | Human | Colorectum | MSS | 3.16e-05 | 3.15e-01 | 0.3005 |
| 4035 | LRP1 | A015-C-203 | Human | Colorectum | FAP | 1.69e-03 | 4.88e-02 | -0.1294 |
| 4035 | LRP1 | A002-C-021 | Human | Colorectum | FAP | 3.69e-03 | 2.68e-01 | 0.1171 |
| Page: 1 2 3 4 5 6 |
| Tissue | Expression Dynamics | Abbreviation |
| Cervix |  | CC: Cervix cancer |
| HSIL_HPV: HPV-infected high-grade squamous intraepithelial lesions | ||
| N_HPV: HPV-infected normal cervix | ||
| Colorectum (GSE201348) |  | FAP: Familial adenomatous polyposis |
| CRC: Colorectal cancer | ||
| Colorectum (HTA11) |  | AD: Adenomas |
| SER: Sessile serrated lesions | ||
| MSI-H: Microsatellite-high colorectal cancer | ||
| MSS: Microsatellite stable colorectal cancer | ||
| Esophagus | 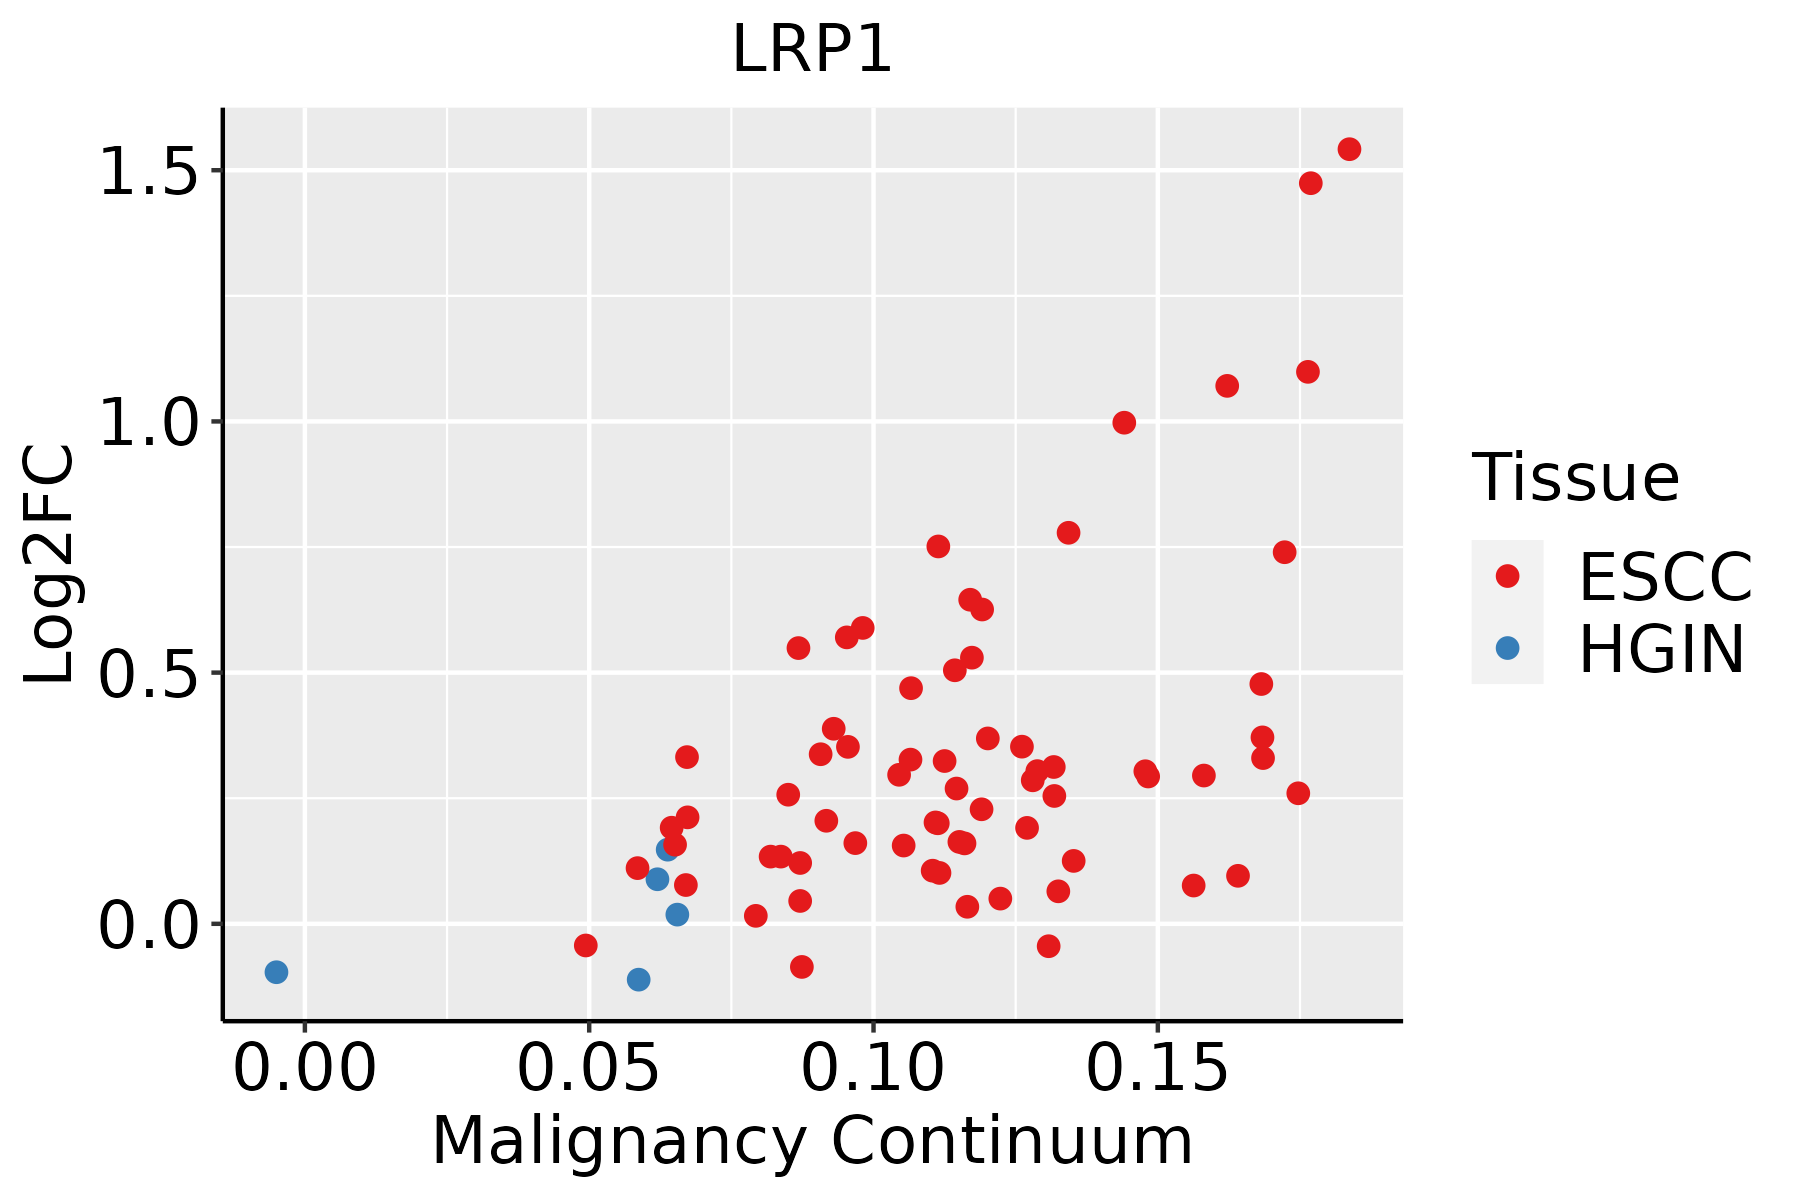 | ESCC: Esophageal squamous cell carcinoma |
| HGIN: High-grade intraepithelial neoplasias | ||
| LGIN: Low-grade intraepithelial neoplasias | ||
| Liver | 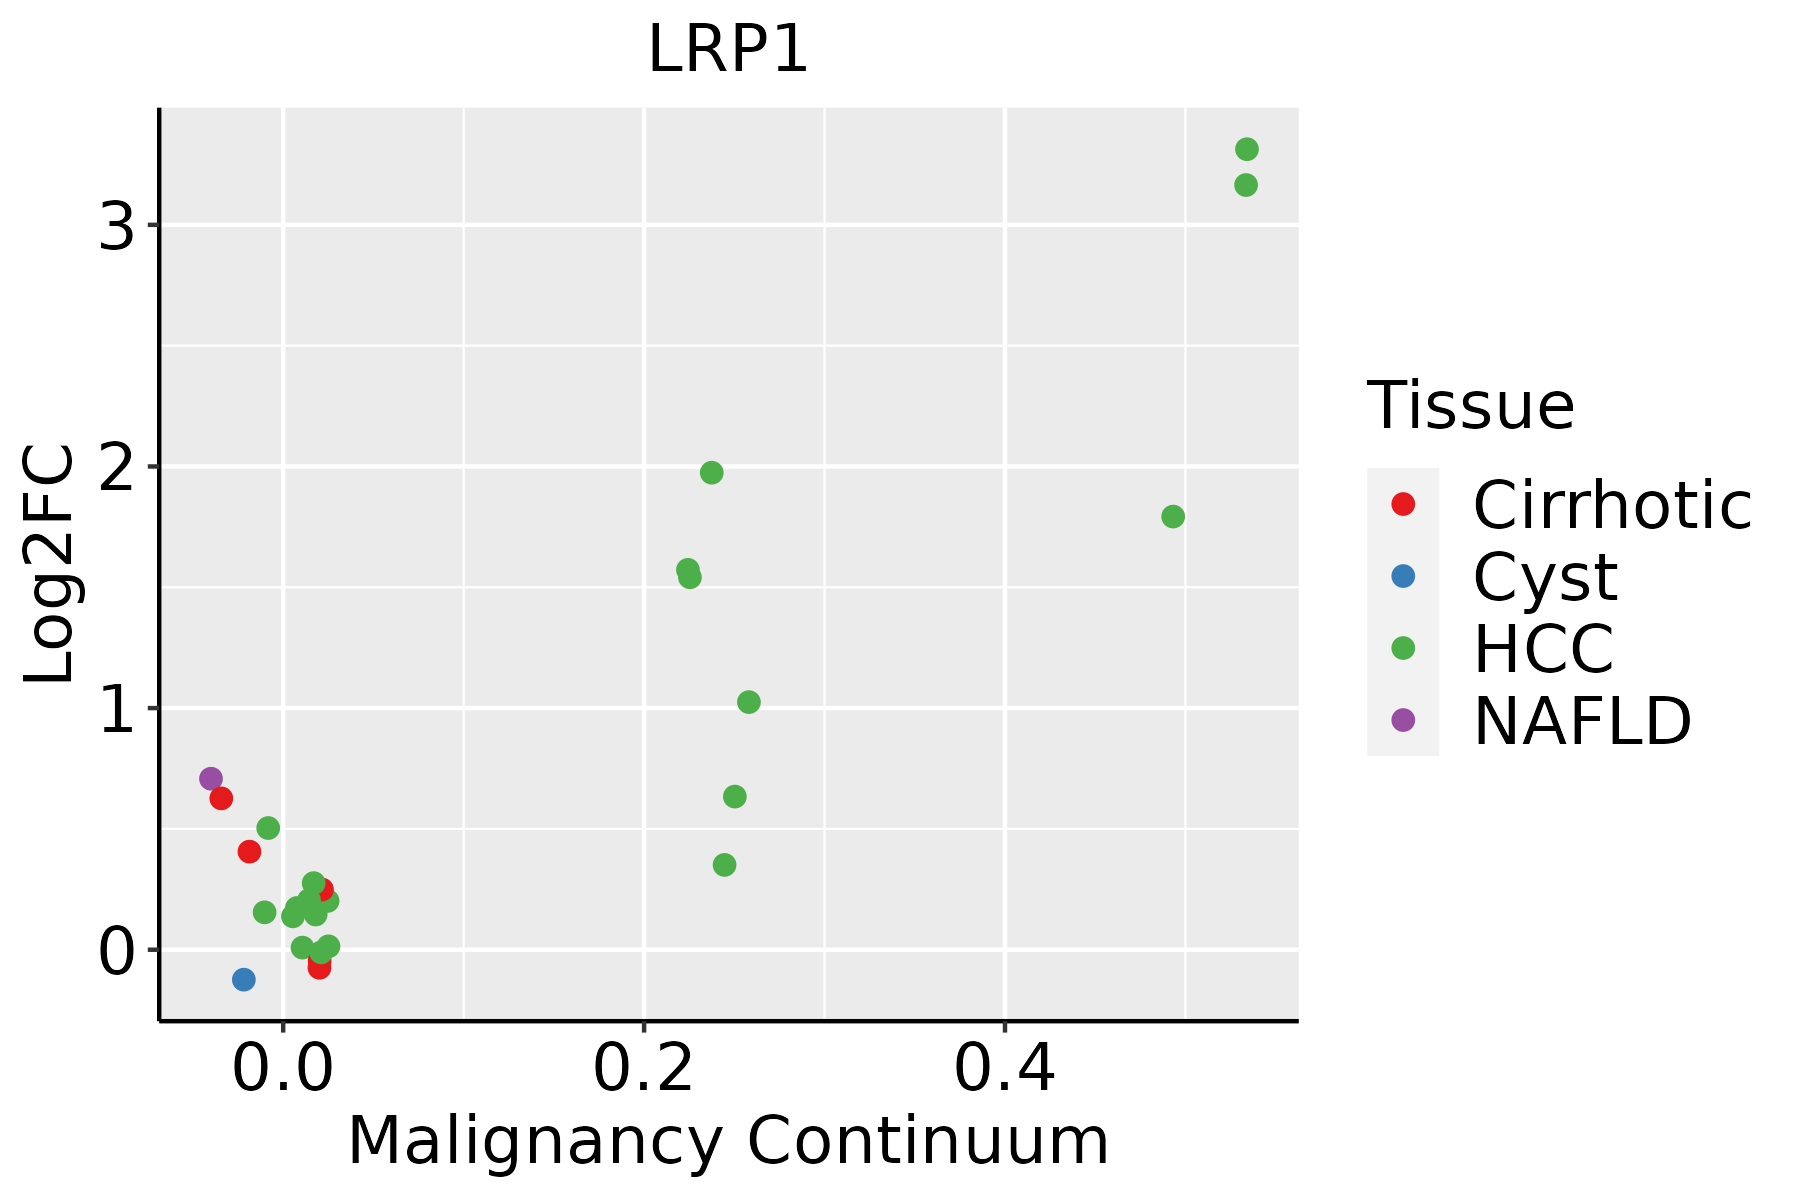 | HCC: Hepatocellular carcinoma |
| NAFLD: Non-alcoholic fatty liver disease | ||
| Oral Cavity | 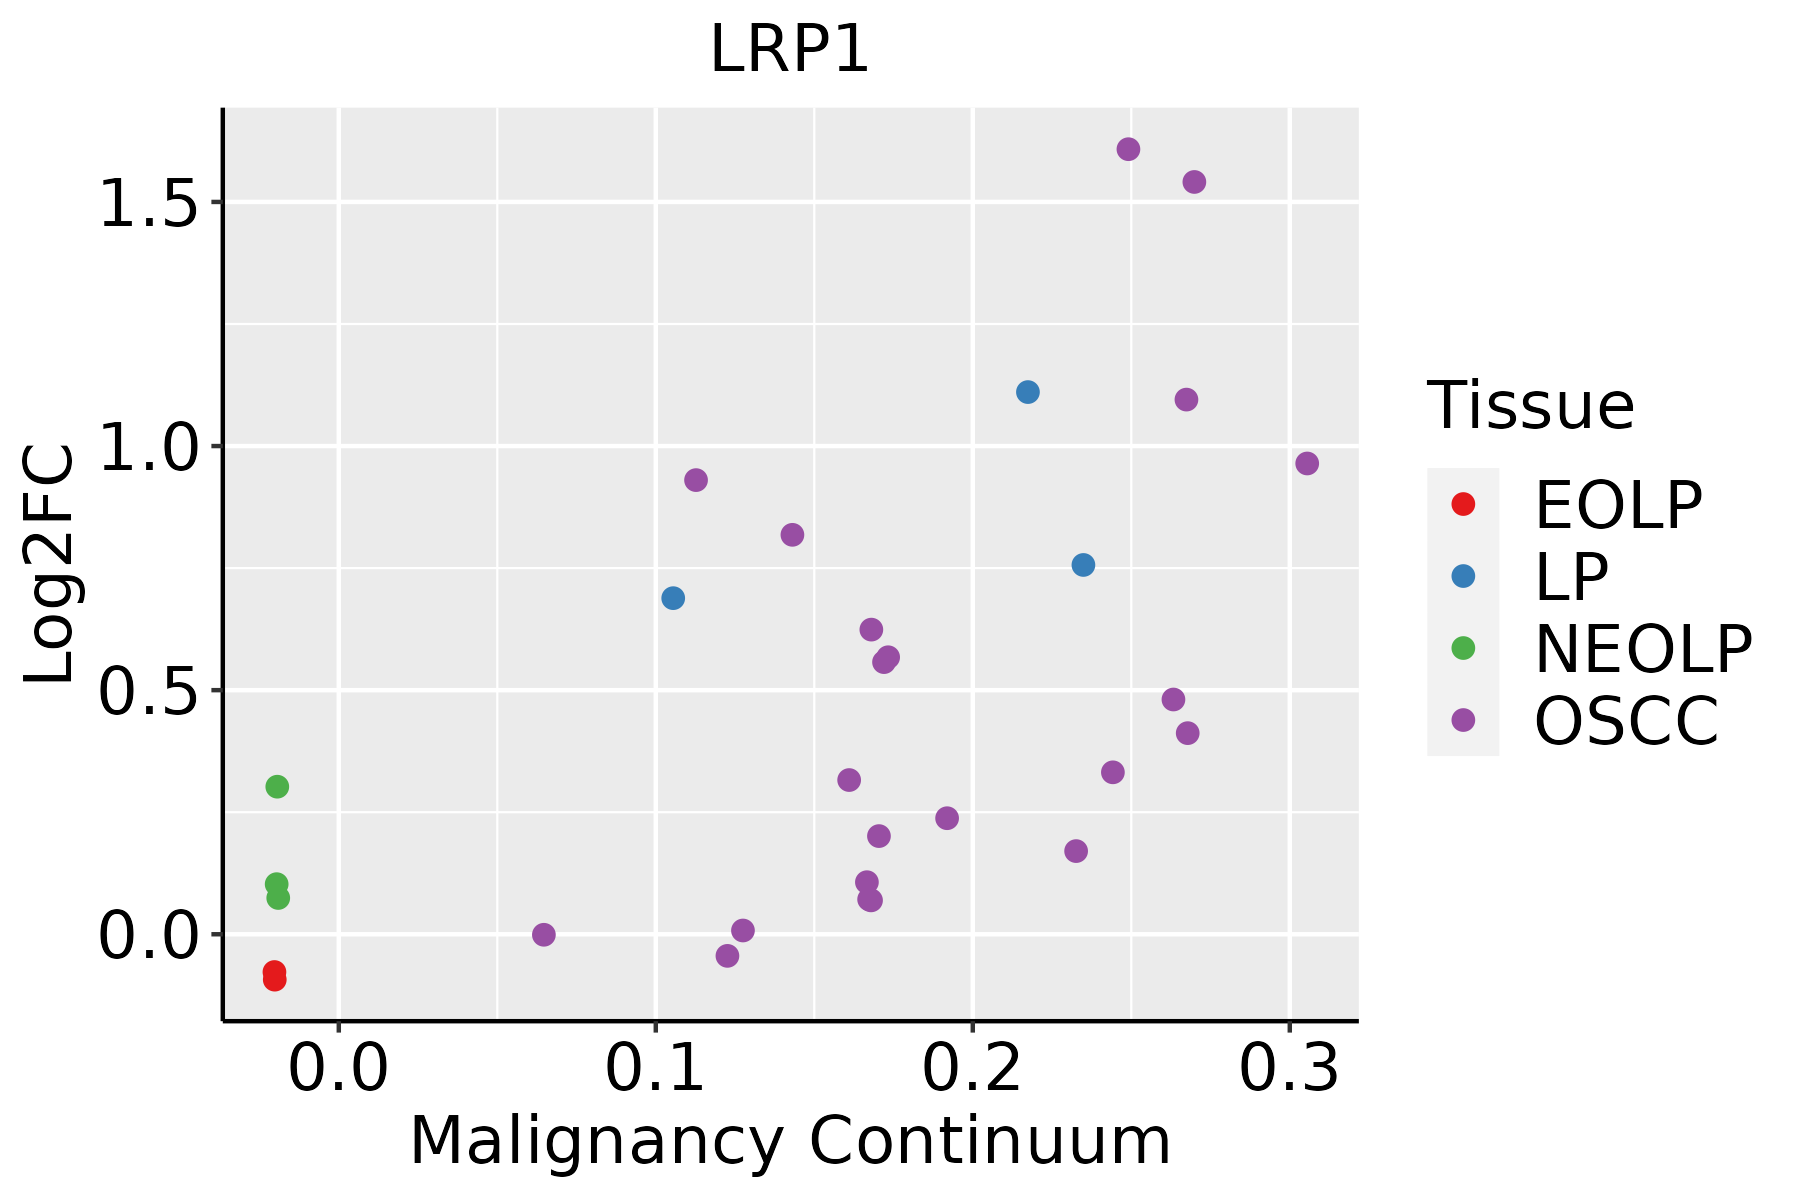 | EOLP: Erosive Oral lichen planus |
| LP: leukoplakia | ||
| NEOLP: Non-erosive oral lichen planus | ||
| OSCC: Oral squamous cell carcinoma | ||
| Thyroid | 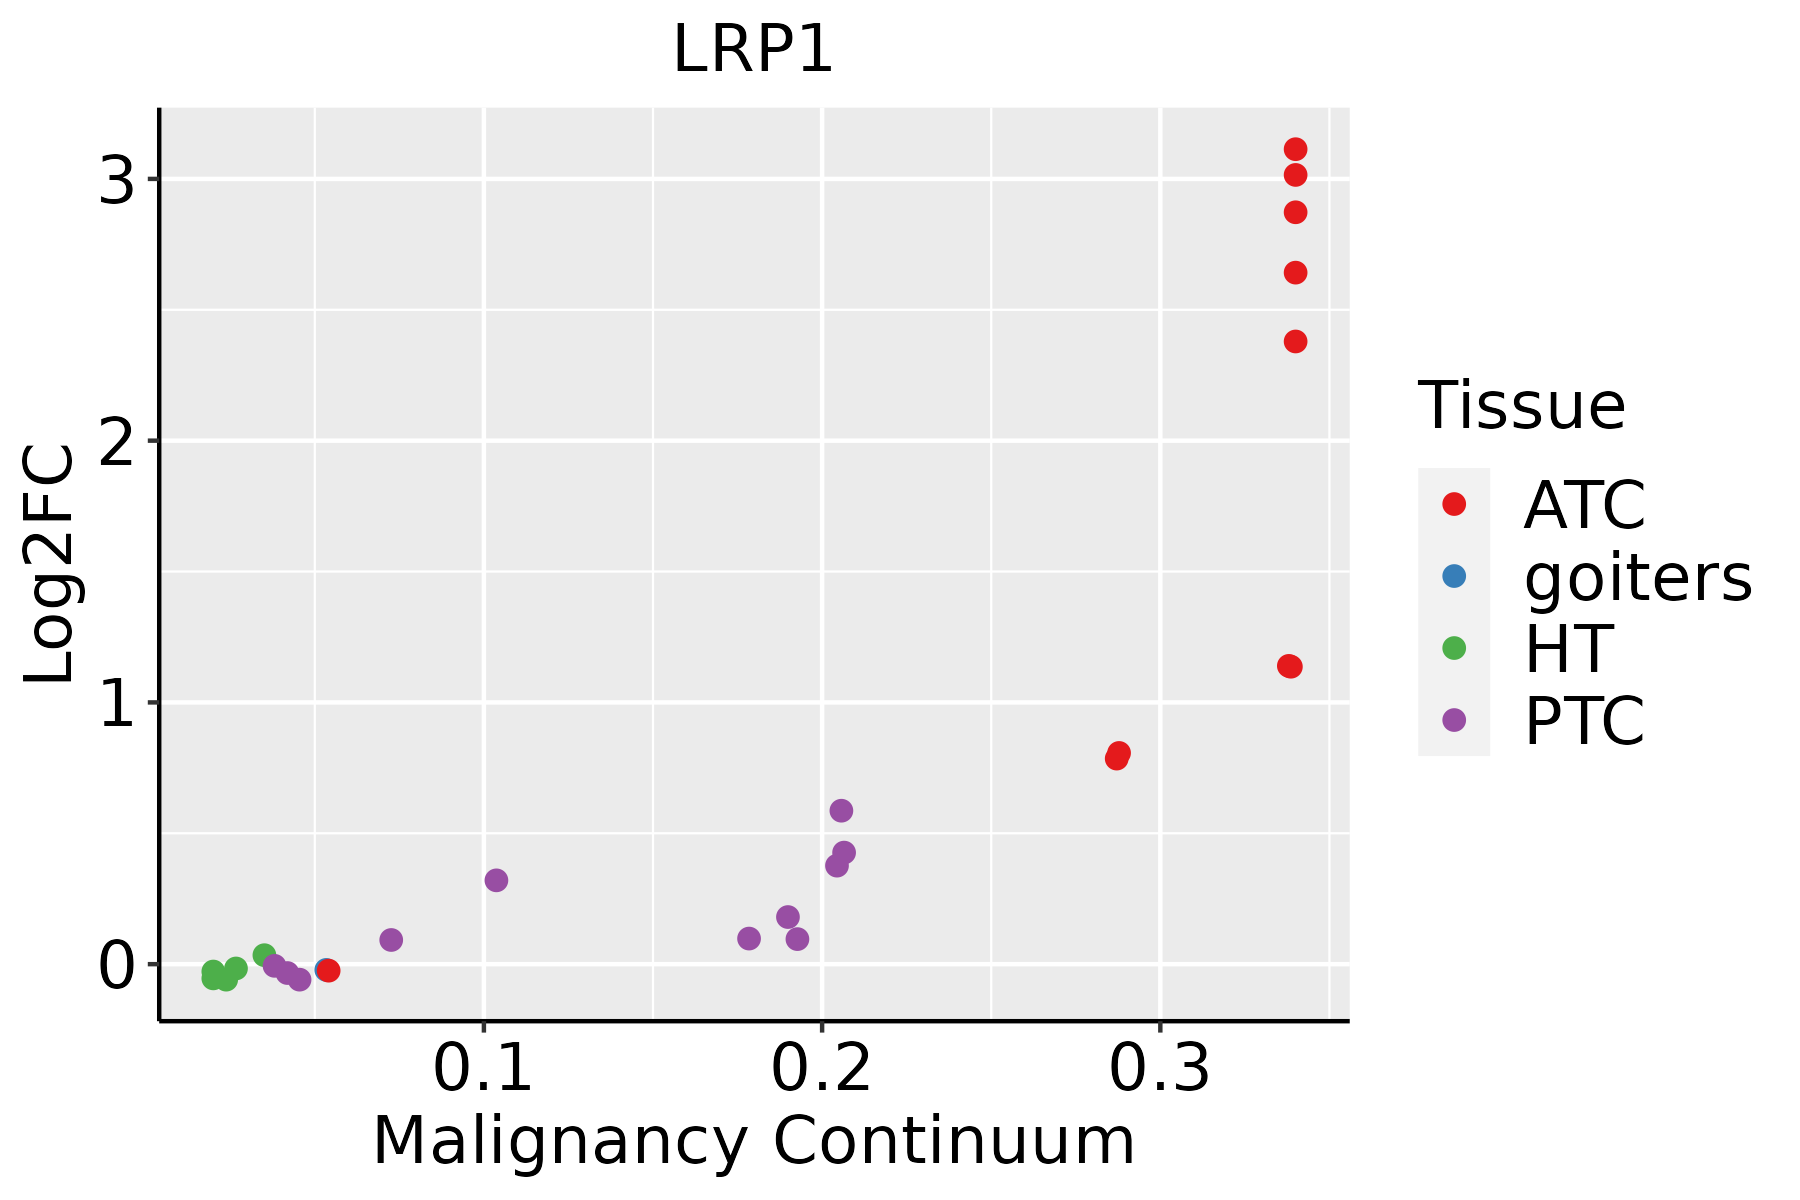 | ATC: Anaplastic thyroid cancer |
| HT: Hashimoto's thyroiditis | ||
| PTC: Papillary thyroid cancer |
| ∗log2FC in expression of this searched gene in stem-like cells from each diseased tissue sample relative to stem-like cells in normal samples in each tissue plotted against the malignancy continuum. Samples are colored based on if they are from different disease stage. |
Top |
Malignant transformation related pathway analysis |
| Find out the enriched GO biological processes and KEGG pathways involved in transition from healthy to precancer to cancer |
| Tissue | Disease Stage | Enriched GO biological Processes |
| Colorectum | AD |  |
| Colorectum | SER |  |
| Colorectum | MSS |  |
| Colorectum | MSI-H |  |
| Colorectum | FAP |  |
| ∗Top 15 enriched GO BP terms are showed in the bar plot of each disease state in each tissue. Each row represents a significant GO biological process which is colored according to the -log10(p.adjust). |
| Page: 1 2 3 4 5 6 7 8 9 |
| GO ID | Tissue | Disease Stage | Description | Gene Ratio | Bg Ratio | pvalue | p.adjust | Count |
| GO:004217610 | Cervix | CC | regulation of protein catabolic process | 104/2311 | 391/18723 | 9.39e-15 | 9.36e-12 | 104 |
| GO:001081010 | Cervix | CC | regulation of cell-substrate adhesion | 69/2311 | 221/18723 | 8.57e-14 | 5.69e-11 | 69 |
| GO:00315898 | Cervix | CC | cell-substrate adhesion | 96/2311 | 363/18723 | 1.48e-13 | 8.85e-11 | 96 |
| GO:005254710 | Cervix | CC | regulation of peptidase activity | 112/2311 | 461/18723 | 6.70e-13 | 3.08e-10 | 112 |
| GO:190336210 | Cervix | CC | regulation of cellular protein catabolic process | 72/2311 | 255/18723 | 5.98e-12 | 2.10e-09 | 72 |
| GO:003297010 | Cervix | CC | regulation of actin filament-based process | 96/2311 | 397/18723 | 4.00e-11 | 8.54e-09 | 96 |
| GO:004573210 | Cervix | CC | positive regulation of protein catabolic process | 65/2311 | 231/18723 | 7.44e-11 | 1.39e-08 | 65 |
| GO:190382910 | Cervix | CC | positive regulation of cellular protein localization | 72/2311 | 276/18723 | 3.20e-10 | 4.46e-08 | 72 |
| GO:01501159 | Cervix | CC | cell-substrate junction organization | 37/2311 | 101/18723 | 3.20e-10 | 4.46e-08 | 37 |
| GO:007265910 | Cervix | CC | protein localization to plasma membrane | 73/2311 | 284/18723 | 4.95e-10 | 6.73e-08 | 73 |
| GO:000989610 | Cervix | CC | positive regulation of catabolic process | 109/2311 | 492/18723 | 5.26e-10 | 6.99e-08 | 109 |
| GO:003295610 | Cervix | CC | regulation of actin cytoskeleton organization | 86/2311 | 358/18723 | 5.90e-10 | 7.51e-08 | 86 |
| GO:00070448 | Cervix | CC | cell-substrate junction assembly | 34/2311 | 95/18723 | 3.35e-09 | 3.45e-07 | 34 |
| GO:00160557 | Cervix | CC | Wnt signaling pathway | 98/2311 | 444/18723 | 4.82e-09 | 4.65e-07 | 98 |
| GO:00321035 | Cervix | CC | positive regulation of response to external stimulus | 95/2311 | 427/18723 | 5.44e-09 | 5.03e-07 | 95 |
| GO:01987387 | Cervix | CC | cell-cell signaling by wnt | 98/2311 | 446/18723 | 6.16e-09 | 5.58e-07 | 98 |
| GO:19907788 | Cervix | CC | protein localization to cell periphery | 78/2311 | 333/18723 | 1.22e-08 | 9.73e-07 | 78 |
| GO:00019528 | Cervix | CC | regulation of cell-matrix adhesion | 40/2311 | 128/18723 | 1.32e-08 | 1.04e-06 | 40 |
| GO:00071608 | Cervix | CC | cell-matrix adhesion | 60/2311 | 233/18723 | 1.58e-08 | 1.23e-06 | 60 |
| GO:00071626 | Cervix | CC | negative regulation of cell adhesion | 72/2311 | 303/18723 | 2.36e-08 | 1.70e-06 | 72 |
| Page: 1 2 3 4 5 6 7 8 9 10 11 12 13 14 15 16 17 18 19 20 21 22 23 24 25 26 27 28 29 30 31 32 33 34 35 36 37 38 39 40 41 42 43 44 45 46 47 48 49 50 51 52 53 54 55 56 57 58 59 60 61 62 63 64 65 66 67 68 69 70 71 72 73 74 75 76 77 78 79 80 81 82 83 84 85 86 87 88 89 |
| Pathway ID | Tissue | Disease Stage | Description | Gene Ratio | Bg Ratio | pvalue | p.adjust | qvalue | Count |
| hsa0501018 | Cervix | CC | Alzheimer disease | 113/1267 | 384/8465 | 9.67e-14 | 3.92e-12 | 2.32e-12 | 113 |
| hsa0501019 | Cervix | CC | Alzheimer disease | 113/1267 | 384/8465 | 9.67e-14 | 3.92e-12 | 2.32e-12 | 113 |
| hsa05010 | Colorectum | AD | Alzheimer disease | 174/2092 | 384/8465 | 1.82e-19 | 9.26e-18 | 5.91e-18 | 174 |
| hsa050101 | Colorectum | AD | Alzheimer disease | 174/2092 | 384/8465 | 1.82e-19 | 9.26e-18 | 5.91e-18 | 174 |
| hsa050102 | Colorectum | SER | Alzheimer disease | 146/1580 | 384/8465 | 6.52e-20 | 2.40e-18 | 1.75e-18 | 146 |
| hsa050103 | Colorectum | SER | Alzheimer disease | 146/1580 | 384/8465 | 6.52e-20 | 2.40e-18 | 1.75e-18 | 146 |
| hsa050104 | Colorectum | MSS | Alzheimer disease | 169/1875 | 384/8465 | 1.21e-22 | 1.01e-20 | 6.21e-21 | 169 |
| hsa050105 | Colorectum | MSS | Alzheimer disease | 169/1875 | 384/8465 | 1.21e-22 | 1.01e-20 | 6.21e-21 | 169 |
| hsa050108 | Colorectum | FAP | Alzheimer disease | 105/1404 | 384/8465 | 3.74e-08 | 1.04e-06 | 6.33e-07 | 105 |
| hsa050109 | Colorectum | FAP | Alzheimer disease | 105/1404 | 384/8465 | 3.74e-08 | 1.04e-06 | 6.33e-07 | 105 |
| hsa05010210 | Esophagus | ESCC | Alzheimer disease | 263/4205 | 384/8465 | 1.80e-14 | 5.47e-13 | 2.80e-13 | 263 |
| hsa0501038 | Esophagus | ESCC | Alzheimer disease | 263/4205 | 384/8465 | 1.80e-14 | 5.47e-13 | 2.80e-13 | 263 |
| hsa049796 | Liver | NAFLD | Cholesterol metabolism | 20/1043 | 51/8465 | 9.73e-07 | 4.56e-05 | 3.67e-05 | 20 |
| hsa0497911 | Liver | NAFLD | Cholesterol metabolism | 20/1043 | 51/8465 | 9.73e-07 | 4.56e-05 | 3.67e-05 | 20 |
| hsa0501014 | Liver | Cirrhotic | Alzheimer disease | 180/2530 | 384/8465 | 5.52e-13 | 1.36e-11 | 8.36e-12 | 180 |
| hsa049792 | Liver | Cirrhotic | Cholesterol metabolism | 30/2530 | 51/8465 | 1.59e-05 | 1.39e-04 | 8.60e-05 | 30 |
| hsa0501015 | Liver | Cirrhotic | Alzheimer disease | 180/2530 | 384/8465 | 5.52e-13 | 1.36e-11 | 8.36e-12 | 180 |
| hsa049793 | Liver | Cirrhotic | Cholesterol metabolism | 30/2530 | 51/8465 | 1.59e-05 | 1.39e-04 | 8.60e-05 | 30 |
| hsa0501022 | Liver | HCC | Alzheimer disease | 254/4020 | 384/8465 | 3.75e-14 | 8.97e-13 | 4.99e-13 | 254 |
| hsa049794 | Liver | HCC | Cholesterol metabolism | 41/4020 | 51/8465 | 1.33e-06 | 1.35e-05 | 7.49e-06 | 41 |
| Page: 1 2 |
Top |
Cell-cell communication analysis |
| Identification of potential cell-cell interactions between two cell types and their ligand-receptor pairs for different disease states |
| Ligand | Receptor | LRpair | Pathway | Tissue | Disease Stage |
| MDK | LRP1 | MDK_LRP1 | MK | Breast | DCIS |
| MDK | LRP1 | MDK_LRP1 | MK | Breast | Healthy |
| MDK | LRP1 | MDK_LRP1 | MK | Breast | IDC |
| MDK | LRP1 | MDK_LRP1 | MK | Breast | Precancer |
| MDK | LRP1 | MDK_LRP1 | MK | Cervix | ADJ |
| MDK | LRP1 | MDK_LRP1 | MK | Cervix | CC |
| MDK | LRP1 | MDK_LRP1 | MK | Cervix | Healthy |
| MDK | LRP1 | MDK_LRP1 | MK | Cervix | Precancer |
| MDK | LRP1 | MDK_LRP1 | MK | CRC | AD |
| MDK | LRP1 | MDK_LRP1 | MK | CRC | ADJ |
| MDK | LRP1 | MDK_LRP1 | MK | CRC | MSI-H |
| MDK | LRP1 | MDK_LRP1 | MK | CRC | MSS |
| MDK | LRP1 | MDK_LRP1 | MK | CRC | SER |
| MDK | LRP1 | MDK_LRP1 | MK | Endometrium | ADJ |
| MDK | LRP1 | MDK_LRP1 | MK | Endometrium | AEH |
| MDK | LRP1 | MDK_LRP1 | MK | Endometrium | EEC |
| MDK | LRP1 | MDK_LRP1 | MK | Endometrium | Healthy |
| MDK | LRP1 | MDK_LRP1 | MK | Esophagus | ESCC |
| MDK | LRP1 | MDK_LRP1 | MK | Esophagus | Healthy |
| MDK | LRP1 | MDK_LRP1 | MK | GC | ADJ |
| Page: 1 |
Top |
Single-cell gene regulatory network inference analysis |
| Find out the significant the regulons (TFs) and the target genes of each regulon across cell types for different disease states |
| TF | Cell Type | Tissue | Disease Stage | Target Gene | RSS | Regulon Activity |
| ∗The dot plots of a searched regulon are shown for all cell subpopulations in each disease state of each tissue based on the regulon specific score inferred using pySCENIC and by calculating the average expression. |
| Page: 1 |
Top |
Somatic mutation of malignant transformation related genes |
| Annotation of somatic variants for genes involved in malignant transformation |
| Hugo Symbol | Variant Class | Variant Classification | dbSNP RS | HGVSc | HGVSp | HGVSp Short | SWISSPROT | BIOTYPE | SIFT | PolyPhen | Tumor Sample Barcode | Tissue | Histology | Sex | Age | Stage | Therapy Types | Drugs | Outcome |
| LRP1 | SNV | Missense_Mutation | novel | c.1064N>A | p.Gly355Glu | p.G355E | Q07954 | protein_coding | deleterious(0) | probably_damaging(0.998) | TCGA-A1-A0SH-01 | Breast | breast invasive carcinoma | Female | <65 | I/II | Chemotherapy | tc | SD |
| LRP1 | SNV | Missense_Mutation | rs769600453 | c.11248N>T | p.Arg3750Trp | p.R3750W | Q07954 | protein_coding | deleterious(0.01) | possibly_damaging(0.545) | TCGA-A1-A0SN-01 | Breast | breast invasive carcinoma | Female | <65 | I/II | Chemotherapy | ac | SD |
| LRP1 | SNV | Missense_Mutation | rs748577199 | c.2461N>C | p.Thr821Pro | p.T821P | Q07954 | protein_coding | tolerated(0.06) | benign(0.276) | TCGA-A2-A0CS-01 | Breast | breast invasive carcinoma | Female | >=65 | III/IV | Hormone Therapy | anastrozole | SD |
| LRP1 | SNV | Missense_Mutation | c.8327C>T | p.Pro2776Leu | p.P2776L | Q07954 | protein_coding | tolerated(0.08) | benign(0.049) | TCGA-A2-A1G4-01 | Breast | breast invasive carcinoma | Female | >=65 | III/IV | Chemotherapy | adriamycin | SD | |
| LRP1 | SNV | Missense_Mutation | c.13037G>T | p.Arg4346Leu | p.R4346L | Q07954 | protein_coding | tolerated(0.14) | benign(0.069) | TCGA-A2-A25A-01 | Breast | breast invasive carcinoma | Female | <65 | I/II | Unspecific | Cytoxan | SD | |
| LRP1 | SNV | Missense_Mutation | novel | c.2440N>C | p.Cys814Arg | p.C814R | Q07954 | protein_coding | deleterious(0) | probably_damaging(0.986) | TCGA-A2-A3Y0-01 | Breast | breast invasive carcinoma | Female | <65 | I/II | Chemotherapy | adriamycin | CR |
| LRP1 | SNV | Missense_Mutation | novel | c.2441N>T | p.Cys814Phe | p.C814F | Q07954 | protein_coding | deleterious(0) | probably_damaging(0.986) | TCGA-A2-A3Y0-01 | Breast | breast invasive carcinoma | Female | <65 | I/II | Chemotherapy | adriamycin | CR |
| LRP1 | SNV | Missense_Mutation | c.4843G>A | p.Asp1615Asn | p.D1615N | Q07954 | protein_coding | deleterious(0.03) | probably_damaging(0.985) | TCGA-A8-A076-01 | Breast | breast invasive carcinoma | Female | >=65 | I/II | Hormone Therapy | anastrozole | SD | |
| LRP1 | SNV | Missense_Mutation | rs761146982 | c.5119N>G | p.Leu1707Val | p.L1707V | Q07954 | protein_coding | deleterious(0.05) | probably_damaging(0.967) | TCGA-A8-A08L-01 | Breast | breast invasive carcinoma | Female | >=65 | III/IV | Unknown | Unknown | SD |
| LRP1 | SNV | Missense_Mutation | c.13606N>A | p.Glu4536Lys | p.E4536K | Q07954 | protein_coding | deleterious(0.01) | benign(0.034) | TCGA-A8-A095-01 | Breast | breast invasive carcinoma | Female | <65 | I/II | Chemotherapy | 5-fluorouracil | CR |
| Page: 1 2 3 4 5 6 7 8 9 10 11 12 13 14 15 16 17 18 19 20 21 22 23 24 25 26 27 28 29 30 31 32 33 34 35 36 37 38 39 40 41 42 43 44 45 46 47 48 49 50 51 52 |
Top |
Related drugs of malignant transformation related genes |
| Identification of chemicals and drugs interact with genes involved in malignant transfromation |
| (DGIdb 4.0) |
| Entrez ID | Symbol | Category | Interaction Types | Drug Claim Name | Drug Name | PMIDs |
| 4035 | LRP1 | KINASE, DRUGGABLE GENOME | ANTISENSE OLIGONUCLEOTIDES | 11095961 |
| Page: 1 |

Copyright 2023-Present -The University of Texas Health Science Center at Houston |