
|
|||||
|
 | |
| |
| |
| |
| |
| |
|
Gene: LRMDA |
Gene summary for LRMDA |
| Gene information | Species | Human | Gene symbol | LRMDA | Gene ID | 83938 |
| Gene name | leucine rich melanocyte differentiation associated | |
| Gene Alias | C10orf11 | |
| Cytomap | 10q22.2-q22.3 | |
| Gene Type | protein-coding | GO ID | GO:0008150 | UniProtAcc | A0A087WWI0 |
Top |
Malignant transformation analysis |
| Identification of the aberrant gene expression in precancerous and cancerous lesions by comparing the gene expression of stem-like cells in diseased tissues with normal stem cells |
| Entrez ID | Symbol | Replicates | Species | Organ | Tissue | Adj P-value | Log2FC | Malignancy |
| 83938 | LRMDA | CA_HPV_3 | Human | Cervix | CC | 1.66e-02 | -1.50e-01 | 0.0414 |
| 83938 | LRMDA | CCI_1 | Human | Cervix | CC | 2.87e-16 | 1.87e+00 | 0.528 |
| 83938 | LRMDA | CCI_3 | Human | Cervix | CC | 7.19e-20 | 1.58e+00 | 0.516 |
| 83938 | LRMDA | Tumor | Human | Cervix | CC | 7.94e-12 | -2.20e-01 | 0.1241 |
| 83938 | LRMDA | HTA11_3410_2000001011 | Human | Colorectum | AD | 2.12e-20 | -6.37e-01 | 0.0155 |
| 83938 | LRMDA | HTA11_2487_2000001011 | Human | Colorectum | SER | 4.35e-23 | -1.01e+00 | -0.1808 |
| 83938 | LRMDA | HTA11_2951_2000001011 | Human | Colorectum | AD | 1.56e-03 | -7.85e-01 | 0.0216 |
| 83938 | LRMDA | HTA11_1938_2000001011 | Human | Colorectum | AD | 3.04e-27 | -1.18e+00 | -0.0811 |
| 83938 | LRMDA | HTA11_78_2000001011 | Human | Colorectum | AD | 4.43e-15 | -7.52e-01 | -0.1088 |
| 83938 | LRMDA | HTA11_411_2000001011 | Human | Colorectum | SER | 2.30e-03 | -8.33e-01 | -0.2602 |
| 83938 | LRMDA | HTA11_2112_2000001011 | Human | Colorectum | SER | 6.55e-05 | -1.00e+00 | -0.2196 |
| 83938 | LRMDA | HTA11_3361_2000001011 | Human | Colorectum | AD | 4.76e-11 | -7.81e-01 | -0.1207 |
| 83938 | LRMDA | HTA11_83_2000001011 | Human | Colorectum | SER | 4.23e-22 | -1.17e+00 | -0.1526 |
| 83938 | LRMDA | HTA11_866_2000001011 | Human | Colorectum | AD | 1.22e-06 | -5.51e-01 | -0.1001 |
| 83938 | LRMDA | HTA11_1391_2000001011 | Human | Colorectum | AD | 1.85e-10 | -6.03e-01 | -0.059 |
| 83938 | LRMDA | HTA11_5212_2000001011 | Human | Colorectum | AD | 5.43e-05 | -7.51e-01 | -0.2061 |
| 83938 | LRMDA | HTA11_5216_2000001011 | Human | Colorectum | SER | 3.03e-07 | -9.55e-01 | -0.1462 |
| 83938 | LRMDA | HTA11_7862_2000001011 | Human | Colorectum | AD | 2.76e-10 | -9.19e-01 | -0.0179 |
| 83938 | LRMDA | HTA11_866_3004761011 | Human | Colorectum | AD | 1.05e-06 | -4.54e-01 | 0.096 |
| 83938 | LRMDA | HTA11_4255_2000001011 | Human | Colorectum | SER | 1.40e-05 | -8.56e-01 | 0.0446 |
| Page: 1 2 3 4 5 6 7 8 9 |
| Tissue | Expression Dynamics | Abbreviation |
| Cervix | 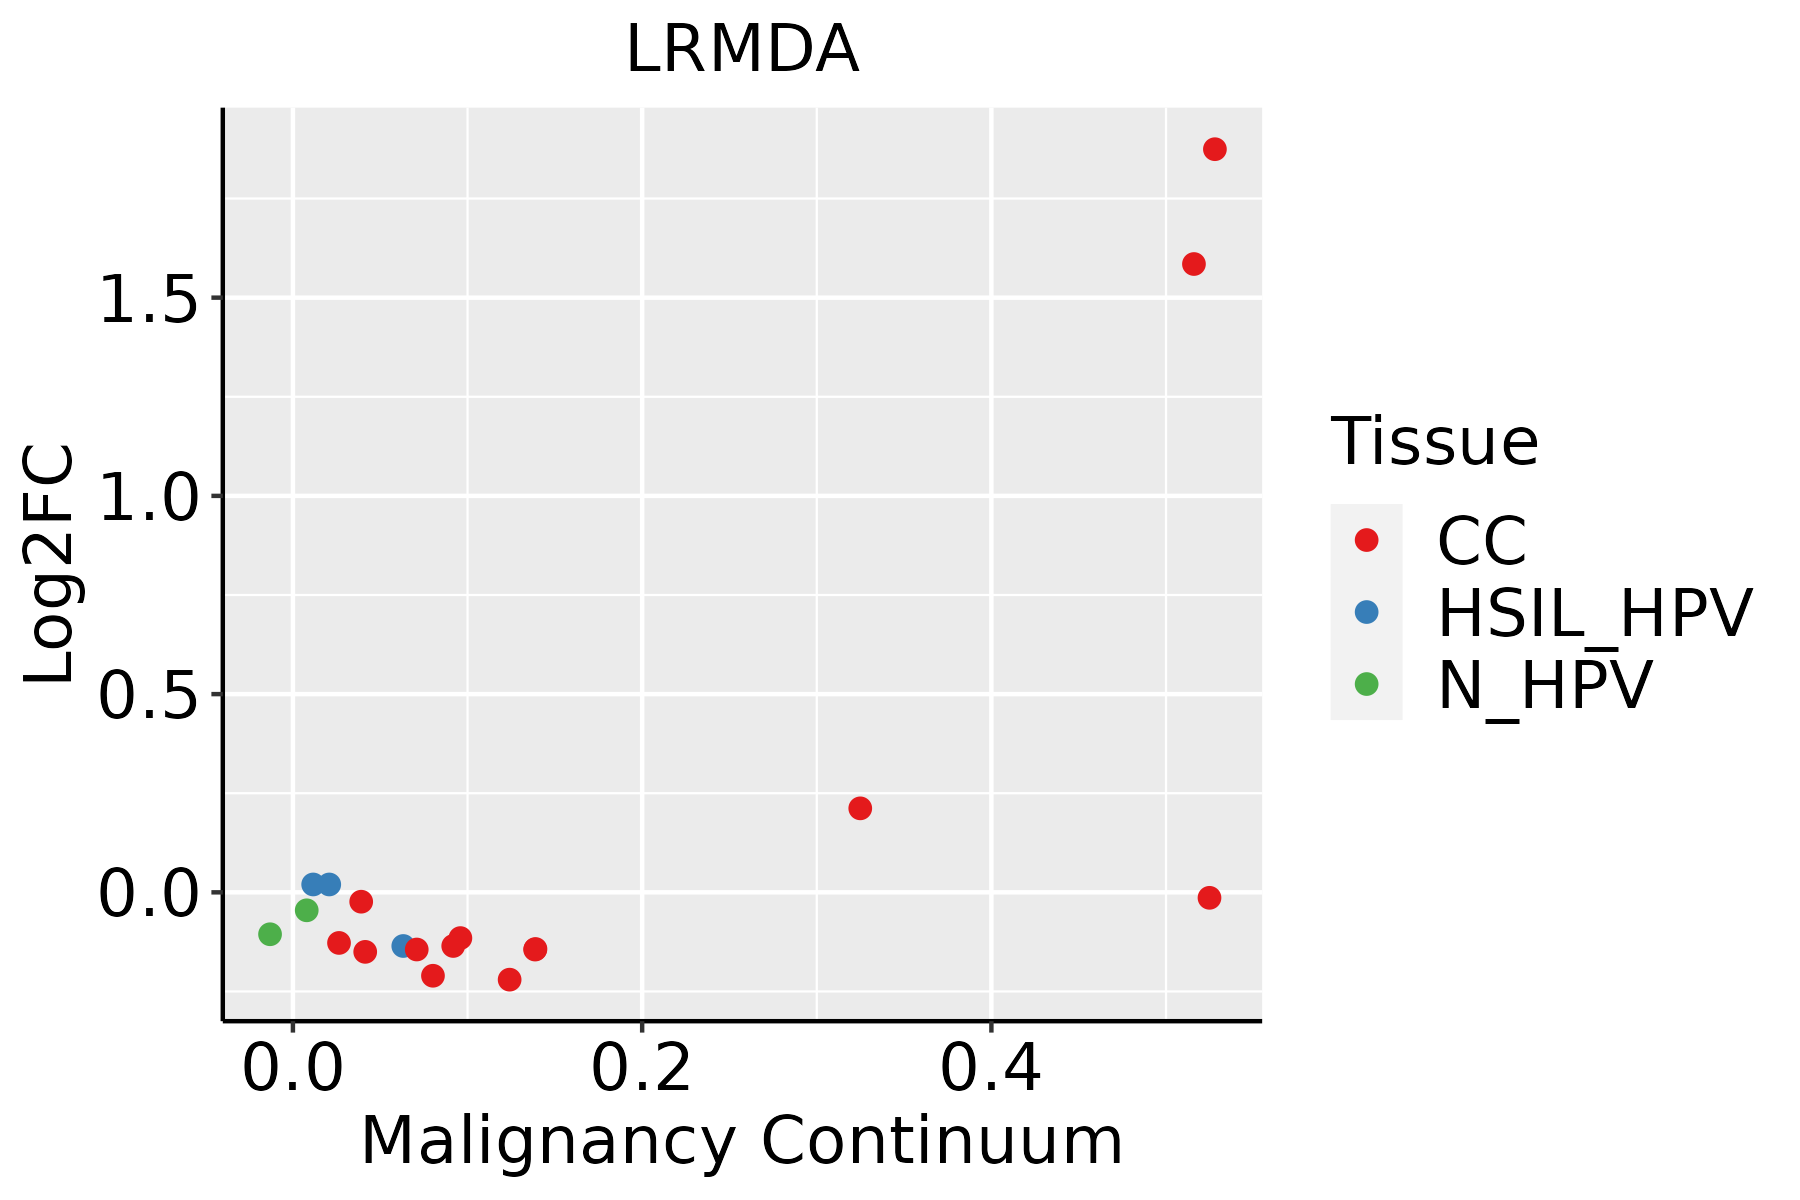 | CC: Cervix cancer |
| HSIL_HPV: HPV-infected high-grade squamous intraepithelial lesions | ||
| N_HPV: HPV-infected normal cervix | ||
| Colorectum (GSE201348) |  | FAP: Familial adenomatous polyposis |
| CRC: Colorectal cancer | ||
| Colorectum (HTA11) |  | AD: Adenomas |
| SER: Sessile serrated lesions | ||
| MSI-H: Microsatellite-high colorectal cancer | ||
| MSS: Microsatellite stable colorectal cancer | ||
| Endometrium | 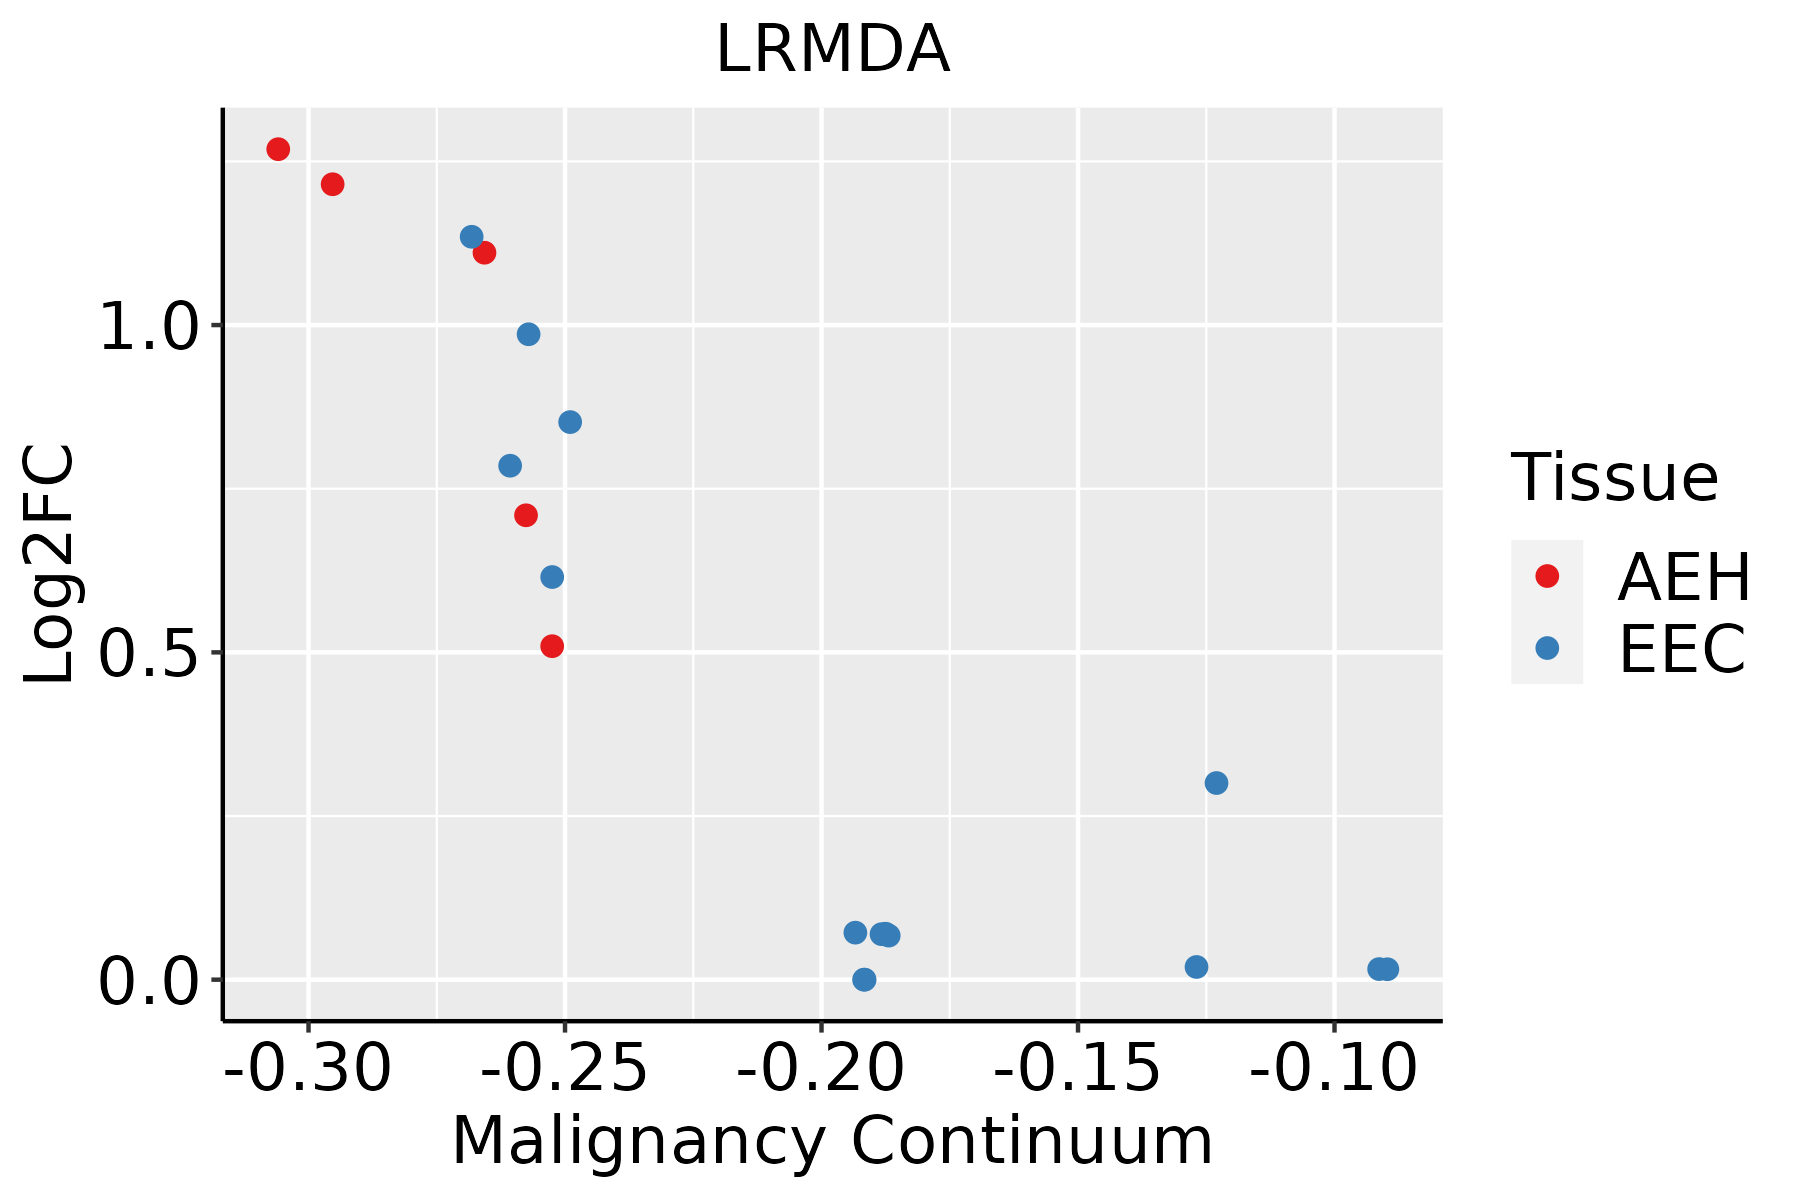 | AEH: Atypical endometrial hyperplasia |
| EEC: Endometrioid Cancer | ||
| GC | 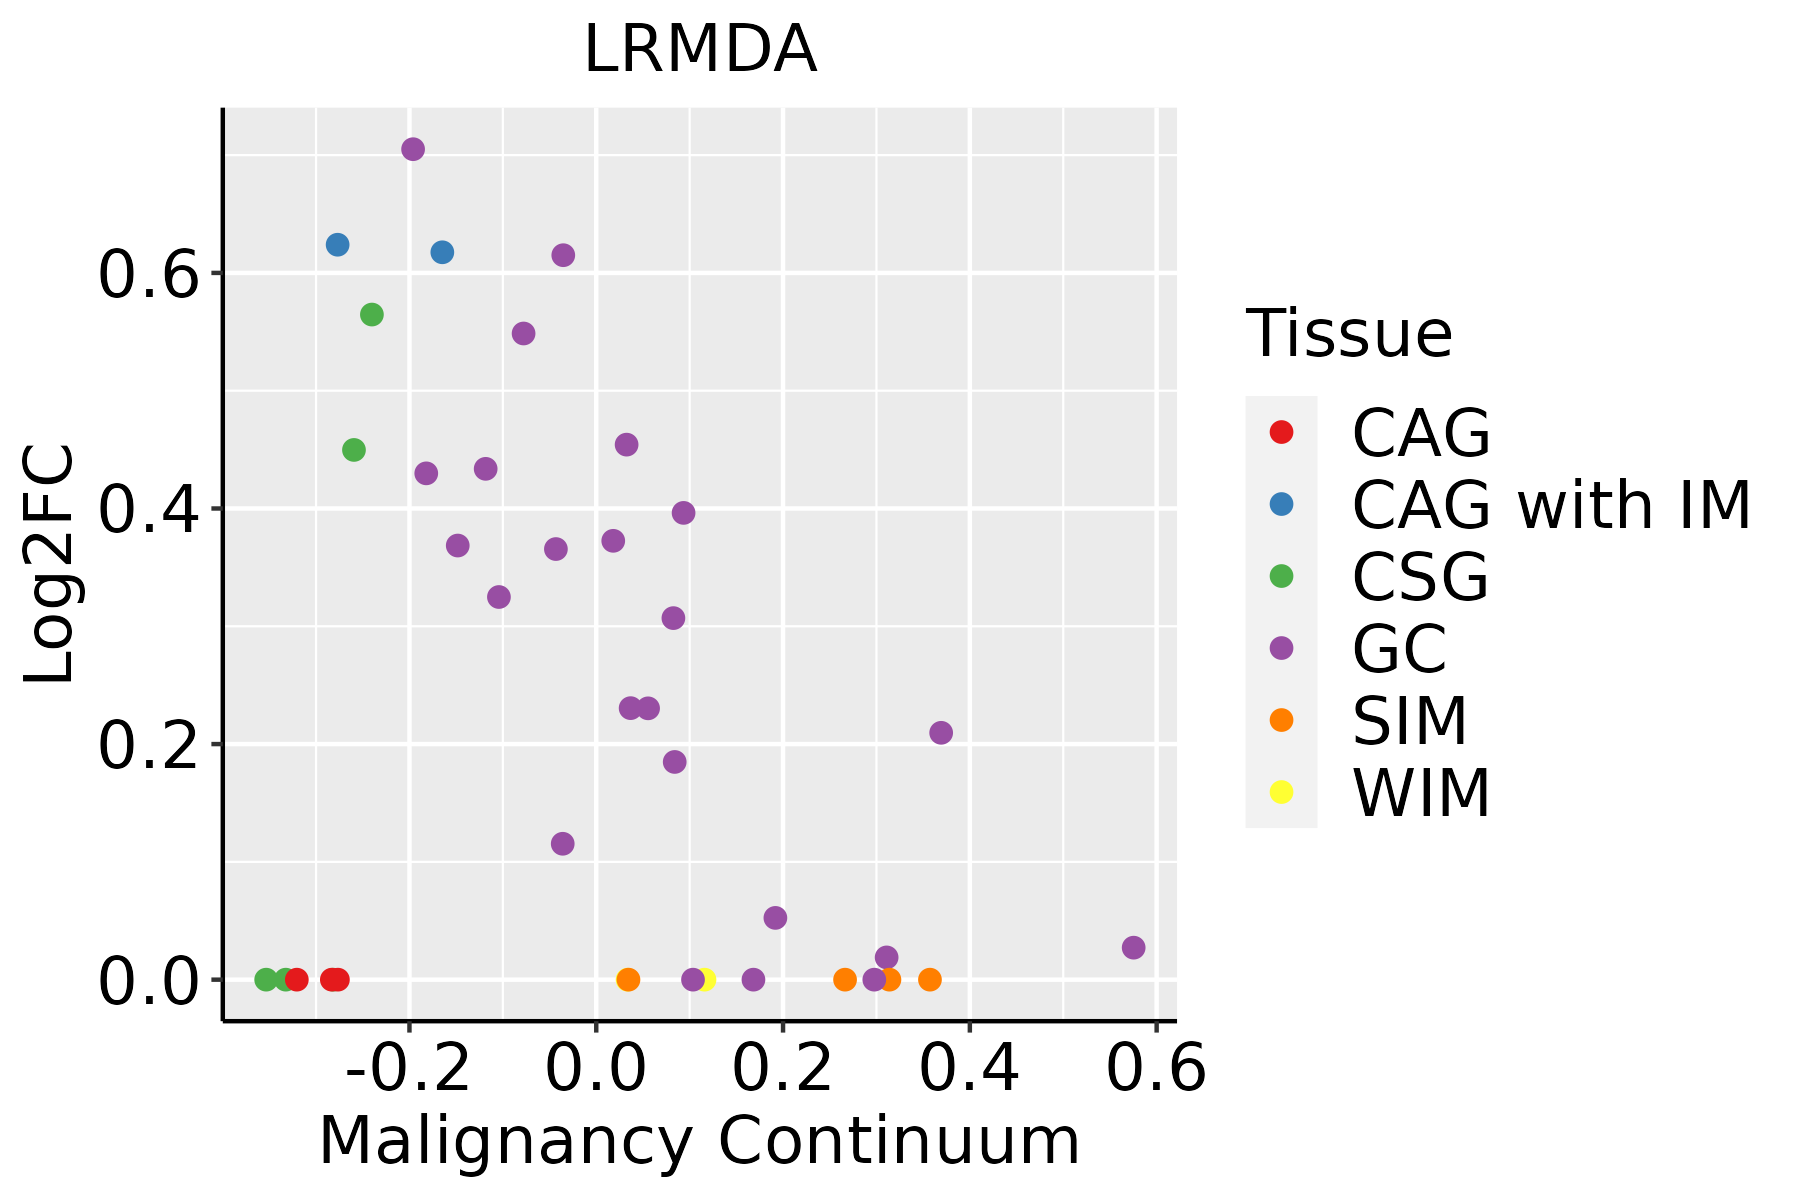 | CAG: Chronic atrophic gastritis |
| CAG with IM: Chronic atrophic gastritis with intestinal metaplasia | ||
| CSG: Chronic superficial gastritis | ||
| GC: Gastric cancer | ||
| SIM: Severe intestinal metaplasia | ||
| WIM: Wild intestinal metaplasia | ||
| Liver | 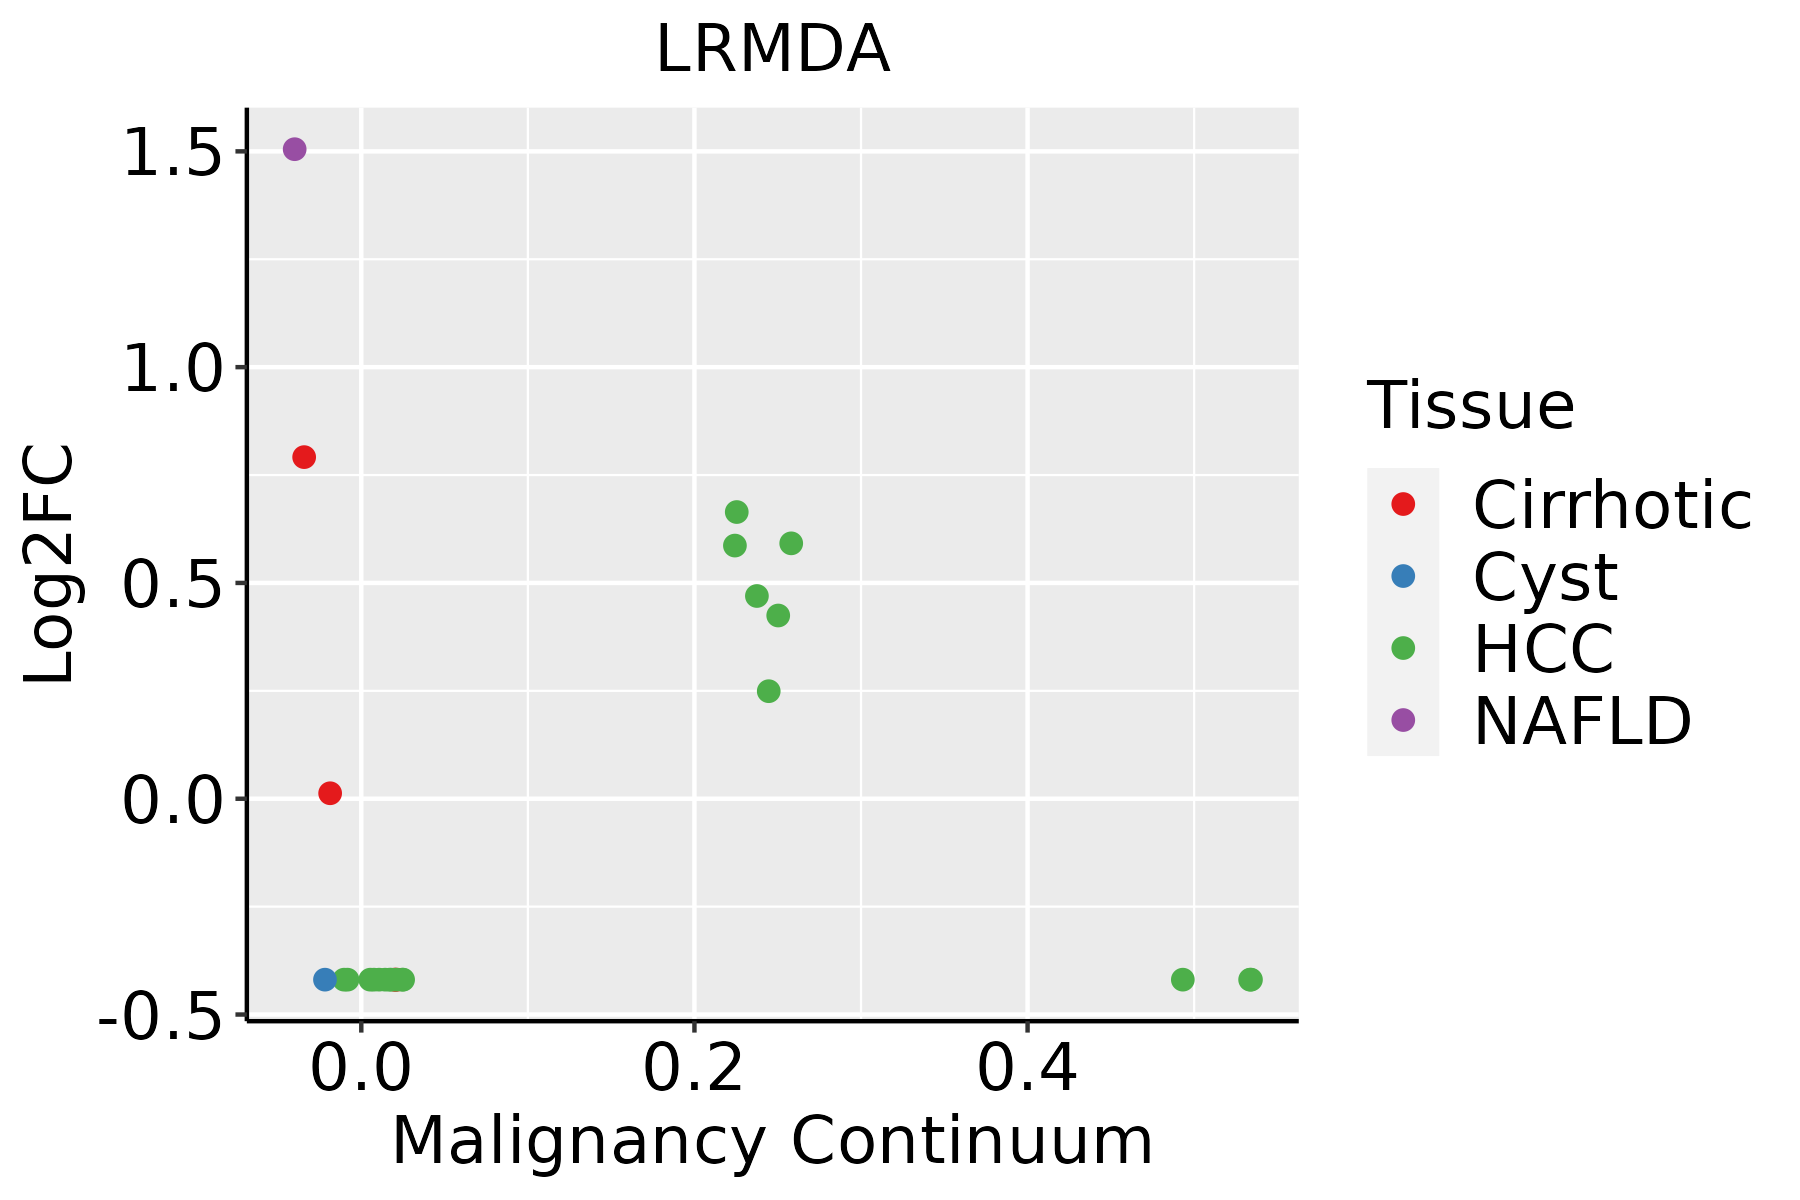 | HCC: Hepatocellular carcinoma |
| NAFLD: Non-alcoholic fatty liver disease | ||
| Lung |  | AAH: Atypical adenomatous hyperplasia |
| AIS: Adenocarcinoma in situ | ||
| IAC: Invasive lung adenocarcinoma | ||
| MIA: Minimally invasive adenocarcinoma | ||
| Oral Cavity | 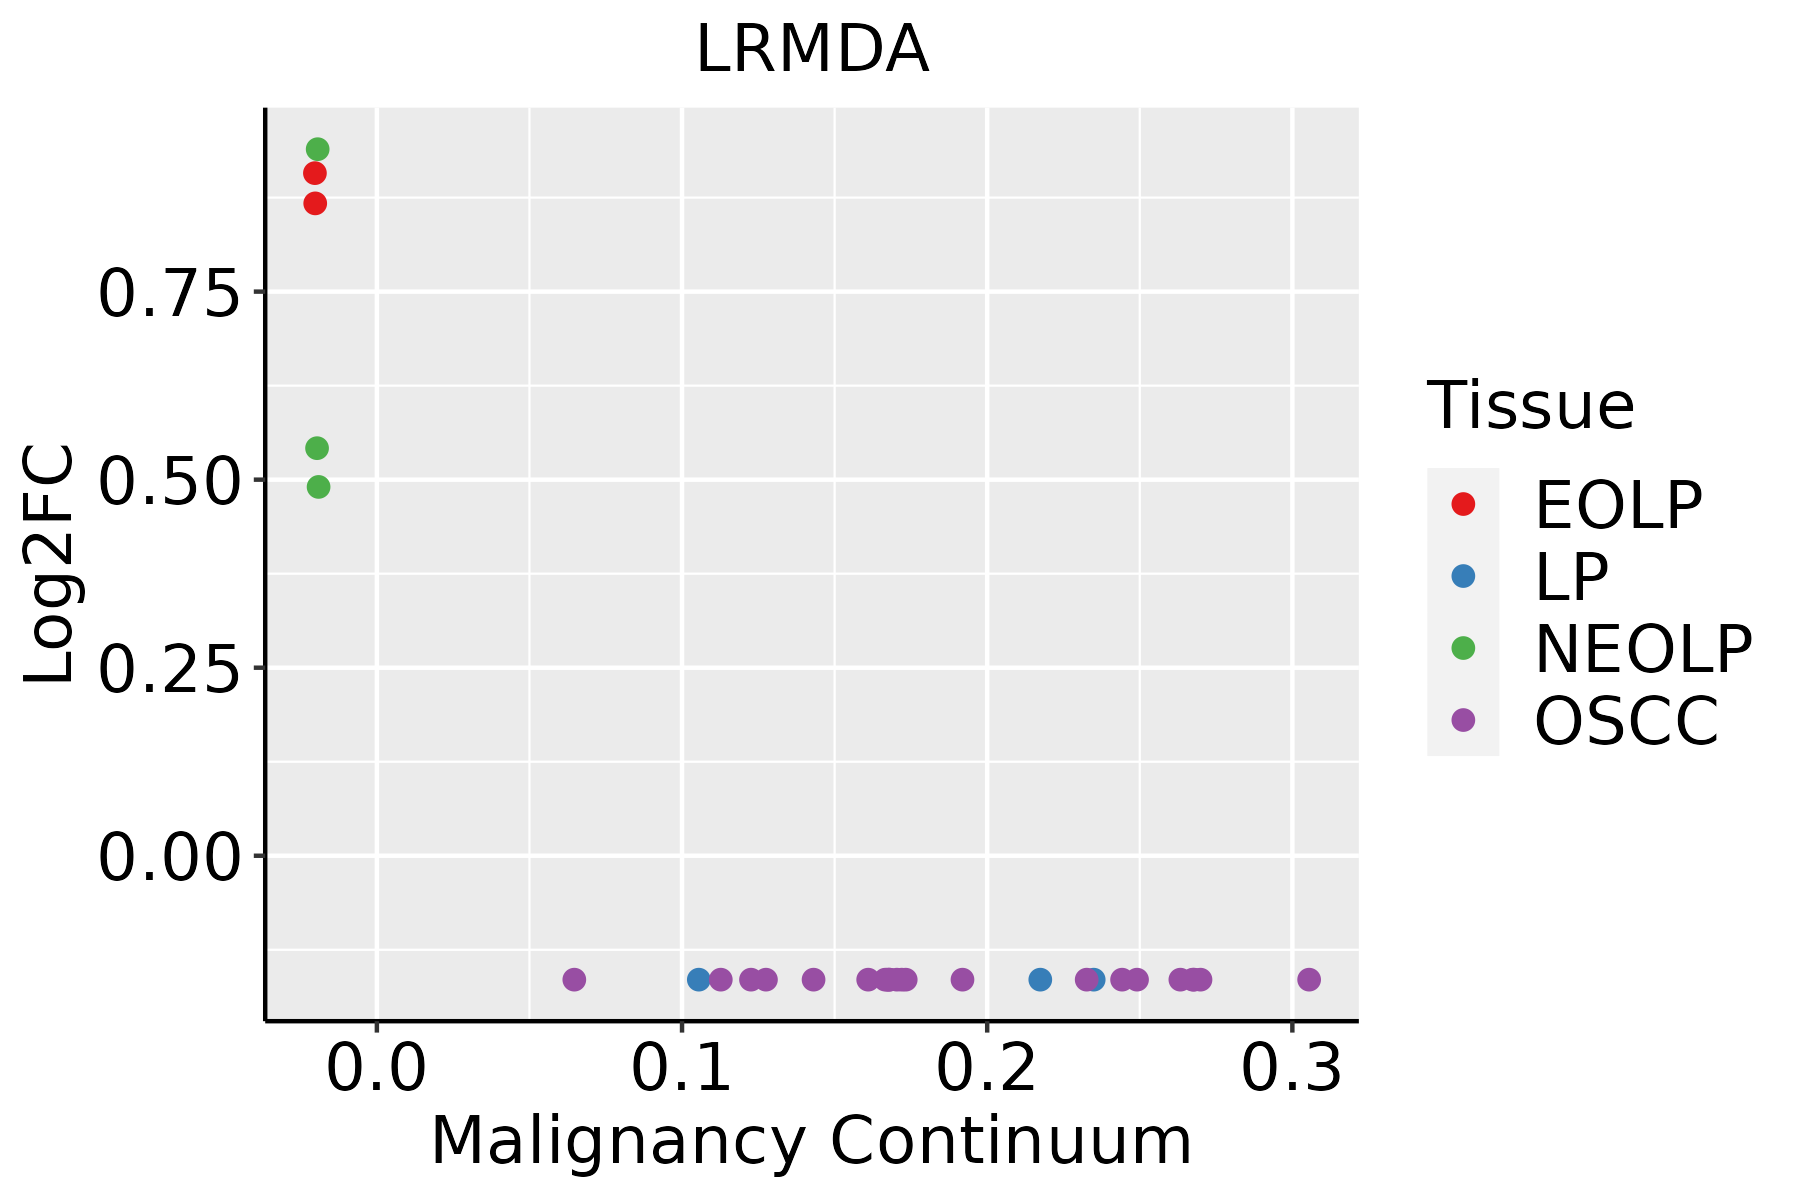 | EOLP: Erosive Oral lichen planus |
| LP: leukoplakia | ||
| NEOLP: Non-erosive oral lichen planus | ||
| OSCC: Oral squamous cell carcinoma | ||
| Thyroid | 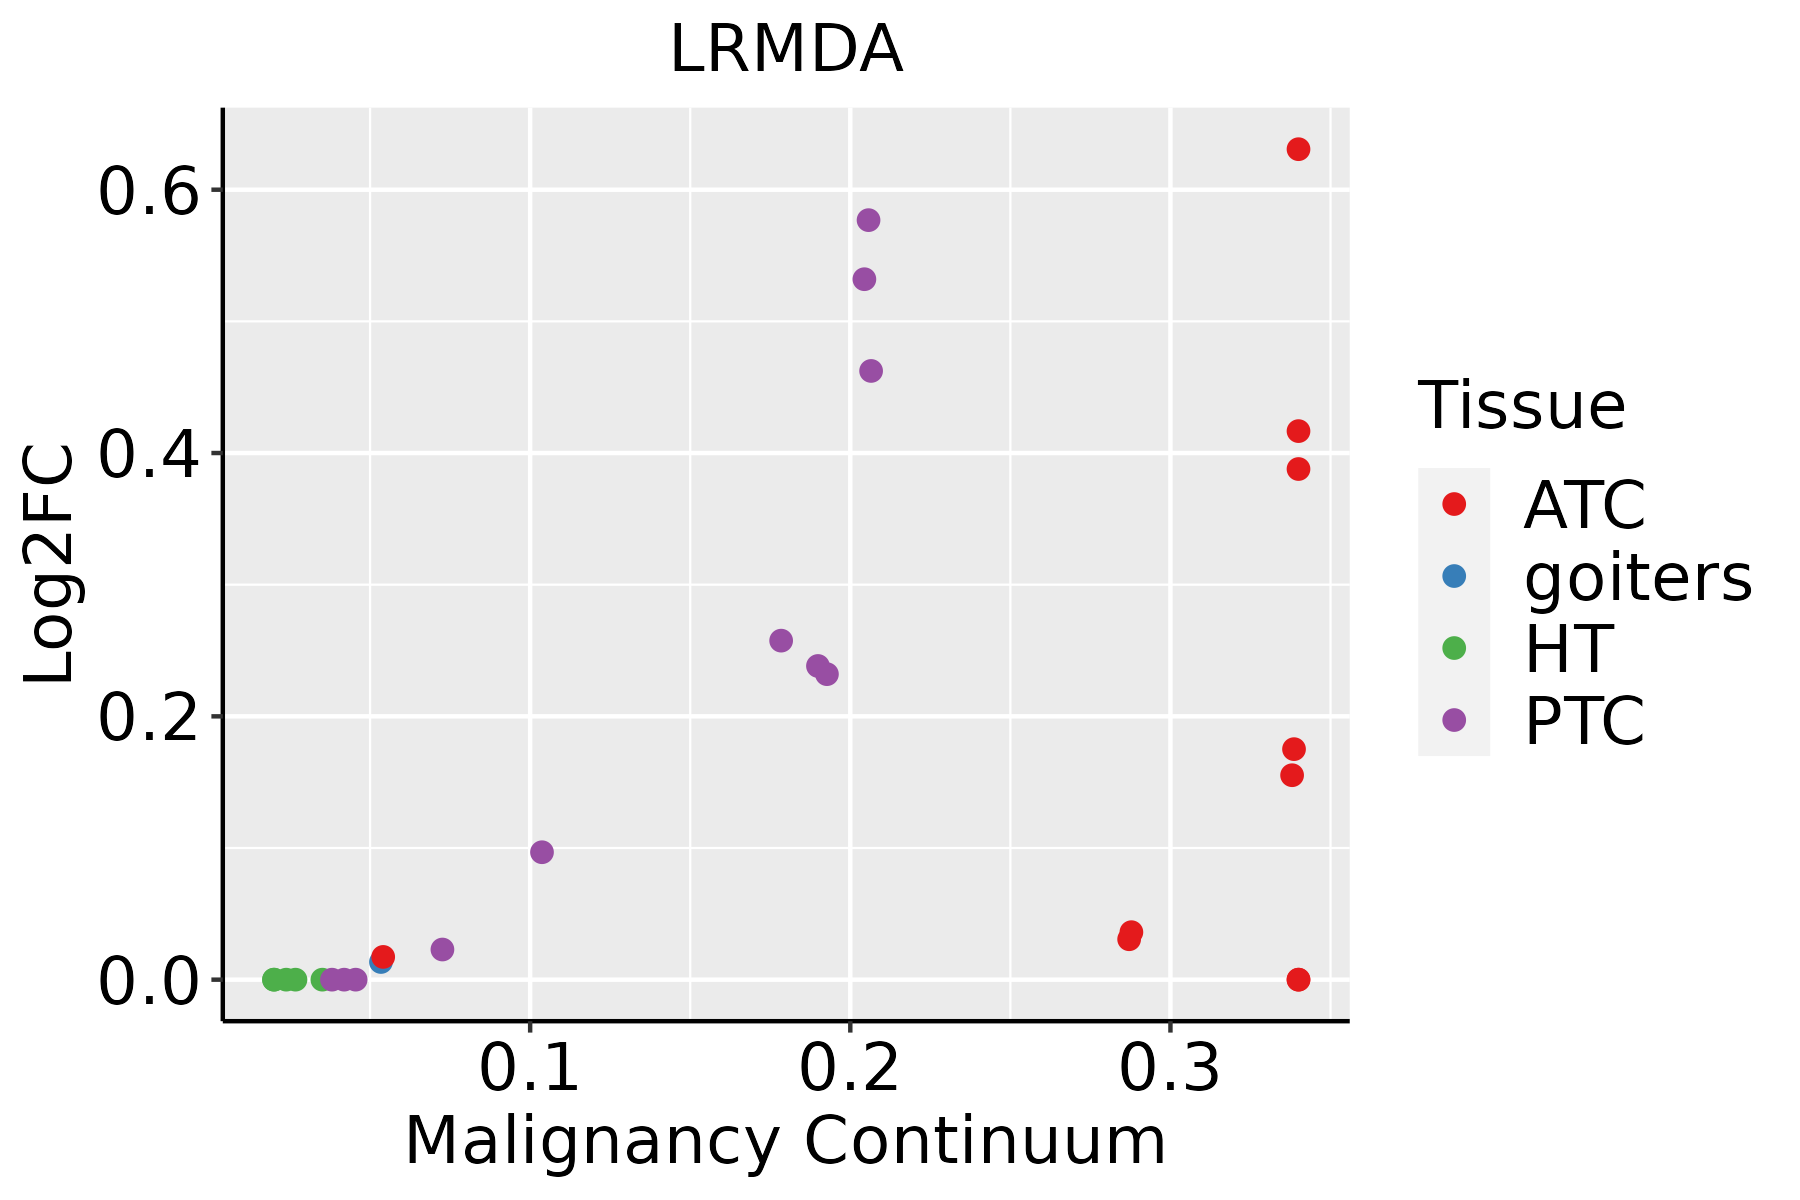 | ATC: Anaplastic thyroid cancer |
| HT: Hashimoto's thyroiditis | ||
| PTC: Papillary thyroid cancer |
| ∗log2FC in expression of this searched gene in stem-like cells from each diseased tissue sample relative to stem-like cells in normal samples in each tissue plotted against the malignancy continuum. Samples are colored based on if they are from different disease stage. |
Top |
Malignant transformation related pathway analysis |
| Find out the enriched GO biological processes and KEGG pathways involved in transition from healthy to precancer to cancer |
| Tissue | Disease Stage | Enriched GO biological Processes |
| Colorectum | AD |  |
| Colorectum | SER |  |
| Colorectum | MSS |  |
| Colorectum | MSI-H |  |
| Colorectum | FAP |  |
| ∗Top 15 enriched GO BP terms are showed in the bar plot of each disease state in each tissue. Each row represents a significant GO biological process which is colored according to the -log10(p.adjust). |
| Page: 1 2 3 4 5 6 7 8 9 |
| GO ID | Tissue | Disease Stage | Description | Gene Ratio | Bg Ratio | pvalue | p.adjust | Count |
| GO:0043473 | Oral cavity | EOLP | pigmentation | 20/2218 | 98/18723 | 1.02e-02 | 4.58e-02 | 20 |
| Page: 1 |
| Pathway ID | Tissue | Disease Stage | Description | Gene Ratio | Bg Ratio | pvalue | p.adjust | qvalue | Count |
| Page: 1 |
Top |
Cell-cell communication analysis |
| Identification of potential cell-cell interactions between two cell types and their ligand-receptor pairs for different disease states |
| Ligand | Receptor | LRpair | Pathway | Tissue | Disease Stage |
| Page: 1 |
Top |
Single-cell gene regulatory network inference analysis |
| Find out the significant the regulons (TFs) and the target genes of each regulon across cell types for different disease states |
| TF | Cell Type | Tissue | Disease Stage | Target Gene | RSS | Regulon Activity |
| ∗The dot plots of a searched regulon are shown for all cell subpopulations in each disease state of each tissue based on the regulon specific score inferred using pySCENIC and by calculating the average expression. |
| Page: 1 |
Top |
Somatic mutation of malignant transformation related genes |
| Annotation of somatic variants for genes involved in malignant transformation |
| Hugo Symbol | Variant Class | Variant Classification | dbSNP RS | HGVSc | HGVSp | HGVSp Short | SWISSPROT | BIOTYPE | SIFT | PolyPhen | Tumor Sample Barcode | Tissue | Histology | Sex | Age | Stage | Therapy Types | Drugs | Outcome |
| Page: 1 |
Top |
Related drugs of malignant transformation related genes |
| Identification of chemicals and drugs interact with genes involved in malignant transfromation |
| (DGIdb 4.0) |
| Entrez ID | Symbol | Category | Interaction Types | Drug Claim Name | Drug Name | PMIDs |
| 83938 | LRMDA | NA | tamoxifen | TAMOXIFEN | 22180457 | |
| 83938 | LRMDA | NA | tamoxifen | TAMOXIFEN | 22180457 |
| Page: 1 |

Copyright 2023-Present -The University of Texas Health Science Center at Houston |