
|
|||||
|
 | |
| |
| |
| |
| |
| |
|
Gene: LRIG3 |
Gene summary for LRIG3 |
| Gene information | Species | Human | Gene symbol | LRIG3 | Gene ID | 121227 |
| Gene name | leucine rich repeats and immunoglobulin like domains 3 | |
| Gene Alias | LIG3 | |
| Cytomap | 12q14.1 | |
| Gene Type | protein-coding | GO ID | GO:0007275 | UniProtAcc | Q6UXM1 |
Top |
Malignant transformation analysis |
| Identification of the aberrant gene expression in precancerous and cancerous lesions by comparing the gene expression of stem-like cells in diseased tissues with normal stem cells |
| Entrez ID | Symbol | Replicates | Species | Organ | Tissue | Adj P-value | Log2FC | Malignancy |
| 121227 | LRIG3 | HTA11_3410_2000001011 | Human | Colorectum | AD | 4.33e-26 | -8.06e-01 | 0.0155 |
| 121227 | LRIG3 | HTA11_2487_2000001011 | Human | Colorectum | SER | 1.85e-11 | -7.23e-01 | -0.1808 |
| 121227 | LRIG3 | HTA11_1938_2000001011 | Human | Colorectum | AD | 5.93e-09 | -7.20e-01 | -0.0811 |
| 121227 | LRIG3 | HTA11_3361_2000001011 | Human | Colorectum | AD | 3.17e-14 | -8.43e-01 | -0.1207 |
| 121227 | LRIG3 | HTA11_696_2000001011 | Human | Colorectum | AD | 9.83e-19 | -5.72e-01 | -0.1464 |
| 121227 | LRIG3 | HTA11_866_2000001011 | Human | Colorectum | AD | 4.11e-13 | -5.35e-01 | -0.1001 |
| 121227 | LRIG3 | HTA11_1391_2000001011 | Human | Colorectum | AD | 2.24e-03 | -4.93e-01 | -0.059 |
| 121227 | LRIG3 | HTA11_5212_2000001011 | Human | Colorectum | AD | 1.37e-02 | -6.08e-01 | -0.2061 |
| 121227 | LRIG3 | HTA11_866_3004761011 | Human | Colorectum | AD | 2.30e-09 | -6.00e-01 | 0.096 |
| 121227 | LRIG3 | HTA11_9408_2000001011 | Human | Colorectum | AD | 3.11e-03 | -8.88e-01 | 0.0451 |
| 121227 | LRIG3 | HTA11_10711_2000001011 | Human | Colorectum | AD | 4.34e-08 | -6.63e-01 | 0.0338 |
| 121227 | LRIG3 | HTA11_7696_3000711011 | Human | Colorectum | AD | 1.09e-18 | -5.75e-01 | 0.0674 |
| 121227 | LRIG3 | HTA11_6818_2000001021 | Human | Colorectum | AD | 2.65e-04 | -6.08e-01 | 0.0588 |
| 121227 | LRIG3 | HTA11_99999970781_79442 | Human | Colorectum | MSS | 8.71e-27 | -6.67e-01 | 0.294 |
| 121227 | LRIG3 | HTA11_99999965104_69814 | Human | Colorectum | MSS | 8.99e-03 | -4.28e-01 | 0.281 |
| 121227 | LRIG3 | HTA11_99999971662_82457 | Human | Colorectum | MSS | 1.01e-19 | -6.00e-01 | 0.3859 |
| 121227 | LRIG3 | HTA11_99999973899_84307 | Human | Colorectum | MSS | 1.33e-09 | -8.04e-01 | 0.2585 |
| 121227 | LRIG3 | HTA11_99999974143_84620 | Human | Colorectum | MSS | 1.22e-42 | -8.59e-01 | 0.3005 |
| 121227 | LRIG3 | F007 | Human | Colorectum | FAP | 2.18e-04 | -3.27e-01 | 0.1176 |
| 121227 | LRIG3 | A002-C-010 | Human | Colorectum | FAP | 3.40e-11 | -4.16e-01 | 0.242 |
| Page: 1 2 3 4 5 6 7 |
| Tissue | Expression Dynamics | Abbreviation |
| Colorectum (GSE201348) |  | FAP: Familial adenomatous polyposis |
| CRC: Colorectal cancer | ||
| Colorectum (HTA11) |  | AD: Adenomas |
| SER: Sessile serrated lesions | ||
| MSI-H: Microsatellite-high colorectal cancer | ||
| MSS: Microsatellite stable colorectal cancer | ||
| Esophagus | 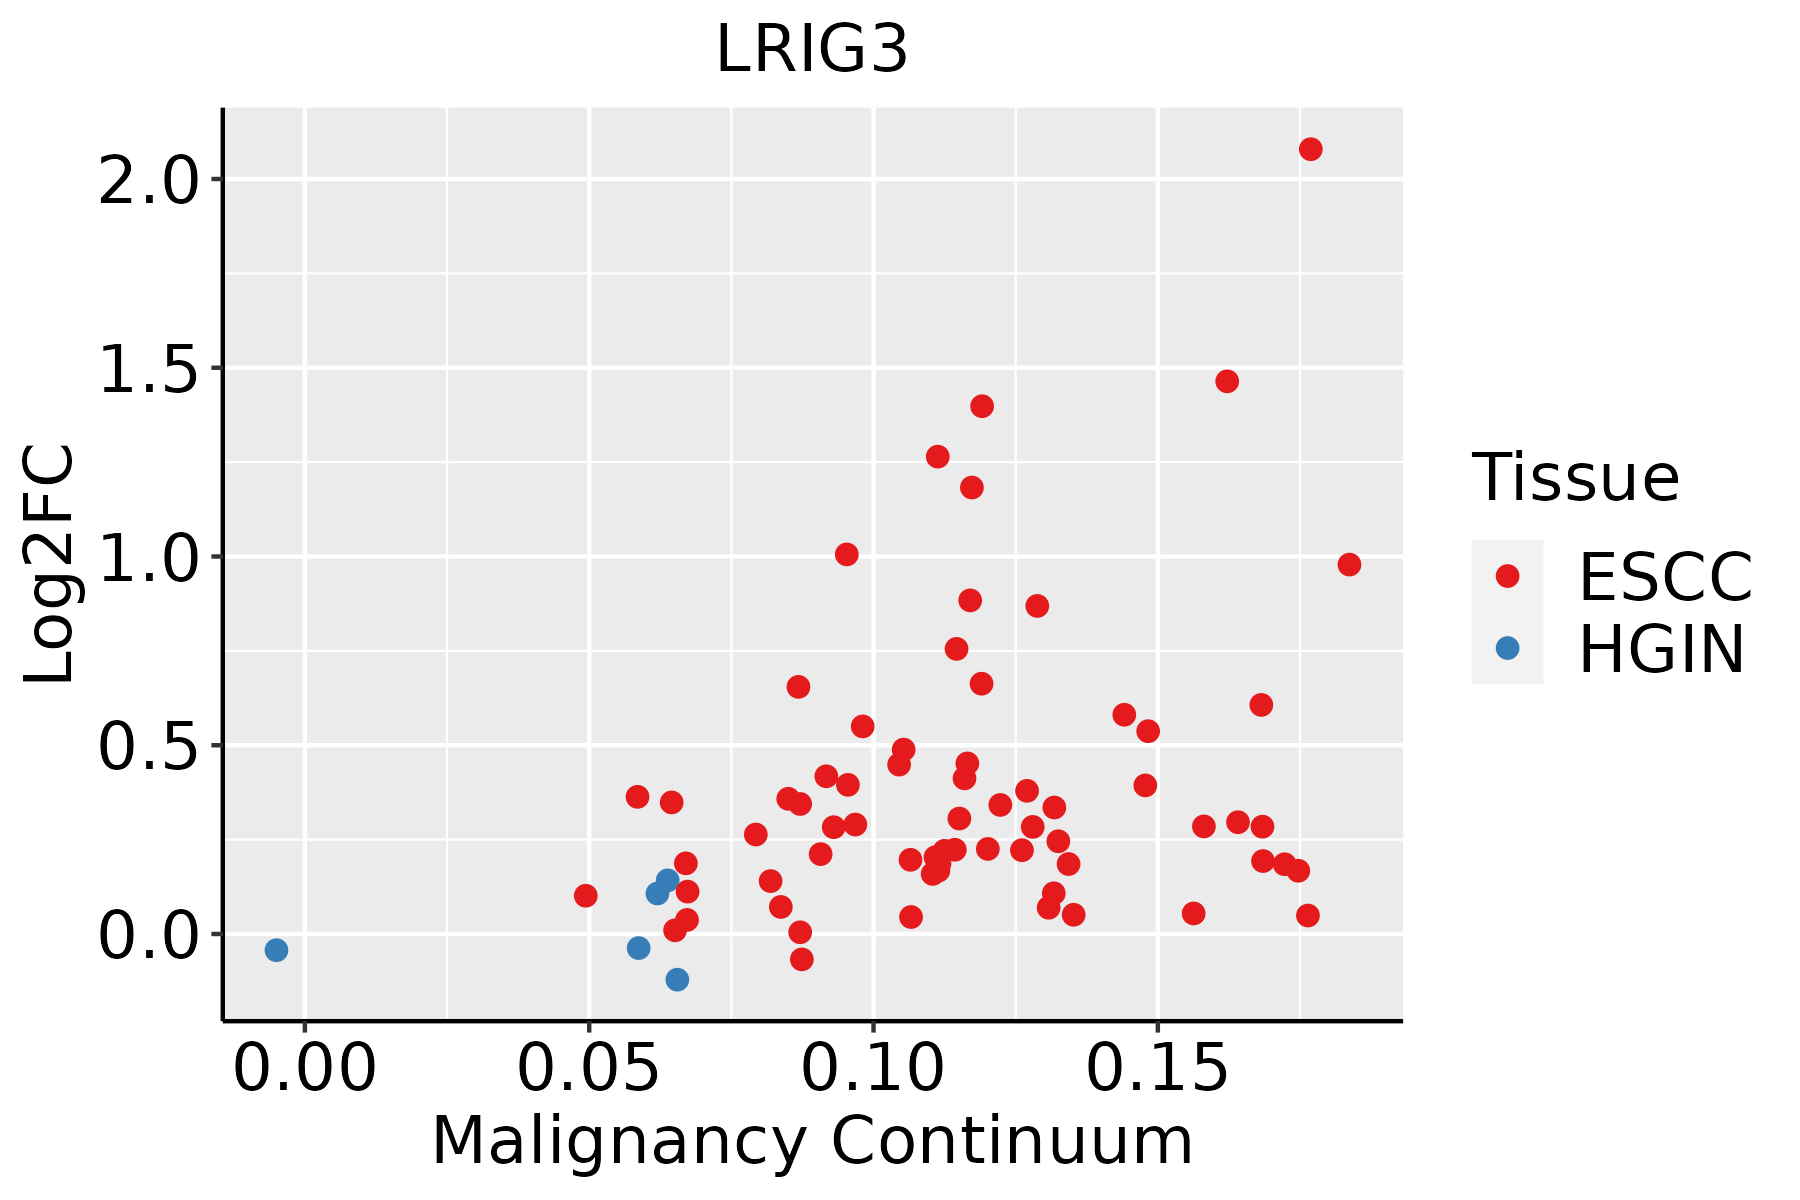 | ESCC: Esophageal squamous cell carcinoma |
| HGIN: High-grade intraepithelial neoplasias | ||
| LGIN: Low-grade intraepithelial neoplasias | ||
| Lung | 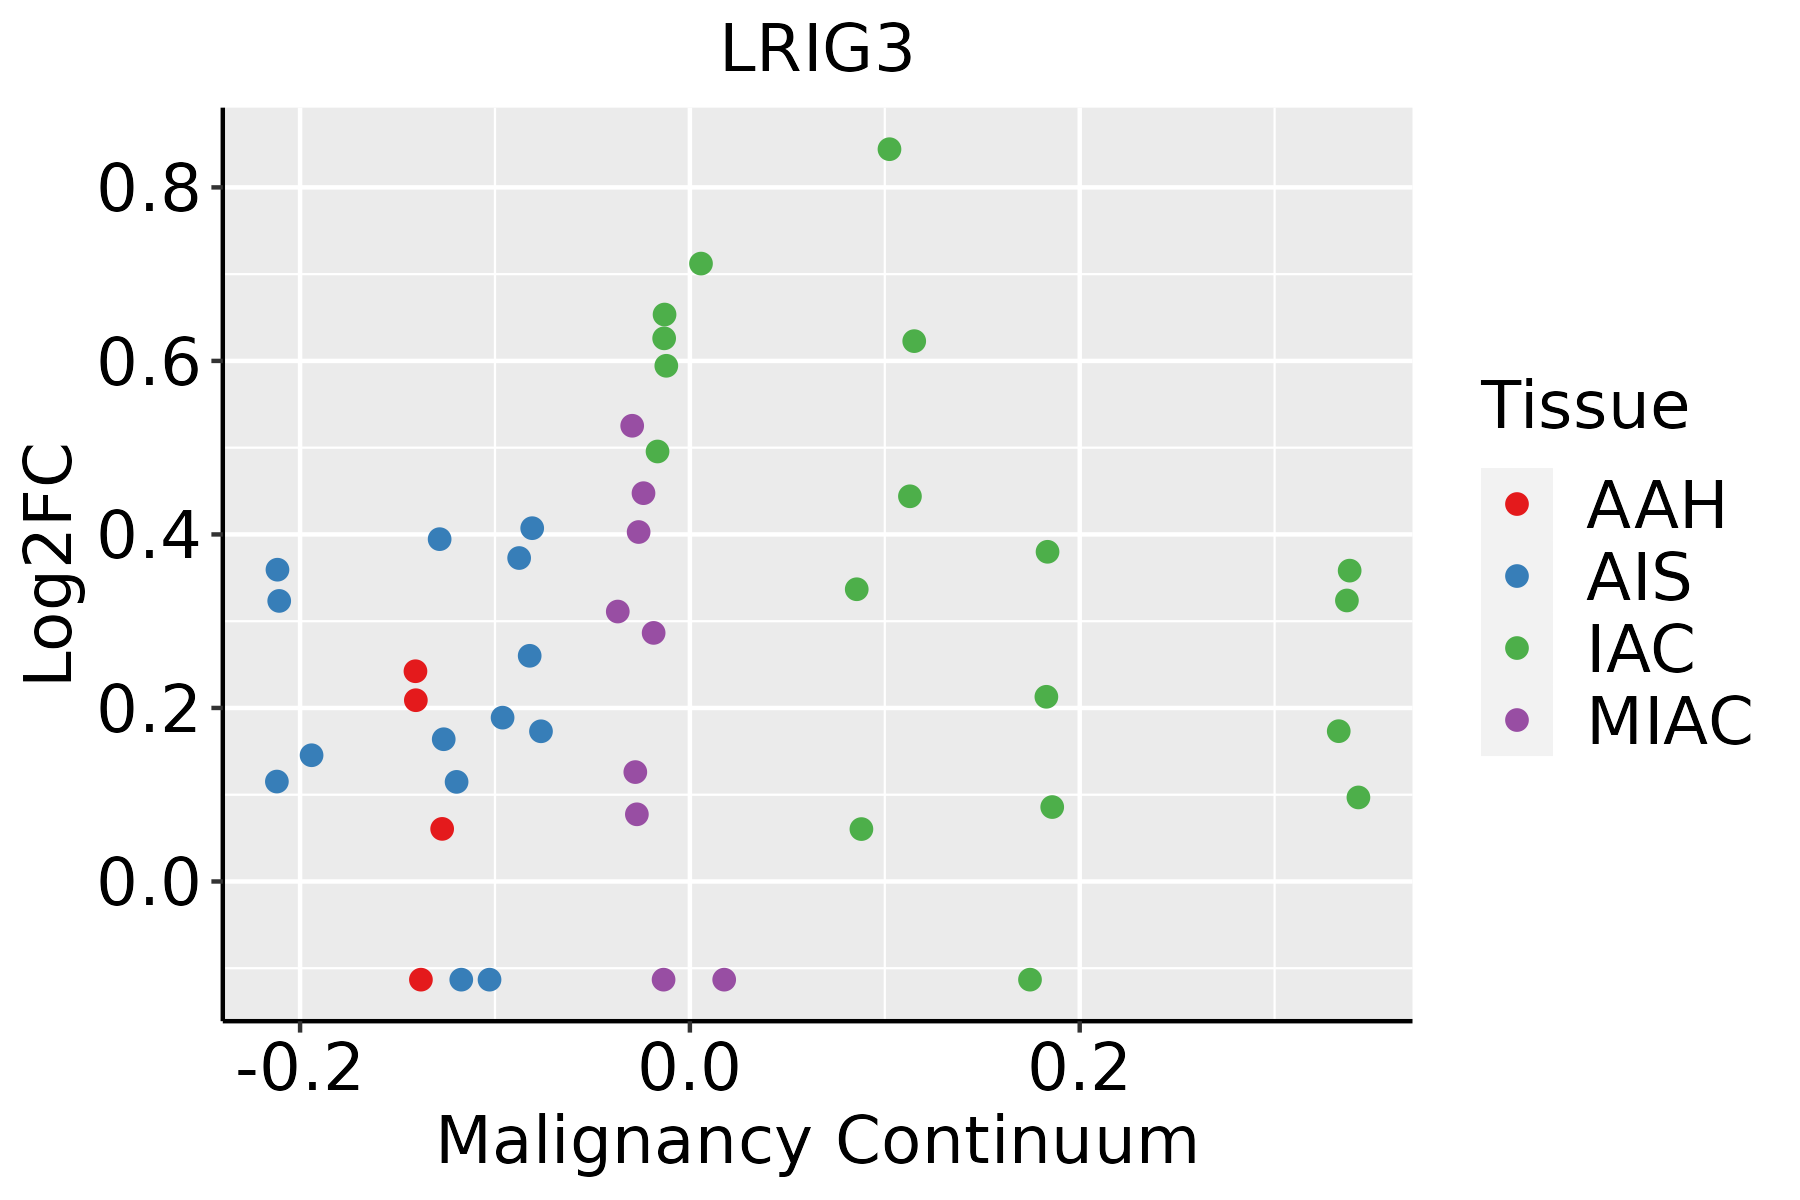 | AAH: Atypical adenomatous hyperplasia |
| AIS: Adenocarcinoma in situ | ||
| IAC: Invasive lung adenocarcinoma | ||
| MIA: Minimally invasive adenocarcinoma | ||
| Oral Cavity | 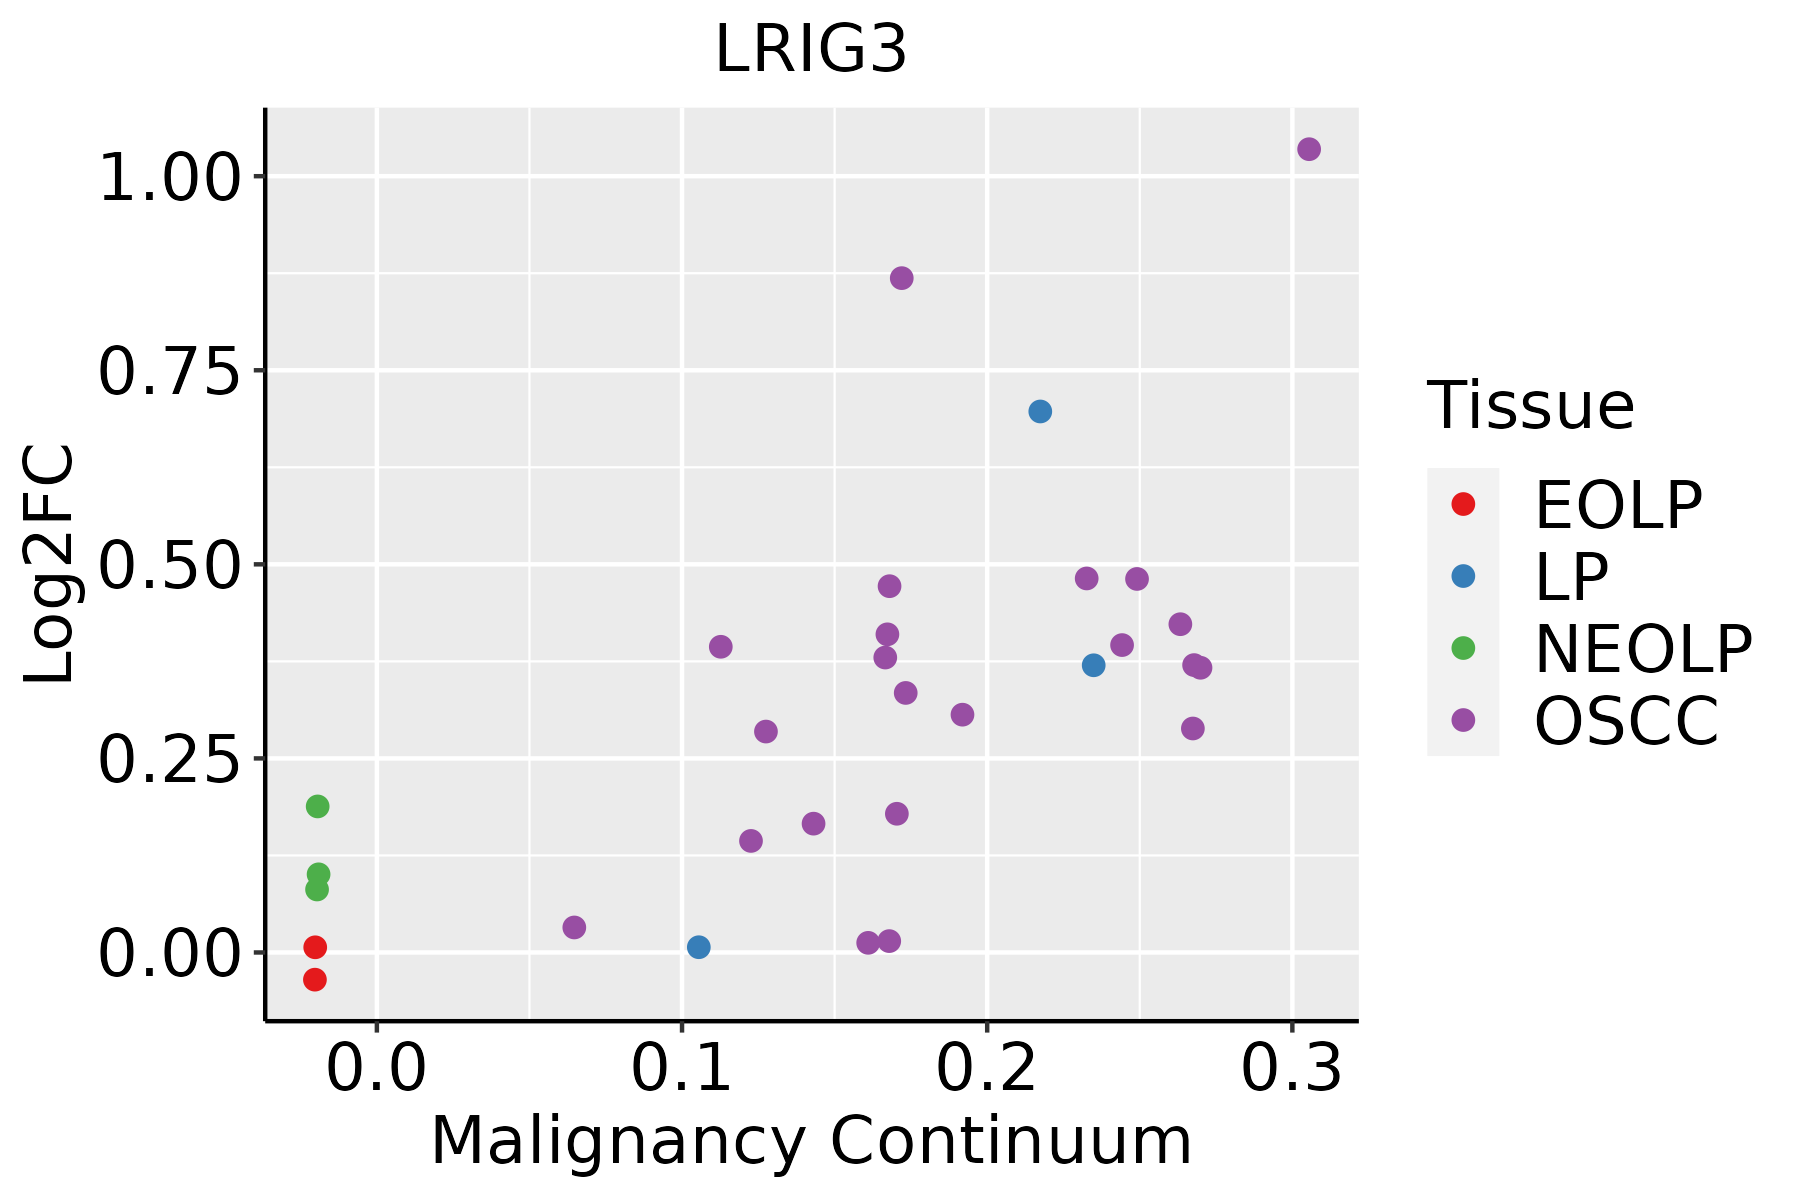 | EOLP: Erosive Oral lichen planus |
| LP: leukoplakia | ||
| NEOLP: Non-erosive oral lichen planus | ||
| OSCC: Oral squamous cell carcinoma | ||
| Thyroid | 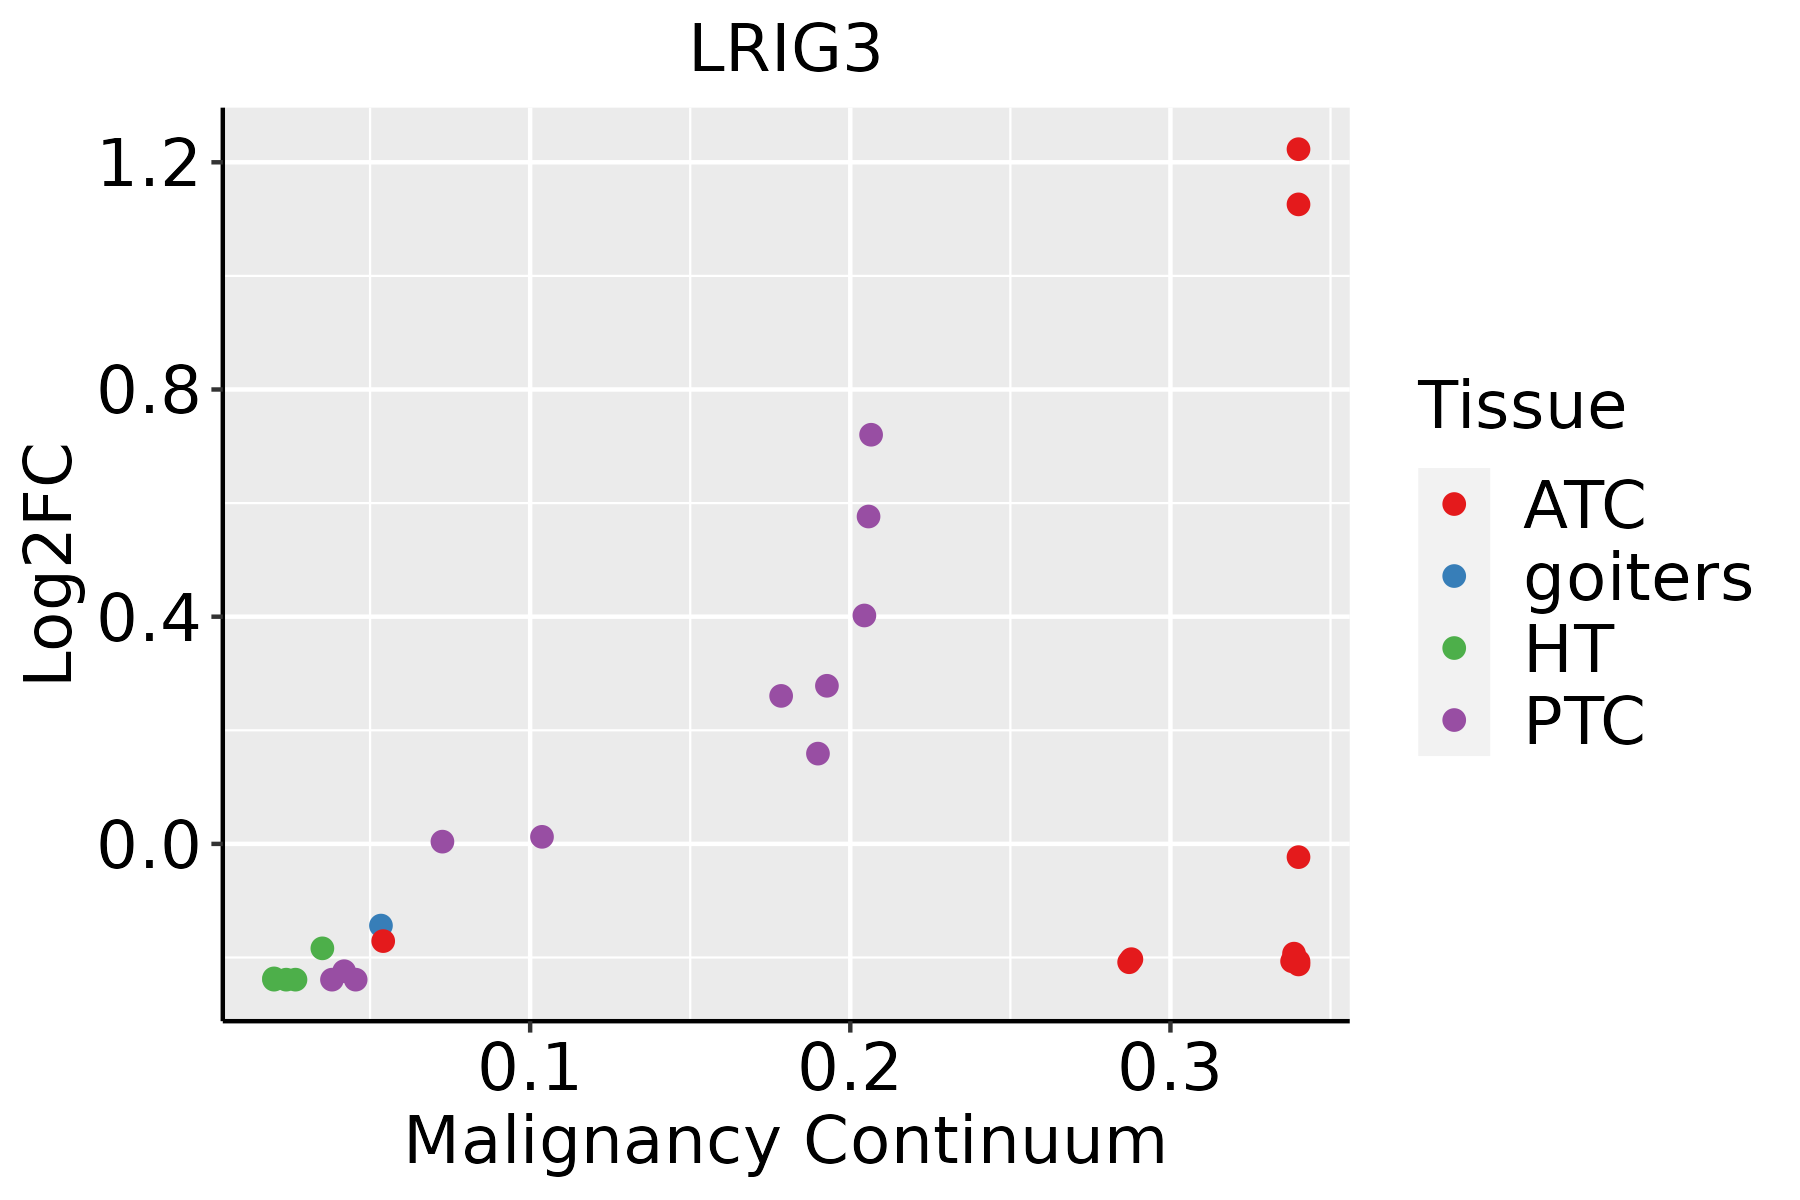 | ATC: Anaplastic thyroid cancer |
| HT: Hashimoto's thyroiditis | ||
| PTC: Papillary thyroid cancer |
| ∗log2FC in expression of this searched gene in stem-like cells from each diseased tissue sample relative to stem-like cells in normal samples in each tissue plotted against the malignancy continuum. Samples are colored based on if they are from different disease stage. |
Top |
Malignant transformation related pathway analysis |
| Find out the enriched GO biological processes and KEGG pathways involved in transition from healthy to precancer to cancer |
| Tissue | Disease Stage | Enriched GO biological Processes |
| Colorectum | AD |  |
| Colorectum | SER |  |
| Colorectum | MSS |  |
| Colorectum | MSI-H |  |
| Colorectum | FAP |  |
| ∗Top 15 enriched GO BP terms are showed in the bar plot of each disease state in each tissue. Each row represents a significant GO biological process which is colored according to the -log10(p.adjust). |
| Page: 1 2 3 4 5 6 7 8 9 |
| GO ID | Tissue | Disease Stage | Description | Gene Ratio | Bg Ratio | pvalue | p.adjust | Count |
| GO:0048568 | Colorectum | AD | embryonic organ development | 112/3918 | 427/18723 | 4.60e-03 | 3.14e-02 | 112 |
| GO:00485681 | Colorectum | MSS | embryonic organ development | 100/3467 | 427/18723 | 6.00e-03 | 4.03e-02 | 100 |
| GO:00485682 | Colorectum | FAP | embryonic organ development | 79/2622 | 427/18723 | 5.32e-03 | 3.49e-02 | 79 |
| GO:00485683 | Colorectum | CRC | embryonic organ development | 65/2078 | 427/18723 | 5.15e-03 | 3.94e-02 | 65 |
| GO:0090596 | Colorectum | CRC | sensory organ morphogenesis | 42/2078 | 256/18723 | 6.22e-03 | 4.54e-02 | 42 |
| GO:00485687 | Esophagus | ESCC | embryonic organ development | 228/8552 | 427/18723 | 7.28e-04 | 3.79e-03 | 228 |
| GO:00485684 | Lung | IAC | embryonic organ development | 64/2061 | 427/18723 | 6.46e-03 | 4.59e-02 | 64 |
| GO:00485686 | Oral cavity | NEOLP | embryonic organ development | 71/2005 | 427/18723 | 1.12e-04 | 1.34e-03 | 71 |
| GO:00485688 | Thyroid | ATC | embryonic organ development | 172/6293 | 427/18723 | 2.08e-03 | 9.84e-03 | 172 |
| Page: 1 |
| Pathway ID | Tissue | Disease Stage | Description | Gene Ratio | Bg Ratio | pvalue | p.adjust | qvalue | Count |
| Page: 1 |
Top |
Cell-cell communication analysis |
| Identification of potential cell-cell interactions between two cell types and their ligand-receptor pairs for different disease states |
| Ligand | Receptor | LRpair | Pathway | Tissue | Disease Stage |
| Page: 1 |
Top |
Single-cell gene regulatory network inference analysis |
| Find out the significant the regulons (TFs) and the target genes of each regulon across cell types for different disease states |
| TF | Cell Type | Tissue | Disease Stage | Target Gene | RSS | Regulon Activity |
| ∗The dot plots of a searched regulon are shown for all cell subpopulations in each disease state of each tissue based on the regulon specific score inferred using pySCENIC and by calculating the average expression. |
| Page: 1 |
Top |
Somatic mutation of malignant transformation related genes |
| Annotation of somatic variants for genes involved in malignant transformation |
| Hugo Symbol | Variant Class | Variant Classification | dbSNP RS | HGVSc | HGVSp | HGVSp Short | SWISSPROT | BIOTYPE | SIFT | PolyPhen | Tumor Sample Barcode | Tissue | Histology | Sex | Age | Stage | Therapy Types | Drugs | Outcome |
| LRIG3 | SNV | Missense_Mutation | rs754028410 | c.1889C>T | p.Pro630Leu | p.P630L | Q6UXM1 | protein_coding | deleterious(0) | probably_damaging(1) | TCGA-5L-AAT1-01 | Breast | breast invasive carcinoma | Female | <65 | III/IV | Hormone Therapy | letrozol | SD |
| LRIG3 | SNV | Missense_Mutation | c.2451N>G | p.Cys817Trp | p.C817W | Q6UXM1 | protein_coding | deleterious(0) | probably_damaging(0.996) | TCGA-A8-A075-01 | Breast | breast invasive carcinoma | Female | <65 | I/II | Chemotherapy | epirubicin | CR | |
| LRIG3 | SNV | Missense_Mutation | rs60376933 | c.1672N>A | p.Glu558Lys | p.E558K | Q6UXM1 | protein_coding | tolerated(0.08) | probably_damaging(0.97) | TCGA-AR-A0TX-01 | Breast | breast invasive carcinoma | Female | <65 | I/II | Unknown | Unknown | SD |
| LRIG3 | SNV | Missense_Mutation | rs780470271 | c.612C>G | p.Ile204Met | p.I204M | Q6UXM1 | protein_coding | deleterious(0.03) | possibly_damaging(0.522) | TCGA-BH-A0AZ-01 | Breast | breast invasive carcinoma | Female | <65 | III/IV | Chemotherapy | doxorubicin | CR |
| LRIG3 | SNV | Missense_Mutation | c.2369N>A | p.Cys790Tyr | p.C790Y | Q6UXM1 | protein_coding | deleterious(0) | probably_damaging(0.996) | TCGA-BH-A0HB-01 | Breast | breast invasive carcinoma | Female | <65 | I/II | Chemotherapy | docetaxel | SD | |
| LRIG3 | insertion | Nonsense_Mutation | novel | c.536_537insATTCTCATAAAC | p.Val179_Thr180insPheSerTerThr | p.V179_T180insFS*T | Q6UXM1 | protein_coding | TCGA-AR-A0U0-01 | Breast | breast invasive carcinoma | Female | >=65 | I/II | Unknown | Unknown | SD | ||
| LRIG3 | deletion | Frame_Shift_Del | novel | c.1785delN | p.Lys596SerfsTer4 | p.K596Sfs*4 | Q6UXM1 | protein_coding | TCGA-D8-A27V-01 | Breast | breast invasive carcinoma | Female | <65 | I/II | Hormone Therapy | tamoxiphen | SD | ||
| LRIG3 | deletion | Frame_Shift_Del | novel | c.1608delN | p.Asp537ThrfsTer23 | p.D537Tfs*23 | Q6UXM1 | protein_coding | TCGA-D8-A27V-01 | Breast | breast invasive carcinoma | Female | <65 | I/II | Hormone Therapy | tamoxiphen | SD | ||
| LRIG3 | deletion | Frame_Shift_Del | c.2099delN | p.Leu700CysfsTer9 | p.L700Cfs*9 | Q6UXM1 | protein_coding | TCGA-EW-A2FV-01 | Breast | breast invasive carcinoma | Female | <65 | III/IV | Chemotherapy | docetaxel | SD | |||
| LRIG3 | SNV | Missense_Mutation | rs374158553 | c.2143N>A | p.Val715Ile | p.V715I | Q6UXM1 | protein_coding | deleterious(0.01) | probably_damaging(0.928) | TCGA-2W-A8YY-01 | Cervix | cervical & endocervical cancer | Female | <65 | I/II | Chemotherapy | cisplatin | CR |
| Page: 1 2 3 4 5 6 7 8 9 10 11 12 |
Top |
Related drugs of malignant transformation related genes |
| Identification of chemicals and drugs interact with genes involved in malignant transfromation |
| (DGIdb 4.0) |
| Entrez ID | Symbol | Category | Interaction Types | Drug Claim Name | Drug Name | PMIDs |
| Page: 1 |

Copyright 2023-Present -The University of Texas Health Science Center at Houston |