
|
|||||
|
 | |
| |
| |
| |
| |
| |
|
Gene: LRIG2 |
Gene summary for LRIG2 |
| Gene information | Species | Human | Gene symbol | LRIG2 | Gene ID | 9860 |
| Gene name | leucine rich repeats and immunoglobulin like domains 2 | |
| Gene Alias | LIG-2 | |
| Cytomap | 1p13.2 | |
| Gene Type | protein-coding | GO ID | GO:0001764 | UniProtAcc | O94898 |
Top |
Malignant transformation analysis |
| Identification of the aberrant gene expression in precancerous and cancerous lesions by comparing the gene expression of stem-like cells in diseased tissues with normal stem cells |
| Entrez ID | Symbol | Replicates | Species | Organ | Tissue | Adj P-value | Log2FC | Malignancy |
| 9860 | LRIG2 | GSM6177620_NYU_UCEC1_lib1_lib1 | Human | Endometrium | EEC | 3.61e-03 | -2.46e-02 | -0.1869 |
| 9860 | LRIG2 | GSM6177620_NYU_UCEC1_lib3_lib3 | Human | Endometrium | EEC | 4.25e-03 | -3.95e-02 | -0.1883 |
| 9860 | LRIG2 | GSM6177622_NYU_UCEC3_lib1_lib1 | Human | Endometrium | EEC | 5.65e-03 | -8.51e-02 | -0.1917 |
| 9860 | LRIG2 | GSM6177622_NYU_UCEC3_lib2_lib2 | Human | Endometrium | EEC | 3.44e-04 | -6.51e-02 | -0.1916 |
| 9860 | LRIG2 | LZE4T | Human | Esophagus | ESCC | 3.63e-04 | 1.32e-01 | 0.0811 |
| 9860 | LRIG2 | P2T-E | Human | Esophagus | ESCC | 4.02e-10 | 1.96e-01 | 0.1177 |
| 9860 | LRIG2 | P4T-E | Human | Esophagus | ESCC | 4.85e-03 | 9.87e-02 | 0.1323 |
| 9860 | LRIG2 | P5T-E | Human | Esophagus | ESCC | 7.70e-08 | 6.63e-02 | 0.1327 |
| 9860 | LRIG2 | P8T-E | Human | Esophagus | ESCC | 7.53e-09 | 1.27e-01 | 0.0889 |
| 9860 | LRIG2 | P9T-E | Human | Esophagus | ESCC | 4.98e-02 | 8.43e-02 | 0.1131 |
| 9860 | LRIG2 | P10T-E | Human | Esophagus | ESCC | 3.17e-35 | 5.09e-01 | 0.116 |
| 9860 | LRIG2 | P11T-E | Human | Esophagus | ESCC | 1.16e-03 | 1.77e-01 | 0.1426 |
| 9860 | LRIG2 | P12T-E | Human | Esophagus | ESCC | 7.87e-49 | 7.23e-01 | 0.1122 |
| 9860 | LRIG2 | P15T-E | Human | Esophagus | ESCC | 6.76e-06 | 1.67e-01 | 0.1149 |
| 9860 | LRIG2 | P16T-E | Human | Esophagus | ESCC | 1.16e-08 | 9.19e-02 | 0.1153 |
| 9860 | LRIG2 | P20T-E | Human | Esophagus | ESCC | 4.82e-04 | 1.22e-01 | 0.1124 |
| 9860 | LRIG2 | P21T-E | Human | Esophagus | ESCC | 1.06e-04 | 3.91e-02 | 0.1617 |
| 9860 | LRIG2 | P22T-E | Human | Esophagus | ESCC | 1.97e-13 | 1.63e-01 | 0.1236 |
| 9860 | LRIG2 | P23T-E | Human | Esophagus | ESCC | 3.42e-03 | 1.33e-01 | 0.108 |
| 9860 | LRIG2 | P26T-E | Human | Esophagus | ESCC | 1.10e-05 | 8.70e-02 | 0.1276 |
| Page: 1 2 3 |
| Tissue | Expression Dynamics | Abbreviation |
| Endometrium | 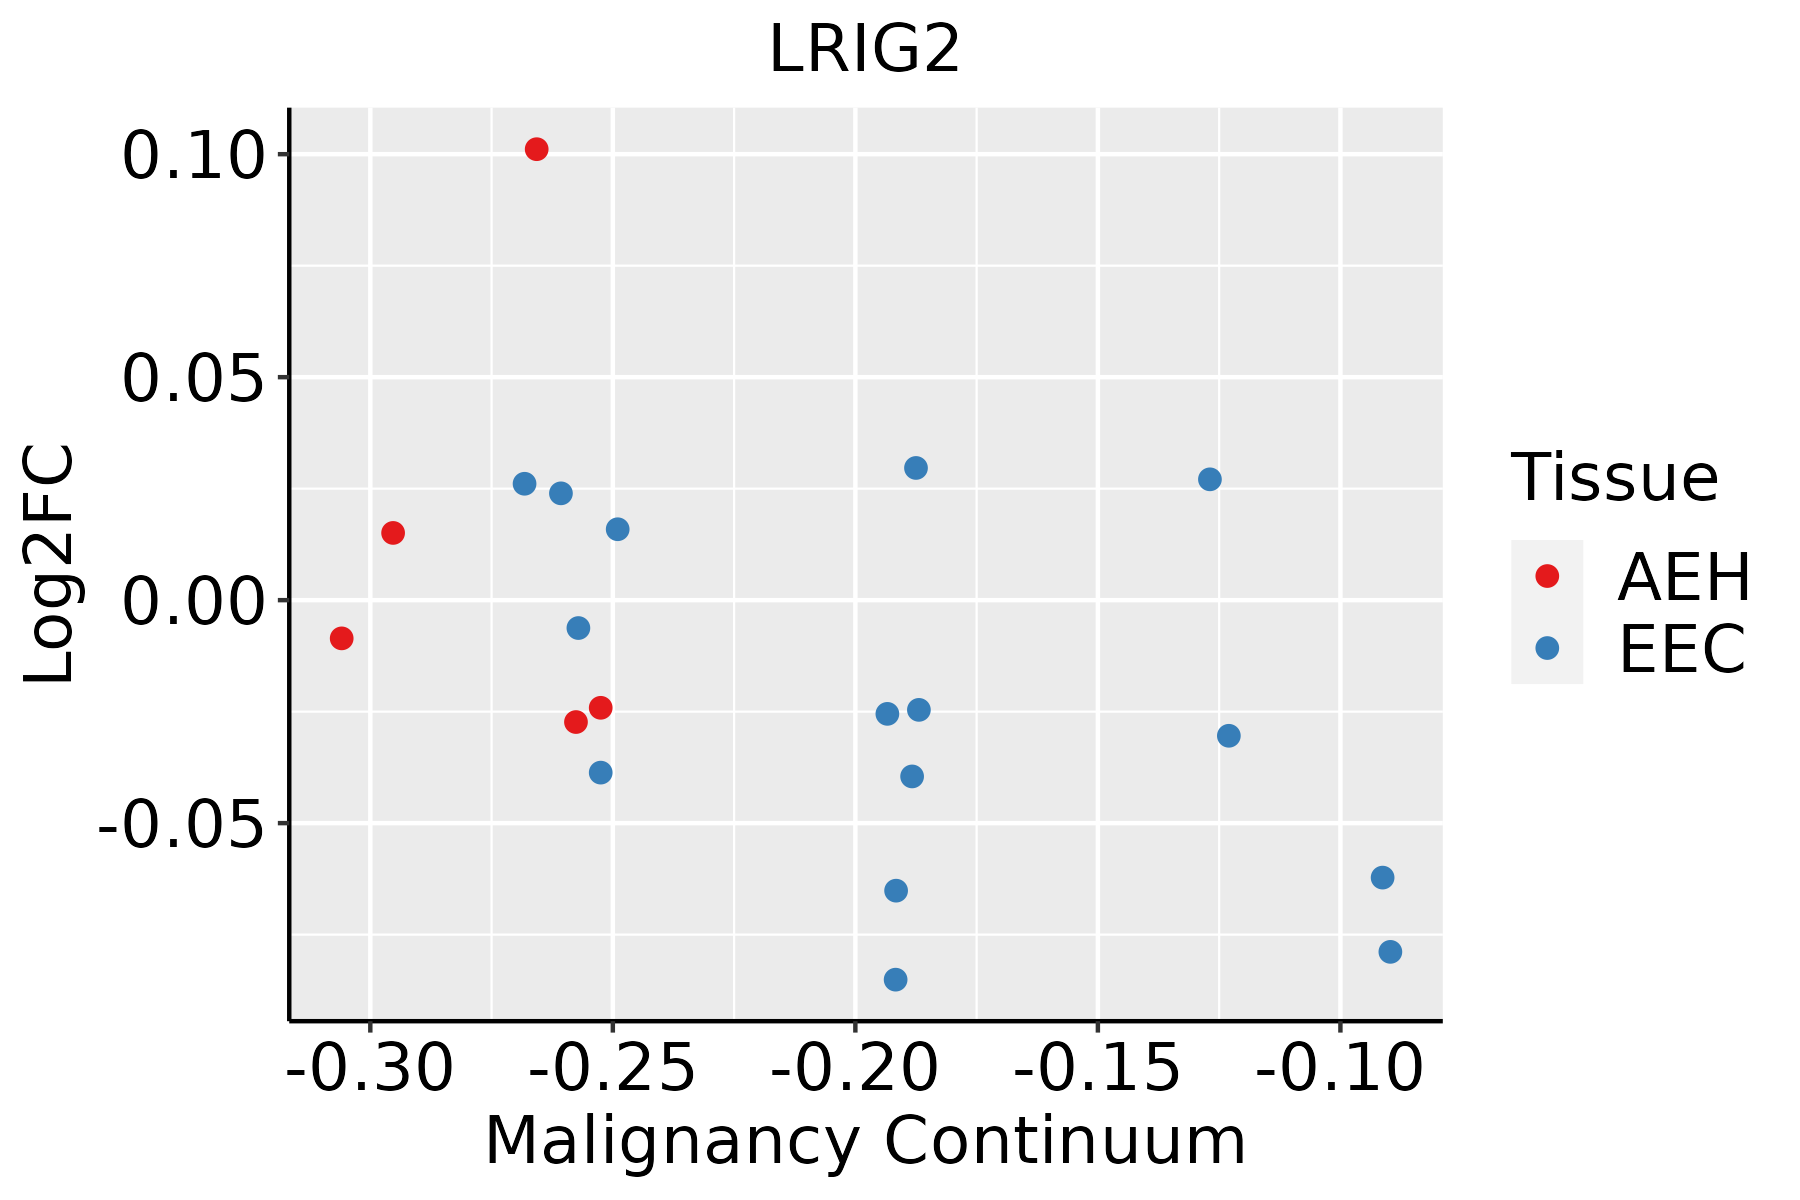 | AEH: Atypical endometrial hyperplasia |
| EEC: Endometrioid Cancer | ||
| Esophagus |  | ESCC: Esophageal squamous cell carcinoma |
| HGIN: High-grade intraepithelial neoplasias | ||
| LGIN: Low-grade intraepithelial neoplasias |
| ∗log2FC in expression of this searched gene in stem-like cells from each diseased tissue sample relative to stem-like cells in normal samples in each tissue plotted against the malignancy continuum. Samples are colored based on if they are from different disease stage. |
Top |
Malignant transformation related pathway analysis |
| Find out the enriched GO biological processes and KEGG pathways involved in transition from healthy to precancer to cancer |
| Tissue | Disease Stage | Enriched GO biological Processes |
| Colorectum | AD |  |
| Colorectum | SER |  |
| Colorectum | MSS |  |
| Colorectum | MSI-H |  |
| Colorectum | FAP |  |
| ∗Top 15 enriched GO BP terms are showed in the bar plot of each disease state in each tissue. Each row represents a significant GO biological process which is colored according to the -log10(p.adjust). |
| Page: 1 2 3 4 5 6 7 8 9 |
| GO ID | Tissue | Disease Stage | Description | Gene Ratio | Bg Ratio | pvalue | p.adjust | Count |
| GO:004217617 | Endometrium | EEC | regulation of protein catabolic process | 103/2168 | 391/18723 | 3.54e-16 | 1.52e-13 | 103 |
| GO:190382917 | Endometrium | EEC | positive regulation of cellular protein localization | 67/2168 | 276/18723 | 2.27e-09 | 1.84e-07 | 67 |
| GO:006156412 | Endometrium | EEC | axon development | 93/2168 | 467/18723 | 9.60e-08 | 4.69e-06 | 93 |
| GO:004217716 | Endometrium | EEC | negative regulation of protein catabolic process | 35/2168 | 121/18723 | 1.79e-07 | 8.20e-06 | 35 |
| GO:004586117 | Endometrium | EEC | negative regulation of proteolysis | 72/2168 | 351/18723 | 8.46e-07 | 2.98e-05 | 72 |
| GO:003109914 | Endometrium | EEC | regeneration | 45/2168 | 198/18723 | 6.19e-06 | 1.49e-04 | 45 |
| GO:003133017 | Endometrium | EEC | negative regulation of cellular catabolic process | 55/2168 | 262/18723 | 7.93e-06 | 1.80e-04 | 55 |
| GO:000989516 | Endometrium | EEC | negative regulation of catabolic process | 61/2168 | 320/18723 | 5.76e-05 | 8.97e-04 | 61 |
| GO:001097513 | Endometrium | EEC | regulation of neuron projection development | 79/2168 | 445/18723 | 6.80e-05 | 1.01e-03 | 79 |
| GO:190303415 | Endometrium | EEC | regulation of response to wounding | 36/2168 | 167/18723 | 1.58e-04 | 1.99e-03 | 36 |
| GO:00017641 | Endometrium | EEC | neuron migration | 33/2168 | 156/18723 | 4.17e-04 | 4.38e-03 | 33 |
| GO:0031102 | Endometrium | EEC | neuron projection regeneration | 15/2168 | 60/18723 | 2.88e-03 | 2.03e-02 | 15 |
| GO:00311031 | Endometrium | EEC | axon regeneration | 13/2168 | 52/18723 | 5.34e-03 | 3.31e-02 | 13 |
| GO:00486783 | Endometrium | EEC | response to axon injury | 18/2168 | 83/18723 | 6.04e-03 | 3.57e-02 | 18 |
| GO:0042176111 | Esophagus | ESCC | regulation of protein catabolic process | 280/8552 | 391/18723 | 8.65e-26 | 2.39e-23 | 280 |
| GO:1903829111 | Esophagus | ESCC | positive regulation of cellular protein localization | 199/8552 | 276/18723 | 2.99e-19 | 3.45e-17 | 199 |
| GO:0009895111 | Esophagus | ESCC | negative regulation of catabolic process | 201/8552 | 320/18723 | 3.88e-10 | 1.05e-08 | 201 |
| GO:0031330111 | Esophagus | ESCC | negative regulation of cellular catabolic process | 166/8552 | 262/18723 | 5.17e-09 | 1.08e-07 | 166 |
| GO:0042177111 | Esophagus | ESCC | negative regulation of protein catabolic process | 84/8552 | 121/18723 | 1.03e-07 | 1.69e-06 | 84 |
| GO:003109910 | Esophagus | ESCC | regeneration | 122/8552 | 198/18723 | 4.26e-06 | 4.57e-05 | 122 |
| Page: 1 2 |
| Pathway ID | Tissue | Disease Stage | Description | Gene Ratio | Bg Ratio | pvalue | p.adjust | qvalue | Count |
| hsa0436022 | Endometrium | EEC | Axon guidance | 39/1237 | 182/8465 | 7.78e-03 | 3.66e-02 | 2.73e-02 | 39 |
| hsa0436032 | Endometrium | EEC | Axon guidance | 39/1237 | 182/8465 | 7.78e-03 | 3.66e-02 | 2.73e-02 | 39 |
| hsa0436016 | Esophagus | ESCC | Axon guidance | 108/4205 | 182/8465 | 5.13e-03 | 1.30e-02 | 6.67e-03 | 108 |
| hsa0436017 | Esophagus | ESCC | Axon guidance | 108/4205 | 182/8465 | 5.13e-03 | 1.30e-02 | 6.67e-03 | 108 |
| Page: 1 |
Top |
Cell-cell communication analysis |
| Identification of potential cell-cell interactions between two cell types and their ligand-receptor pairs for different disease states |
| Ligand | Receptor | LRpair | Pathway | Tissue | Disease Stage |
| Page: 1 |
Top |
Single-cell gene regulatory network inference analysis |
| Find out the significant the regulons (TFs) and the target genes of each regulon across cell types for different disease states |
| TF | Cell Type | Tissue | Disease Stage | Target Gene | RSS | Regulon Activity |
| ∗The dot plots of a searched regulon are shown for all cell subpopulations in each disease state of each tissue based on the regulon specific score inferred using pySCENIC and by calculating the average expression. |
| Page: 1 |
Top |
Somatic mutation of malignant transformation related genes |
| Annotation of somatic variants for genes involved in malignant transformation |
| Hugo Symbol | Variant Class | Variant Classification | dbSNP RS | HGVSc | HGVSp | HGVSp Short | SWISSPROT | BIOTYPE | SIFT | PolyPhen | Tumor Sample Barcode | Tissue | Histology | Sex | Age | Stage | Therapy Types | Drugs | Outcome |
| LRIG2 | SNV | Missense_Mutation | c.1942G>A | p.Glu648Lys | p.E648K | O94898 | protein_coding | deleterious(0.03) | possibly_damaging(0.893) | TCGA-AC-A23H-01 | Breast | breast invasive carcinoma | Female | >=65 | I/II | Unknown | Unknown | PD | |
| LRIG2 | SNV | Missense_Mutation | c.2401G>C | p.Asp801His | p.D801H | O94898 | protein_coding | deleterious(0) | probably_damaging(0.984) | TCGA-AC-A23H-01 | Breast | breast invasive carcinoma | Female | >=65 | I/II | Unknown | Unknown | PD | |
| LRIG2 | SNV | Missense_Mutation | novel | c.1225C>G | p.Leu409Val | p.L409V | O94898 | protein_coding | deleterious(0) | probably_damaging(0.985) | TCGA-AC-A3W5-01 | Breast | breast invasive carcinoma | Female | >=65 | I/II | Chemotherapy | docetaxel | CR |
| LRIG2 | SNV | Missense_Mutation | c.2909C>T | p.Ala970Val | p.A970V | O94898 | protein_coding | tolerated(0.6) | benign(0) | TCGA-AO-A0J3-01 | Breast | breast invasive carcinoma | Female | >=65 | I/II | Chemotherapy | cyclophosphamide | SD | |
| LRIG2 | SNV | Missense_Mutation | novel | c.1706N>G | p.Asn569Ser | p.N569S | O94898 | protein_coding | tolerated(0.13) | benign(0.012) | TCGA-AO-A128-01 | Breast | breast invasive carcinoma | Female | <65 | I/II | Chemotherapy | doxorubicin | SD |
| LRIG2 | SNV | Missense_Mutation | c.161N>A | p.Leu54Gln | p.L54Q | O94898 | protein_coding | deleterious(0) | probably_damaging(0.96) | TCGA-D8-A1Y0-01 | Breast | breast invasive carcinoma | Female | >=65 | III/IV | Chemotherapy | cyclophosphamide+methotrexatum+fluorouracillum | SD | |
| LRIG2 | SNV | Missense_Mutation | c.250N>G | p.His84Asp | p.H84D | O94898 | protein_coding | deleterious(0.02) | benign(0.048) | TCGA-D8-A27G-01 | Breast | breast invasive carcinoma | Female | >=65 | I/II | Unknown | Unknown | SD | |
| LRIG2 | deletion | Frame_Shift_Del | novel | c.1146delT | p.Phe382LeufsTer10 | p.F382Lfs*10 | O94898 | protein_coding | TCGA-D8-A27V-01 | Breast | breast invasive carcinoma | Female | <65 | I/II | Hormone Therapy | tamoxiphen | SD | ||
| LRIG2 | SNV | Missense_Mutation | novel | c.2903C>T | p.Pro968Leu | p.P968L | O94898 | protein_coding | tolerated(0.32) | benign(0) | TCGA-2W-A8YY-01 | Cervix | cervical & endocervical cancer | Female | <65 | I/II | Chemotherapy | cisplatin | CR |
| LRIG2 | SNV | Missense_Mutation | c.2617N>A | p.Glu873Lys | p.E873K | O94898 | protein_coding | deleterious(0) | possibly_damaging(0.824) | TCGA-C5-A1BL-01 | Cervix | cervical & endocervical cancer | Female | <65 | I/II | Unknown | Unknown | SD |
| Page: 1 2 3 4 5 6 7 8 9 10 11 |
Top |
Related drugs of malignant transformation related genes |
| Identification of chemicals and drugs interact with genes involved in malignant transfromation |
| (DGIdb 4.0) |
| Entrez ID | Symbol | Category | Interaction Types | Drug Claim Name | Drug Name | PMIDs |
| Page: 1 |

Copyright 2023-Present -The University of Texas Health Science Center at Houston |