
|
|||||
|
 | |
| |
| |
| |
| |
| |
|
Gene: LRIG1 |
Gene summary for LRIG1 |
| Gene information | Species | Human | Gene symbol | LRIG1 | Gene ID | 26018 |
| Gene name | leucine rich repeats and immunoglobulin like domains 1 | |
| Gene Alias | LIG-1 | |
| Cytomap | 3p14.1 | |
| Gene Type | protein-coding | GO ID | GO:0003008 | UniProtAcc | Q96JA1 |
Top |
Malignant transformation analysis |
| Identification of the aberrant gene expression in precancerous and cancerous lesions by comparing the gene expression of stem-like cells in diseased tissues with normal stem cells |
| Entrez ID | Symbol | Replicates | Species | Organ | Tissue | Adj P-value | Log2FC | Malignancy |
| 26018 | LRIG1 | HTA11_3410_2000001011 | Human | Colorectum | AD | 3.20e-26 | -8.09e-01 | 0.0155 |
| 26018 | LRIG1 | HTA11_2487_2000001011 | Human | Colorectum | SER | 7.59e-09 | -6.74e-01 | -0.1808 |
| 26018 | LRIG1 | HTA11_1938_2000001011 | Human | Colorectum | AD | 3.33e-07 | -6.45e-01 | -0.0811 |
| 26018 | LRIG1 | HTA11_78_2000001011 | Human | Colorectum | AD | 4.08e-16 | -7.79e-01 | -0.1088 |
| 26018 | LRIG1 | HTA11_347_2000001011 | Human | Colorectum | AD | 2.98e-03 | -3.60e-01 | -0.1954 |
| 26018 | LRIG1 | HTA11_3361_2000001011 | Human | Colorectum | AD | 4.17e-08 | -6.97e-01 | -0.1207 |
| 26018 | LRIG1 | HTA11_83_2000001011 | Human | Colorectum | SER | 6.23e-04 | -5.85e-01 | -0.1526 |
| 26018 | LRIG1 | HTA11_696_2000001011 | Human | Colorectum | AD | 1.66e-17 | -5.47e-01 | -0.1464 |
| 26018 | LRIG1 | HTA11_866_2000001011 | Human | Colorectum | AD | 4.30e-19 | -5.55e-01 | -0.1001 |
| 26018 | LRIG1 | HTA11_1391_2000001011 | Human | Colorectum | AD | 8.86e-08 | -6.05e-01 | -0.059 |
| 26018 | LRIG1 | HTA11_5212_2000001011 | Human | Colorectum | AD | 7.14e-05 | -8.08e-01 | -0.2061 |
| 26018 | LRIG1 | HTA11_5216_2000001011 | Human | Colorectum | SER | 2.06e-02 | -7.69e-01 | -0.1462 |
| 26018 | LRIG1 | HTA11_546_2000001011 | Human | Colorectum | AD | 6.68e-03 | -5.03e-01 | -0.0842 |
| 26018 | LRIG1 | HTA11_866_3004761011 | Human | Colorectum | AD | 2.99e-12 | -6.23e-01 | 0.096 |
| 26018 | LRIG1 | HTA11_10623_2000001011 | Human | Colorectum | AD | 3.66e-02 | -4.46e-01 | -0.0177 |
| 26018 | LRIG1 | HTA11_10711_2000001011 | Human | Colorectum | AD | 3.35e-06 | -5.61e-01 | 0.0338 |
| 26018 | LRIG1 | HTA11_7696_3000711011 | Human | Colorectum | AD | 2.37e-24 | -6.36e-01 | 0.0674 |
| 26018 | LRIG1 | HTA11_99999970781_79442 | Human | Colorectum | MSS | 1.74e-14 | -4.42e-01 | 0.294 |
| 26018 | LRIG1 | HTA11_99999971662_82457 | Human | Colorectum | MSS | 2.28e-04 | -2.91e-01 | 0.3859 |
| 26018 | LRIG1 | HTA11_99999974143_84620 | Human | Colorectum | MSS | 5.41e-32 | -7.46e-01 | 0.3005 |
| Page: 1 2 3 4 5 6 7 8 |
| Tissue | Expression Dynamics | Abbreviation |
| Colorectum (GSE201348) | 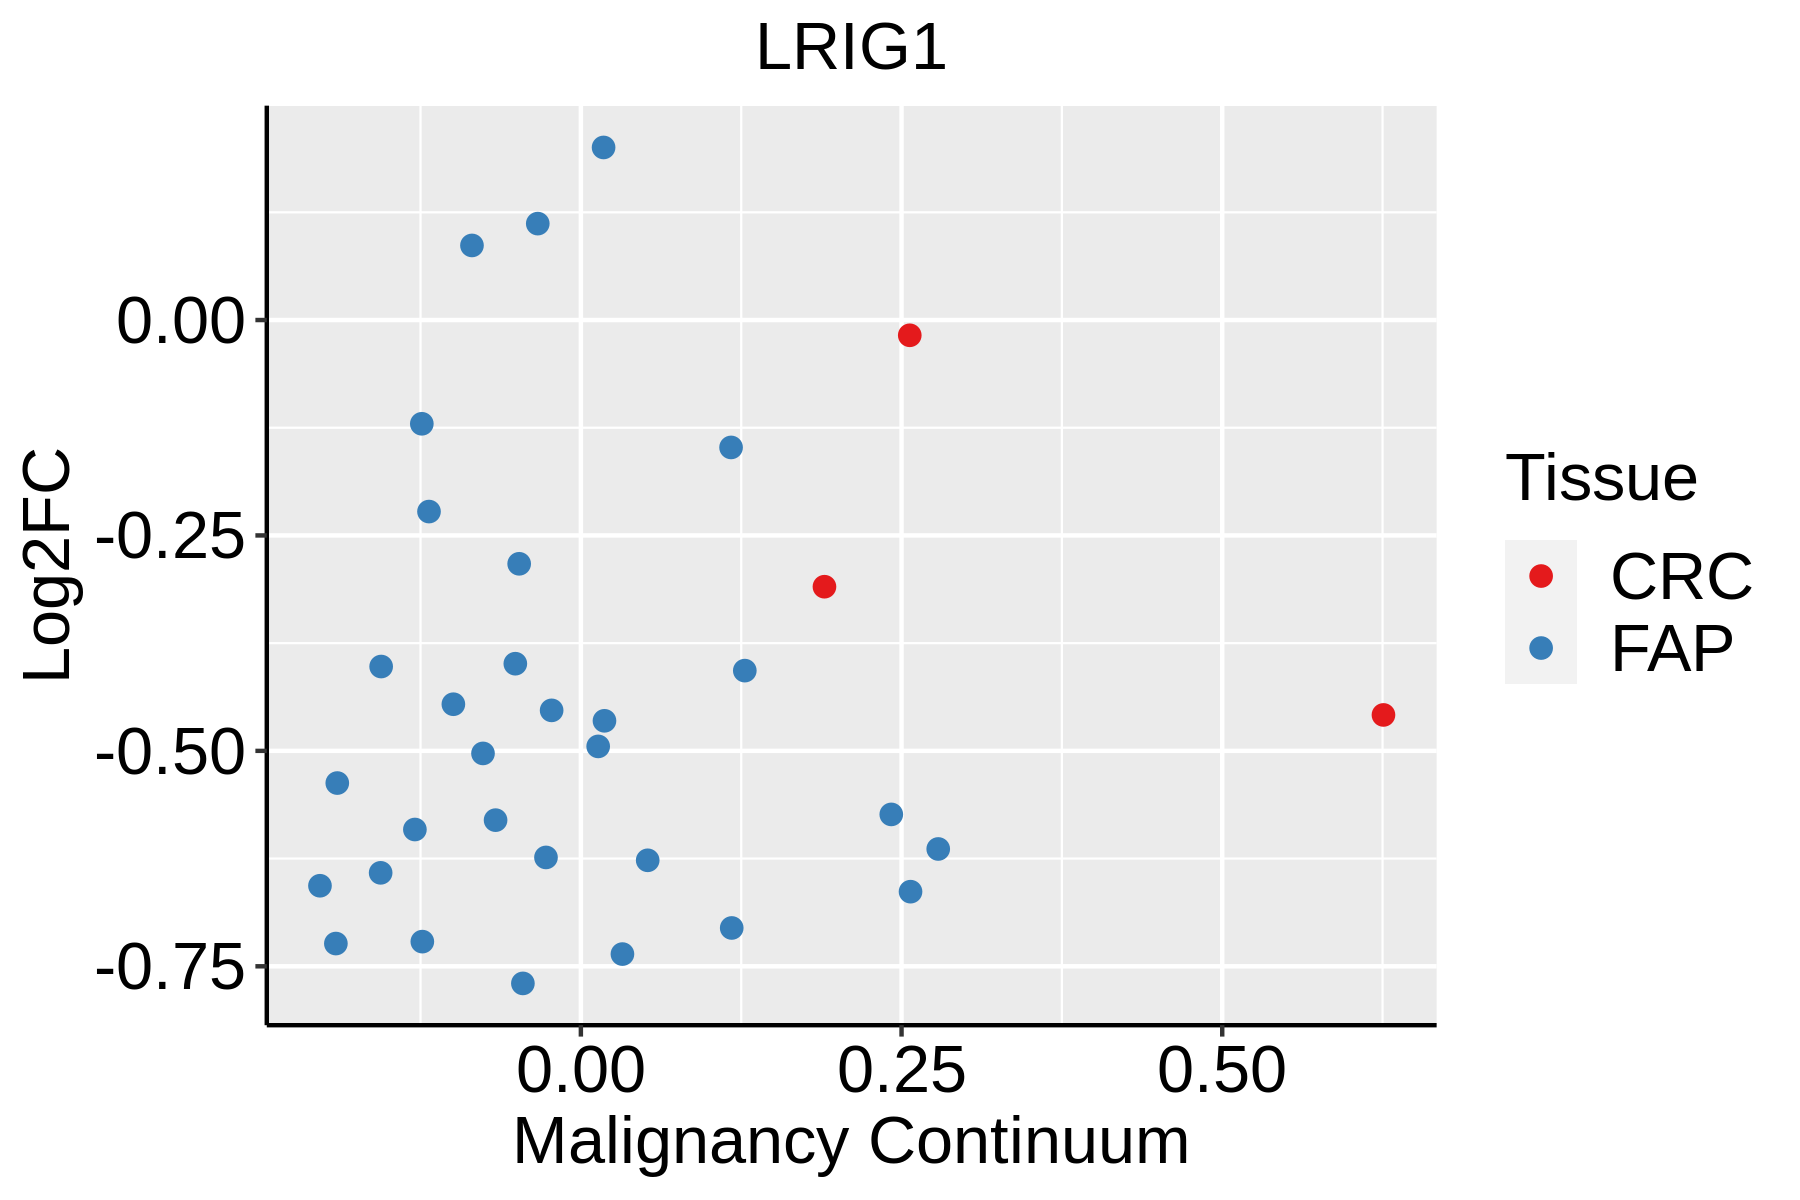 | FAP: Familial adenomatous polyposis |
| CRC: Colorectal cancer | ||
| Colorectum (HTA11) |  | AD: Adenomas |
| SER: Sessile serrated lesions | ||
| MSI-H: Microsatellite-high colorectal cancer | ||
| MSS: Microsatellite stable colorectal cancer | ||
| Endometrium | 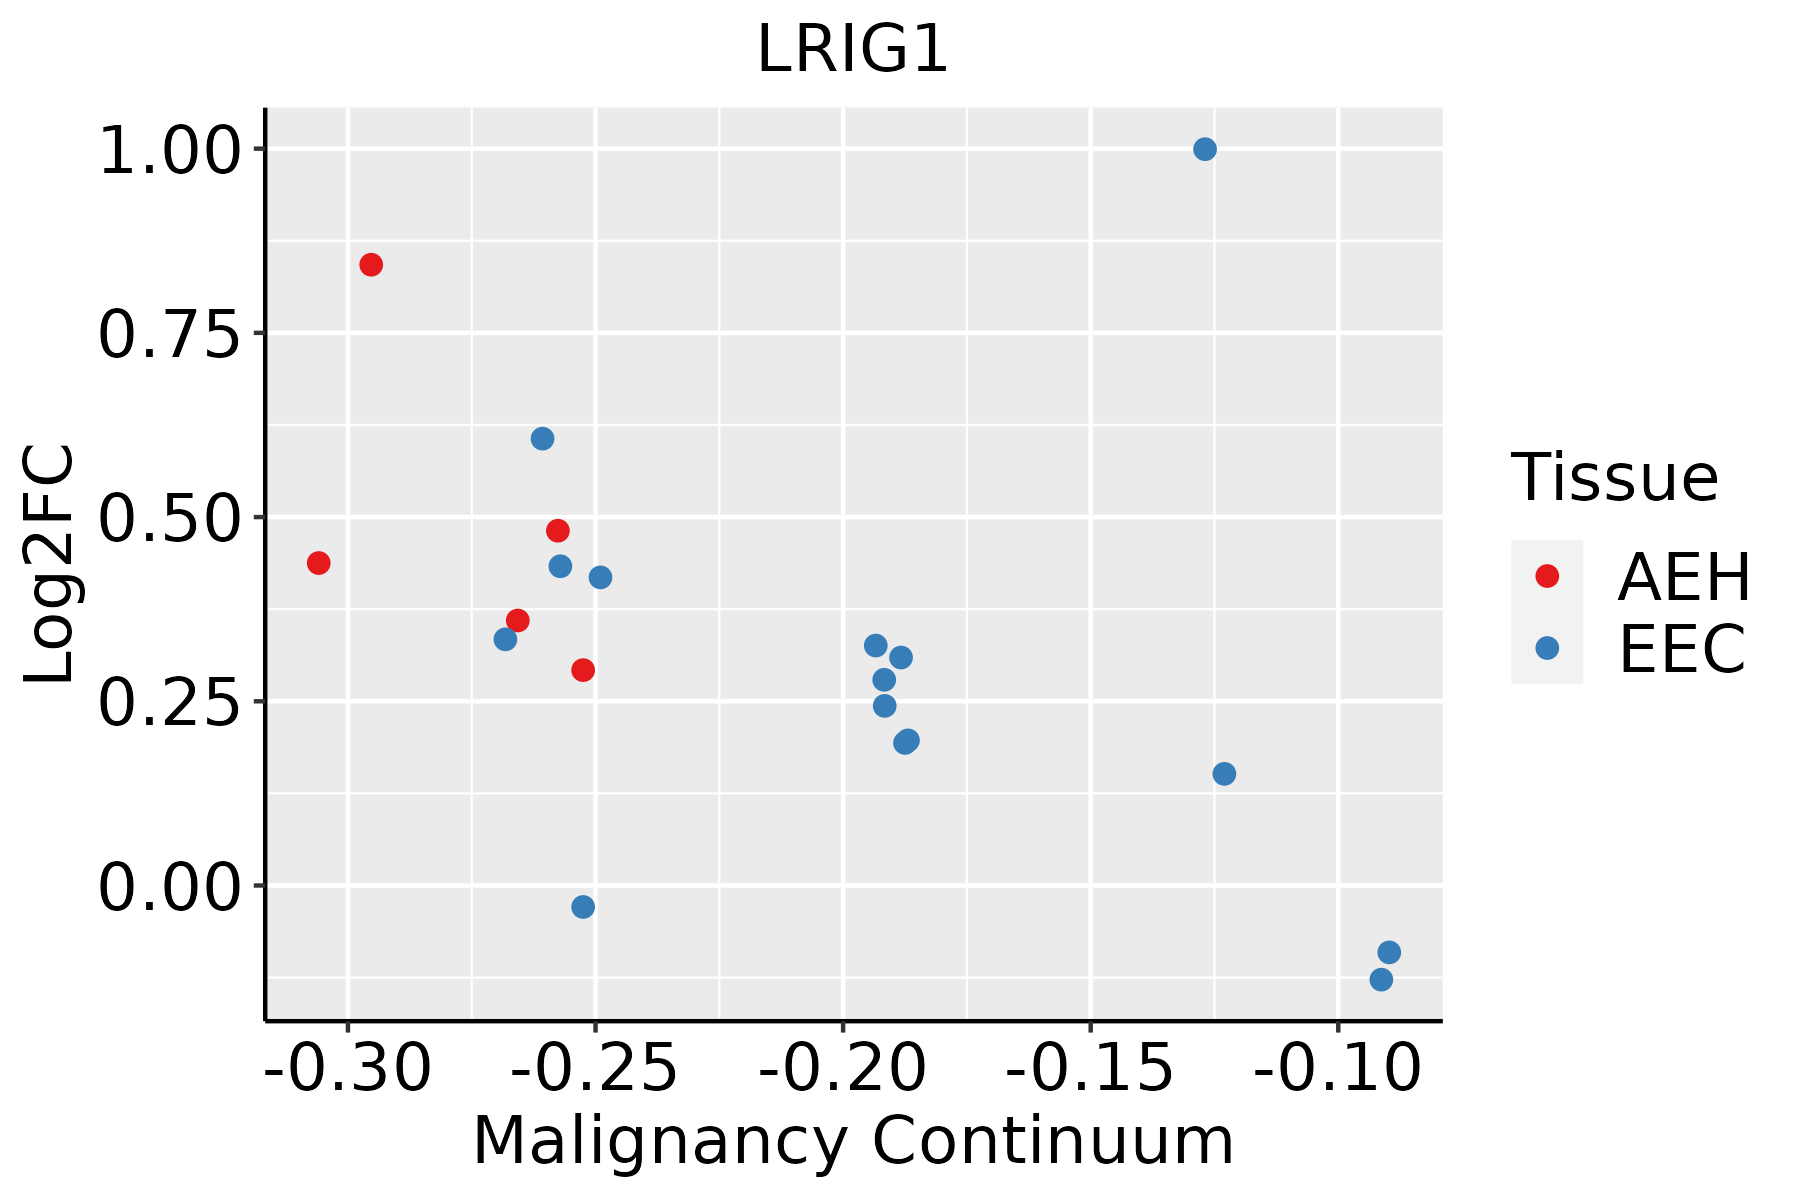 | AEH: Atypical endometrial hyperplasia |
| EEC: Endometrioid Cancer | ||
| Esophagus | 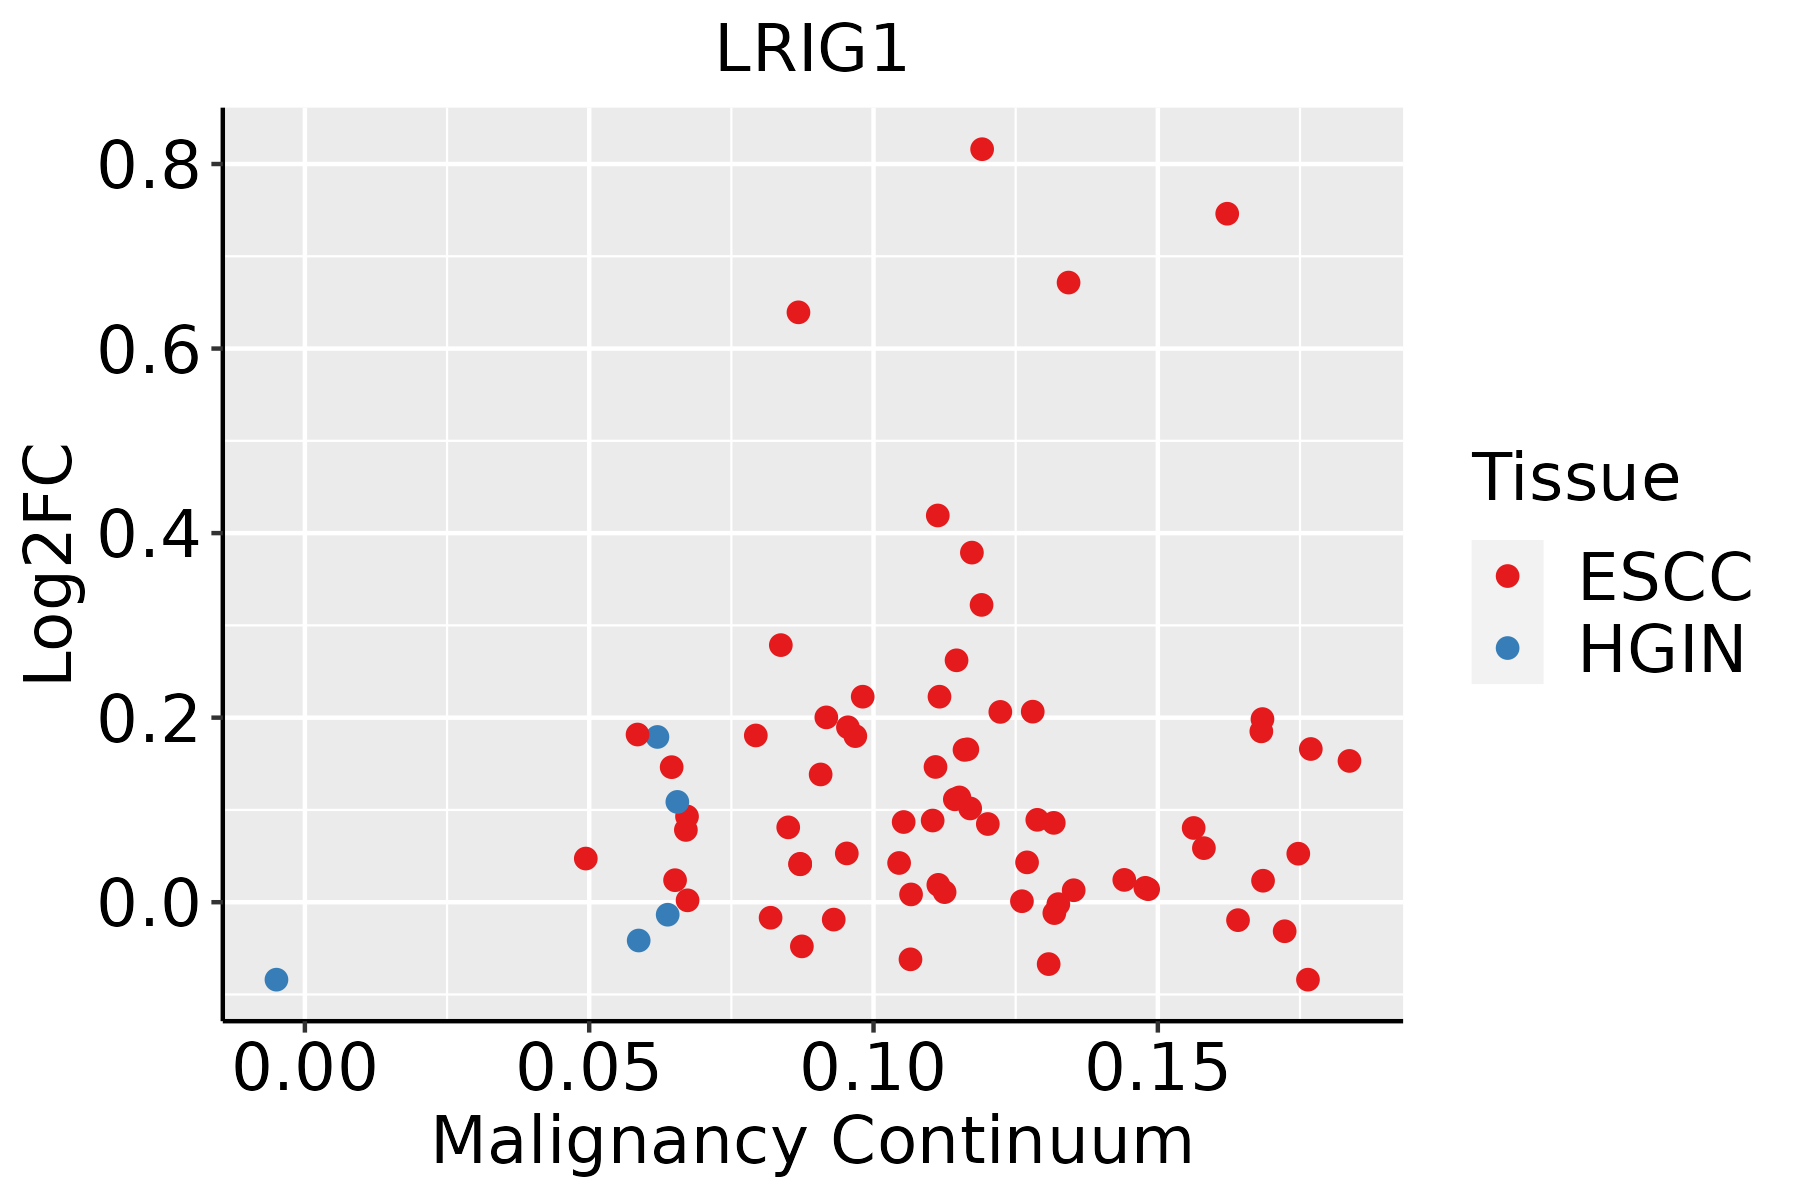 | ESCC: Esophageal squamous cell carcinoma |
| HGIN: High-grade intraepithelial neoplasias | ||
| LGIN: Low-grade intraepithelial neoplasias | ||
| Liver | 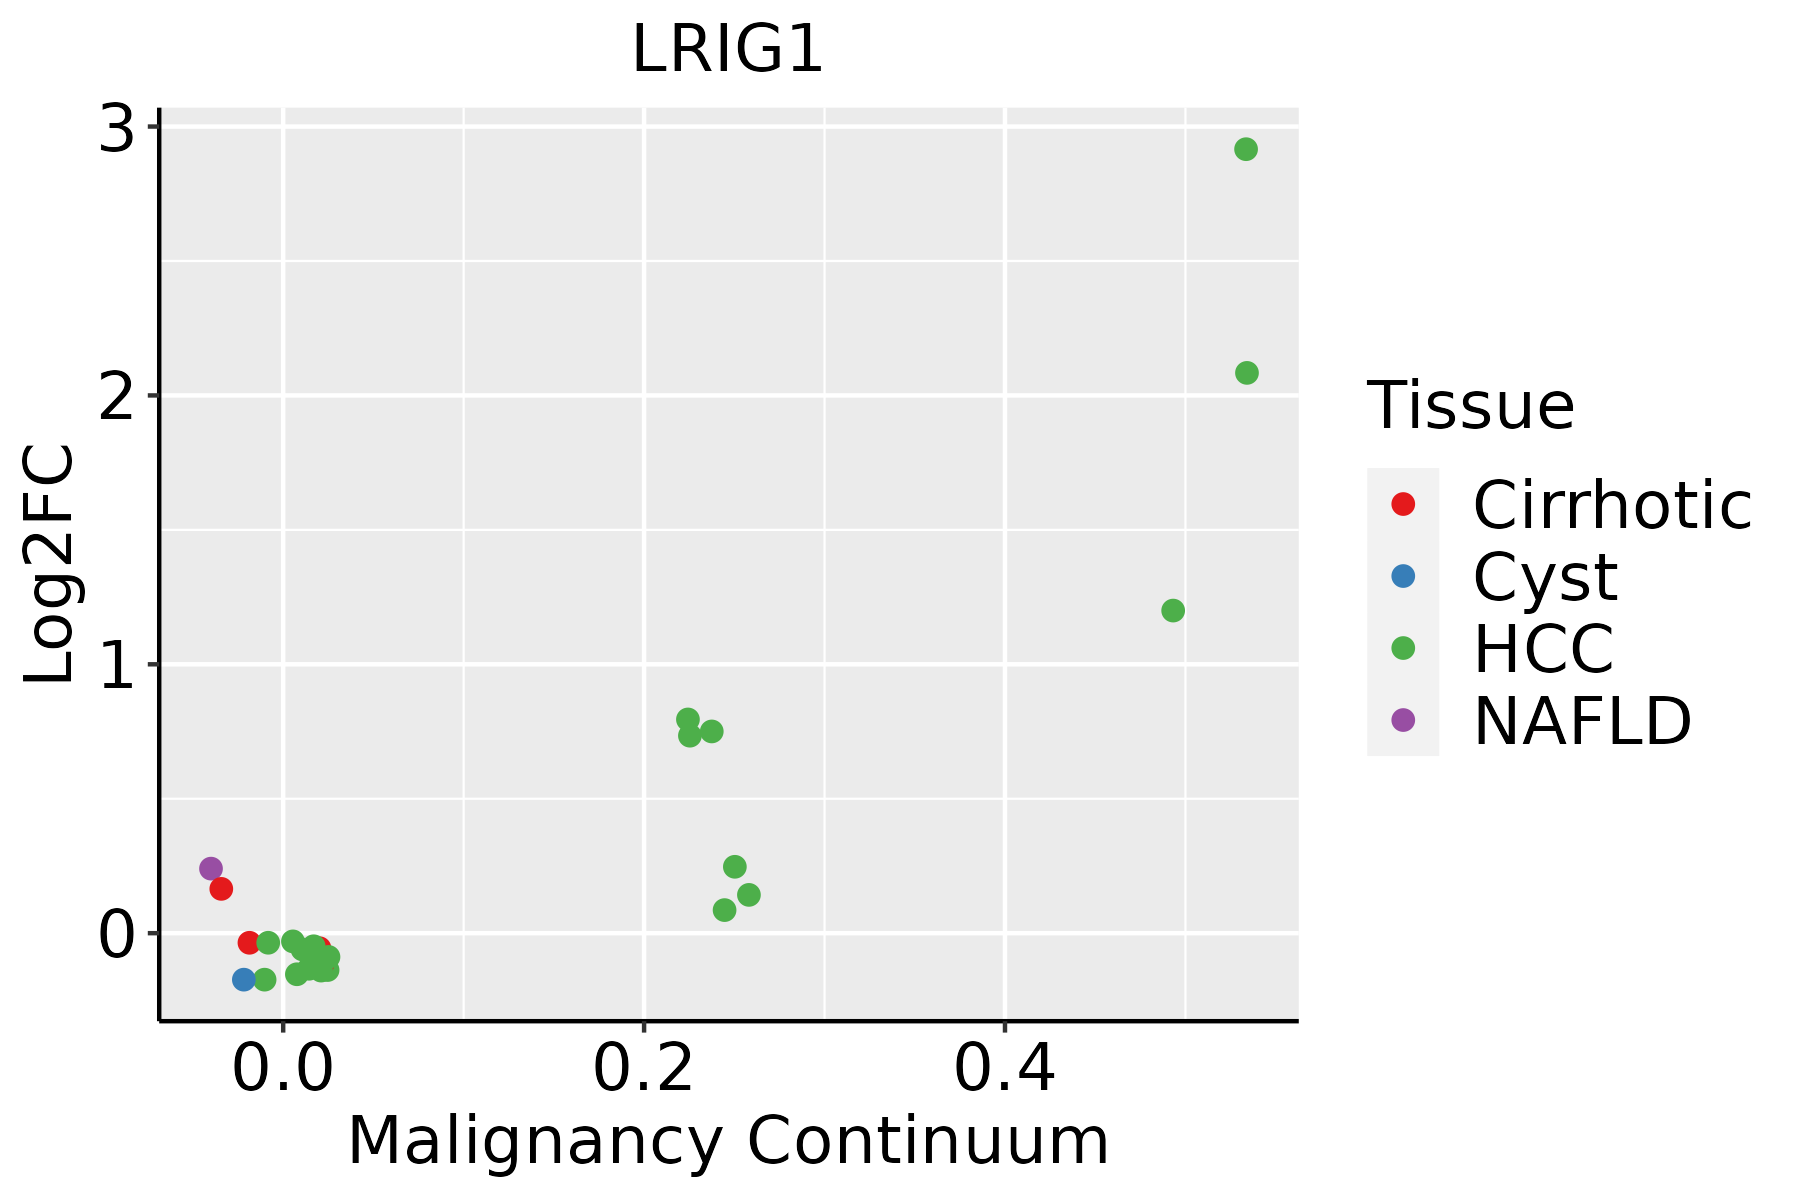 | HCC: Hepatocellular carcinoma |
| NAFLD: Non-alcoholic fatty liver disease | ||
| Lung |  | AAH: Atypical adenomatous hyperplasia |
| AIS: Adenocarcinoma in situ | ||
| IAC: Invasive lung adenocarcinoma | ||
| MIA: Minimally invasive adenocarcinoma | ||
| Prostate | 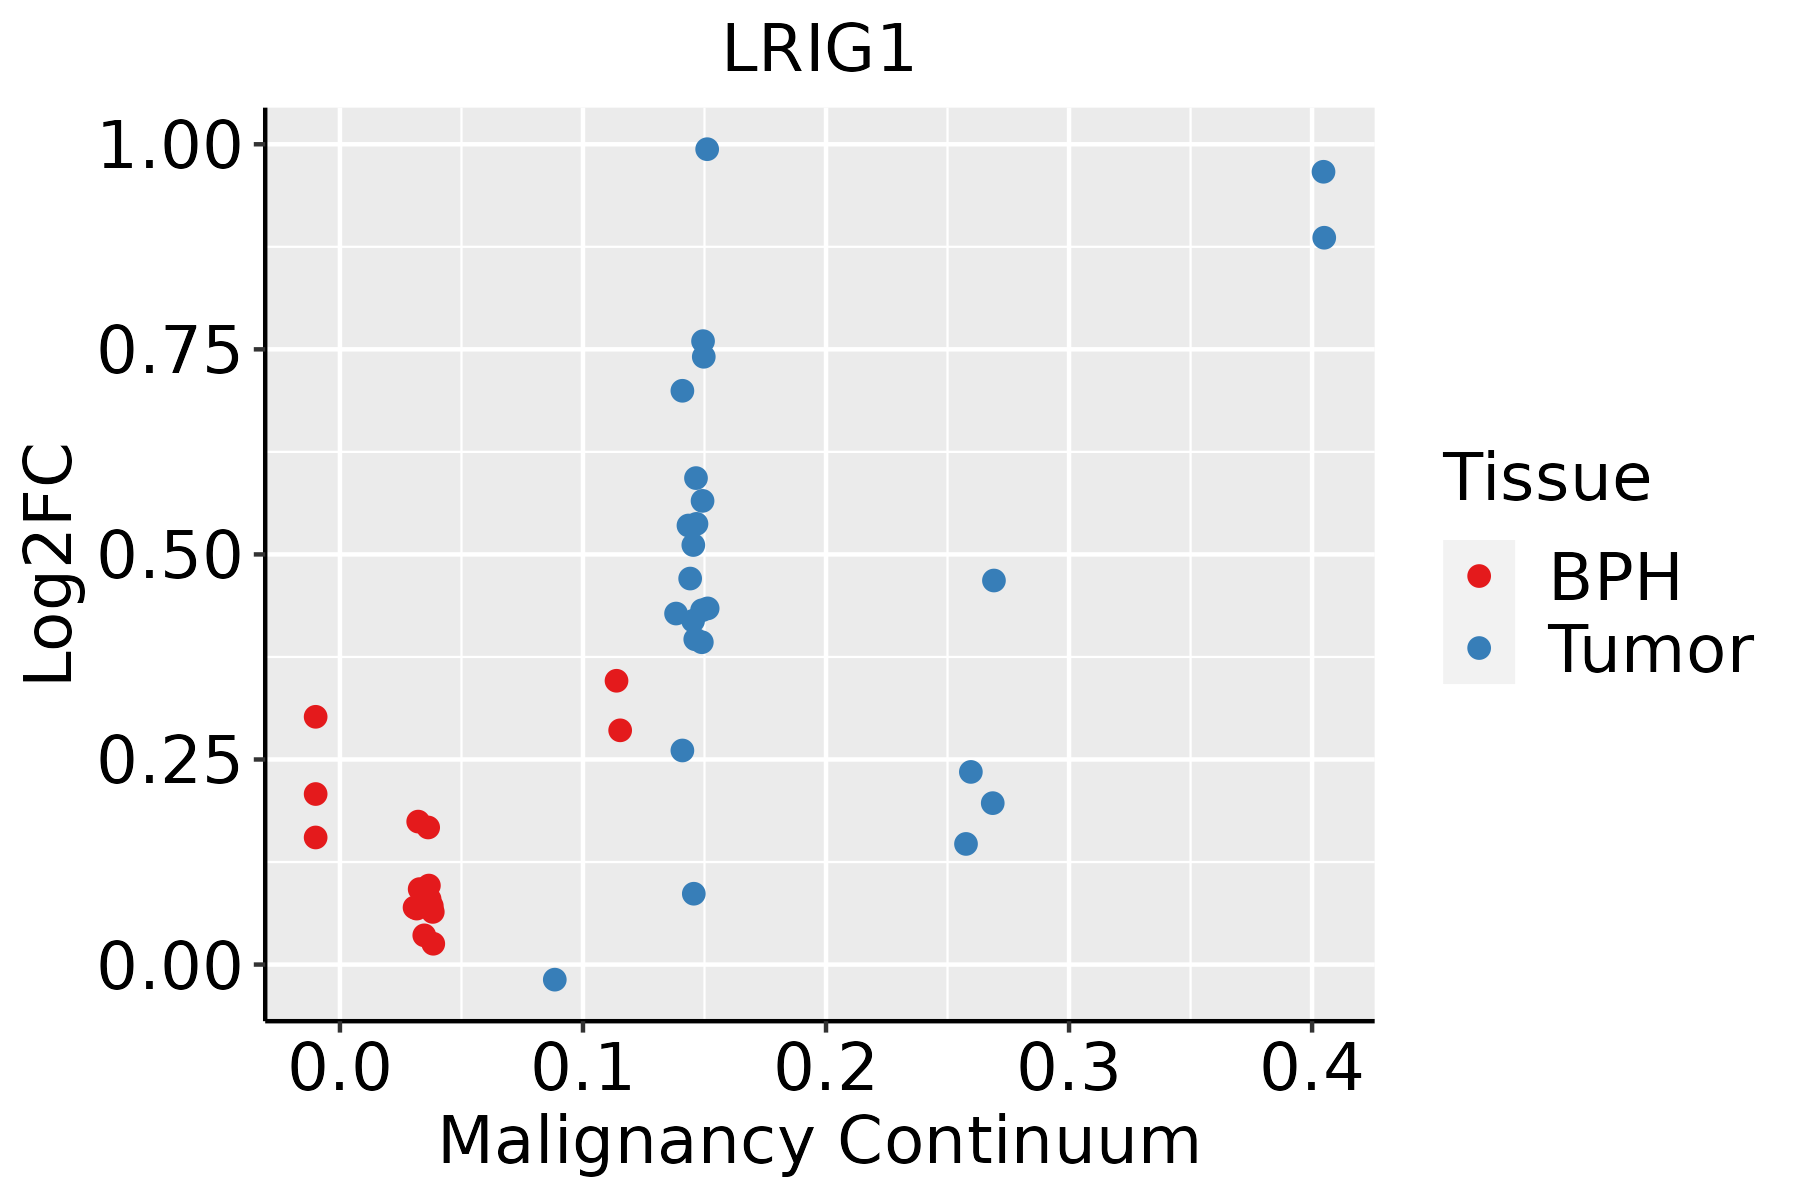 | BPH: Benign Prostatic Hyperplasia |
| Thyroid | 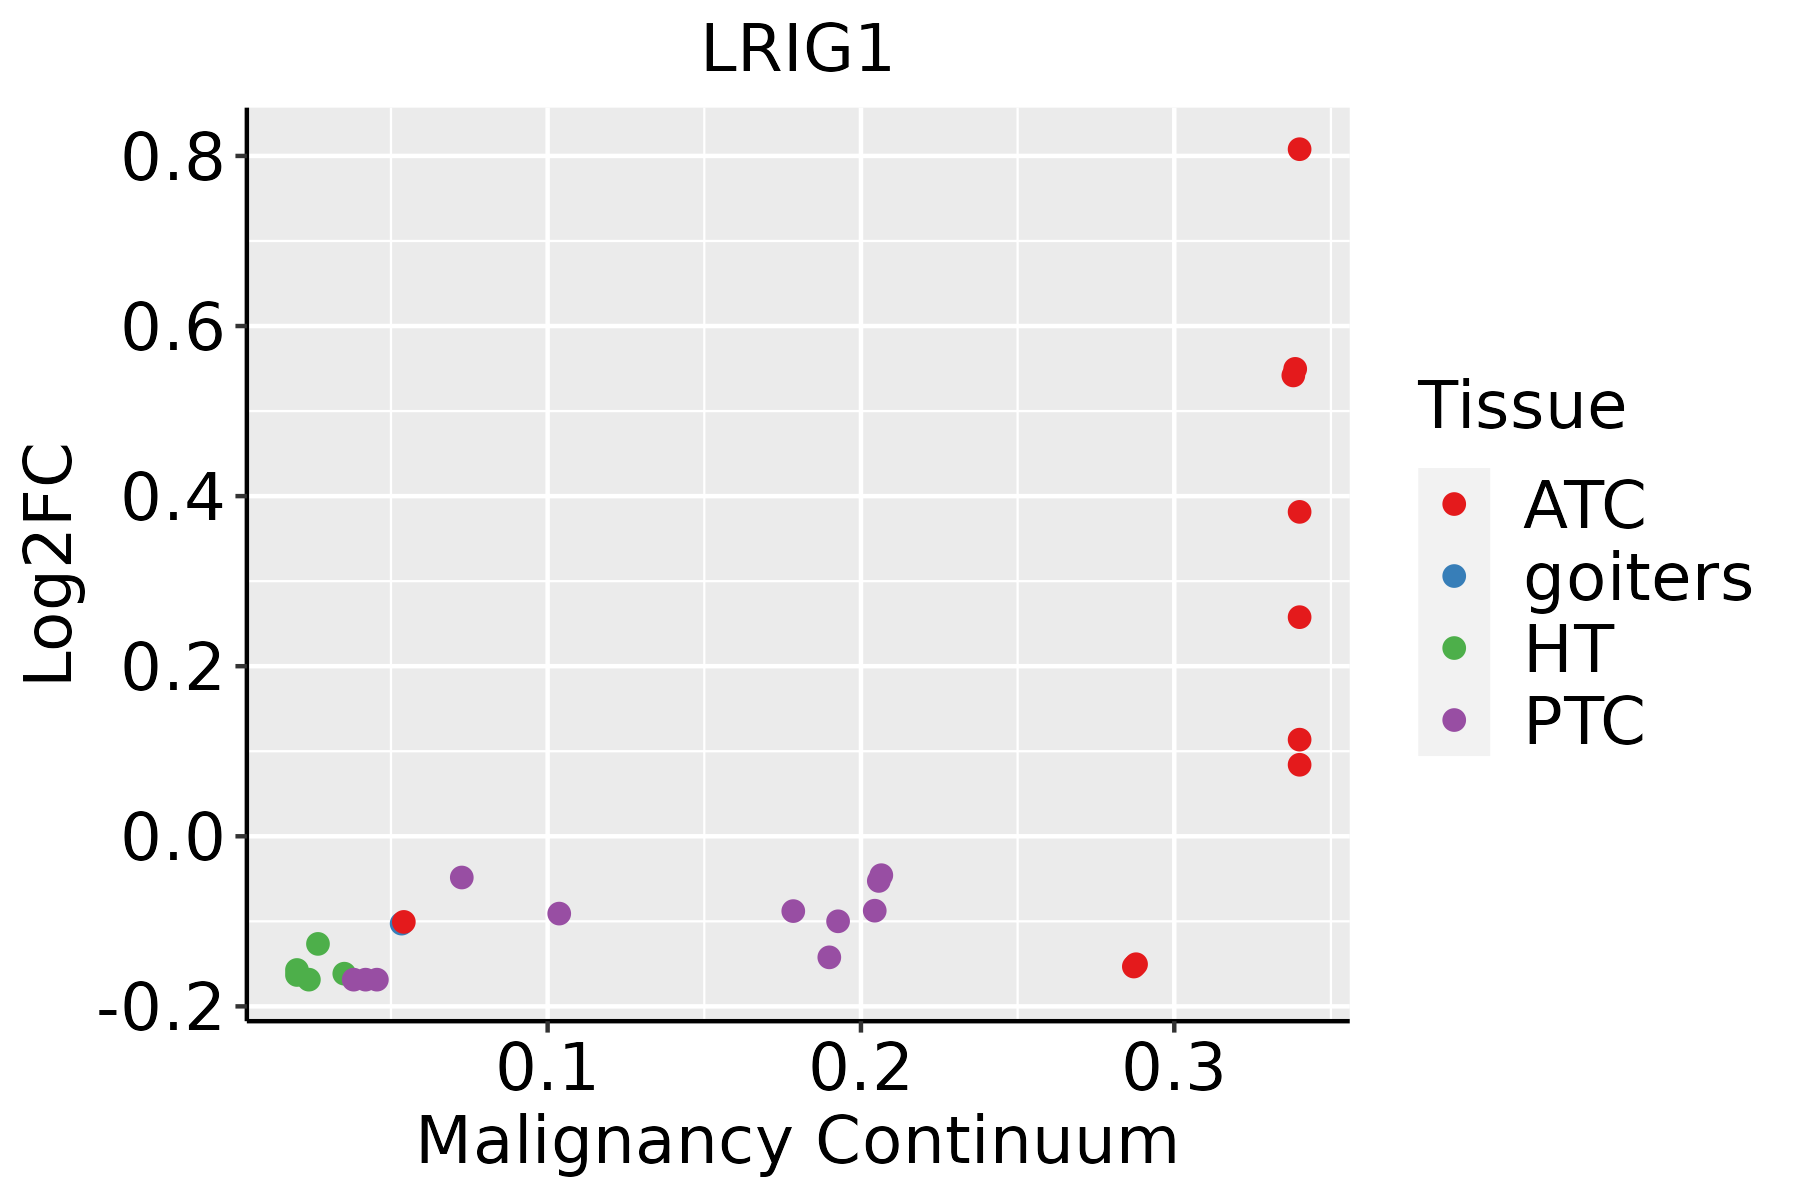 | ATC: Anaplastic thyroid cancer |
| HT: Hashimoto's thyroiditis | ||
| PTC: Papillary thyroid cancer |
| ∗log2FC in expression of this searched gene in stem-like cells from each diseased tissue sample relative to stem-like cells in normal samples in each tissue plotted against the malignancy continuum. Samples are colored based on if they are from different disease stage. |
Top |
Malignant transformation related pathway analysis |
| Find out the enriched GO biological processes and KEGG pathways involved in transition from healthy to precancer to cancer |
| Tissue | Disease Stage | Enriched GO biological Processes |
| Colorectum | AD |  |
| Colorectum | SER |  |
| Colorectum | MSS |  |
| Colorectum | MSI-H |  |
| Colorectum | FAP |  |
| ∗Top 15 enriched GO BP terms are showed in the bar plot of each disease state in each tissue. Each row represents a significant GO biological process which is colored according to the -log10(p.adjust). |
| Page: 1 2 3 4 5 6 7 8 9 |
| GO ID | Tissue | Disease Stage | Description | Gene Ratio | Bg Ratio | pvalue | p.adjust | Count |
| GO:0048568 | Colorectum | AD | embryonic organ development | 112/3918 | 427/18723 | 4.60e-03 | 3.14e-02 | 112 |
| GO:00485681 | Colorectum | MSS | embryonic organ development | 100/3467 | 427/18723 | 6.00e-03 | 4.03e-02 | 100 |
| GO:0022404 | Colorectum | FAP | molting cycle process | 21/2622 | 84/18723 | 5.10e-03 | 3.37e-02 | 21 |
| GO:0022405 | Colorectum | FAP | hair cycle process | 21/2622 | 84/18723 | 5.10e-03 | 3.37e-02 | 21 |
| GO:00485682 | Colorectum | FAP | embryonic organ development | 79/2622 | 427/18723 | 5.32e-03 | 3.49e-02 | 79 |
| GO:00224041 | Colorectum | CRC | molting cycle process | 18/2078 | 84/18723 | 4.43e-03 | 3.47e-02 | 18 |
| GO:00224051 | Colorectum | CRC | hair cycle process | 18/2078 | 84/18723 | 4.43e-03 | 3.47e-02 | 18 |
| GO:00485683 | Colorectum | CRC | embryonic organ development | 65/2078 | 427/18723 | 5.15e-03 | 3.94e-02 | 65 |
| GO:0090596 | Colorectum | CRC | sensory organ morphogenesis | 42/2078 | 256/18723 | 6.22e-03 | 4.54e-02 | 42 |
| GO:0042303 | Colorectum | CRC | molting cycle | 21/2078 | 107/18723 | 6.56e-03 | 4.70e-02 | 21 |
| GO:0042633 | Colorectum | CRC | hair cycle | 21/2078 | 107/18723 | 6.56e-03 | 4.70e-02 | 21 |
| GO:00485687 | Esophagus | ESCC | embryonic organ development | 228/8552 | 427/18723 | 7.28e-04 | 3.79e-03 | 228 |
| GO:00224043 | Esophagus | ESCC | molting cycle process | 53/8552 | 84/18723 | 9.62e-04 | 4.88e-03 | 53 |
| GO:00224053 | Esophagus | ESCC | hair cycle process | 53/8552 | 84/18723 | 9.62e-04 | 4.88e-03 | 53 |
| GO:00423033 | Esophagus | ESCC | molting cycle | 64/8552 | 107/18723 | 2.24e-03 | 9.85e-03 | 64 |
| GO:00426333 | Esophagus | ESCC | hair cycle | 64/8552 | 107/18723 | 2.24e-03 | 9.85e-03 | 64 |
| GO:00485684 | Lung | IAC | embryonic organ development | 64/2061 | 427/18723 | 6.46e-03 | 4.59e-02 | 64 |
| GO:00423032 | Prostate | BPH | molting cycle | 28/3107 | 107/18723 | 7.85e-03 | 3.43e-02 | 28 |
| GO:00426332 | Prostate | BPH | hair cycle | 28/3107 | 107/18723 | 7.85e-03 | 3.43e-02 | 28 |
| GO:00423031 | Prostate | Tumor | molting cycle | 31/3246 | 107/18723 | 1.97e-03 | 1.14e-02 | 31 |
| Page: 1 2 |
| Pathway ID | Tissue | Disease Stage | Description | Gene Ratio | Bg Ratio | pvalue | p.adjust | qvalue | Count |
| Page: 1 |
Top |
Cell-cell communication analysis |
| Identification of potential cell-cell interactions between two cell types and their ligand-receptor pairs for different disease states |
| Ligand | Receptor | LRpair | Pathway | Tissue | Disease Stage |
| Page: 1 |
Top |
Single-cell gene regulatory network inference analysis |
| Find out the significant the regulons (TFs) and the target genes of each regulon across cell types for different disease states |
| TF | Cell Type | Tissue | Disease Stage | Target Gene | RSS | Regulon Activity |
| ∗The dot plots of a searched regulon are shown for all cell subpopulations in each disease state of each tissue based on the regulon specific score inferred using pySCENIC and by calculating the average expression. |
| Page: 1 |
Top |
Somatic mutation of malignant transformation related genes |
| Annotation of somatic variants for genes involved in malignant transformation |
| Hugo Symbol | Variant Class | Variant Classification | dbSNP RS | HGVSc | HGVSp | HGVSp Short | SWISSPROT | BIOTYPE | SIFT | PolyPhen | Tumor Sample Barcode | Tissue | Histology | Sex | Age | Stage | Therapy Types | Drugs | Outcome |
| LRIG1 | SNV | Missense_Mutation | novel | c.428T>G | p.Val143Gly | p.V143G | Q96JA1 | protein_coding | deleterious(0.02) | benign(0.21) | TCGA-AN-A0FT-01 | Breast | breast invasive carcinoma | Female | <65 | I/II | Unknown | Unknown | SD |
| LRIG1 | SNV | Missense_Mutation | c.444G>C | p.Leu148Phe | p.L148F | Q96JA1 | protein_coding | tolerated(0.58) | benign(0) | TCGA-C8-A1HM-01 | Breast | breast invasive carcinoma | Female | >=65 | I/II | Chemotherapy | doxorubicin | CR | |
| LRIG1 | SNV | Missense_Mutation | rs757878940 | c.2150N>T | p.Thr717Met | p.T717M | Q96JA1 | protein_coding | deleterious(0.03) | benign(0.105) | TCGA-D8-A1XJ-01 | Breast | breast invasive carcinoma | Female | >=65 | III/IV | Hormone Therapy | tamoxiphen | SD |
| LRIG1 | SNV | Missense_Mutation | rs766168660 | c.752N>G | p.Thr251Arg | p.T251R | Q96JA1 | protein_coding | tolerated(0.1) | benign(0.258) | TCGA-E2-A1B6-01 | Breast | breast invasive carcinoma | Female | <65 | I/II | Unspecific | Adriamycin | SD |
| LRIG1 | insertion | In_Frame_Ins | novel | c.2523_2524insCTTTCCTCCTCCTCTTATTTTATC | p.Ser841_Tyr842insLeuSerSerSerSerTyrPheIle | p.S841_Y842insLSSSSYFI | Q96JA1 | protein_coding | TCGA-A2-A0EM-01 | Breast | breast invasive carcinoma | Female | >=65 | I/II | Hormone Therapy | tamoxiphen | SD | ||
| LRIG1 | insertion | Nonsense_Mutation | novel | c.2521_2522insAAGGTCAGAACAGTTAAACACT | p.Ser841LysfsTer6 | p.S841Kfs*6 | Q96JA1 | protein_coding | TCGA-A2-A0EM-01 | Breast | breast invasive carcinoma | Female | >=65 | I/II | Hormone Therapy | tamoxiphen | SD | ||
| LRIG1 | insertion | In_Frame_Ins | novel | c.828_829insAAGAGTTGGGTG | p.Ser276_Gly277insLysSerTrpVal | p.S276_G277insKSWV | Q96JA1 | protein_coding | TCGA-A8-A08H-01 | Breast | breast invasive carcinoma | Female | >=65 | I/II | Unknown | Unknown | SD | ||
| LRIG1 | insertion | Frame_Shift_Ins | novel | c.827_828insTTTAGTCTACTGTGTTTCTTTATTTTTCA | p.Gly277LeufsTer53 | p.G277Lfs*53 | Q96JA1 | protein_coding | TCGA-A8-A08H-01 | Breast | breast invasive carcinoma | Female | >=65 | I/II | Unknown | Unknown | SD | ||
| LRIG1 | insertion | In_Frame_Ins | novel | c.425_426insCAAGGGACAGAGGCAGGA | p.Leu141_Glu142insAspLysGlyGlnArgGln | p.L141_E142insDKGQRQ | Q96JA1 | protein_coding | TCGA-AN-A0FT-01 | Breast | breast invasive carcinoma | Female | <65 | I/II | Unknown | Unknown | SD | ||
| LRIG1 | insertion | In_Frame_Ins | novel | c.734_735insGAGGCAAGCACTTCTAAGCCTTTCTCTTTTTCGTTTTTCTGTTTTTAG | p.Asn245delinsLysArgGlnAlaLeuLeuSerLeuSerLeuPheArgPheSerValPheSer | p.N245delinsKRQALLSLSLFRFSVFS | Q96JA1 | protein_coding | TCGA-B6-A0IC-01 | Breast | breast invasive carcinoma | Female | >=65 | I/II | Unknown | Unknown | SD |
| Page: 1 2 3 4 5 6 7 8 9 10 11 12 |
Top |
Related drugs of malignant transformation related genes |
| Identification of chemicals and drugs interact with genes involved in malignant transfromation |
| (DGIdb 4.0) |
| Entrez ID | Symbol | Category | Interaction Types | Drug Claim Name | Drug Name | PMIDs |
| Page: 1 |

Copyright 2023-Present -The University of Texas Health Science Center at Houston |