
|
|||||
|
 | |
| |
| |
| |
| |
| |
|
Gene: LRG1 |
Gene summary for LRG1 |
| Gene information | Species | Human | Gene symbol | LRG1 | Gene ID | 116844 |
| Gene name | leucine rich alpha-2-glycoprotein 1 | |
| Gene Alias | HMFT1766 | |
| Cytomap | 19p13.3 | |
| Gene Type | protein-coding | GO ID | GO:0001525 | UniProtAcc | P02750 |
Top |
Malignant transformation analysis |
| Identification of the aberrant gene expression in precancerous and cancerous lesions by comparing the gene expression of stem-like cells in diseased tissues with normal stem cells |
| Entrez ID | Symbol | Replicates | Species | Organ | Tissue | Adj P-value | Log2FC | Malignancy |
| 116844 | LRG1 | HTA11_3410_2000001011 | Human | Colorectum | AD | 1.08e-08 | 1.93e-01 | 0.0155 |
| 116844 | LRG1 | HTA11_2487_2000001011 | Human | Colorectum | SER | 7.05e-06 | 1.89e-01 | -0.1808 |
| 116844 | LRG1 | HTA11_1938_2000001011 | Human | Colorectum | AD | 4.00e-12 | 3.61e-01 | -0.0811 |
| 116844 | LRG1 | HTA11_78_2000001011 | Human | Colorectum | AD | 2.42e-13 | 3.59e-01 | -0.1088 |
| 116844 | LRG1 | HTA11_347_2000001011 | Human | Colorectum | AD | 8.16e-19 | 3.64e-01 | -0.1954 |
| 116844 | LRG1 | HTA11_411_2000001011 | Human | Colorectum | SER | 4.01e-04 | 2.94e-01 | -0.2602 |
| 116844 | LRG1 | HTA11_3361_2000001011 | Human | Colorectum | AD | 3.26e-04 | 1.91e-01 | -0.1207 |
| 116844 | LRG1 | HTA11_83_2000001011 | Human | Colorectum | SER | 7.80e-11 | 3.95e-01 | -0.1526 |
| 116844 | LRG1 | HTA11_696_2000001011 | Human | Colorectum | AD | 4.93e-21 | 3.82e-01 | -0.1464 |
| 116844 | LRG1 | HTA11_866_2000001011 | Human | Colorectum | AD | 3.19e-14 | 2.67e-01 | -0.1001 |
| 116844 | LRG1 | HTA11_1391_2000001011 | Human | Colorectum | AD | 2.21e-25 | 5.78e-01 | -0.059 |
| 116844 | LRG1 | HTA11_2992_2000001011 | Human | Colorectum | SER | 1.29e-03 | 2.14e-01 | -0.1706 |
| 116844 | LRG1 | HTA11_5212_2000001011 | Human | Colorectum | AD | 3.97e-04 | 2.37e-01 | -0.2061 |
| 116844 | LRG1 | HTA11_5216_2000001011 | Human | Colorectum | SER | 3.40e-03 | 3.08e-01 | -0.1462 |
| 116844 | LRG1 | HTA11_546_2000001011 | Human | Colorectum | AD | 1.43e-09 | 3.61e-01 | -0.0842 |
| 116844 | LRG1 | HTA11_866_3004761011 | Human | Colorectum | AD | 6.35e-11 | 2.33e-01 | 0.096 |
| 116844 | LRG1 | HTA11_4255_2000001011 | Human | Colorectum | SER | 3.03e-06 | 3.63e-01 | 0.0446 |
| 116844 | LRG1 | HTA11_8622_2000001021 | Human | Colorectum | SER | 1.13e-05 | 2.47e-01 | 0.0528 |
| 116844 | LRG1 | HTA11_7663_2000001011 | Human | Colorectum | SER | 7.26e-05 | 2.84e-01 | 0.0131 |
| 116844 | LRG1 | HTA11_10623_2000001011 | Human | Colorectum | AD | 6.46e-07 | 2.81e-01 | -0.0177 |
| Page: 1 2 3 4 |
| Tissue | Expression Dynamics | Abbreviation |
| Colorectum (GSE201348) |  | FAP: Familial adenomatous polyposis |
| CRC: Colorectal cancer | ||
| Colorectum (HTA11) |  | AD: Adenomas |
| SER: Sessile serrated lesions | ||
| MSI-H: Microsatellite-high colorectal cancer | ||
| MSS: Microsatellite stable colorectal cancer | ||
| Esophagus | 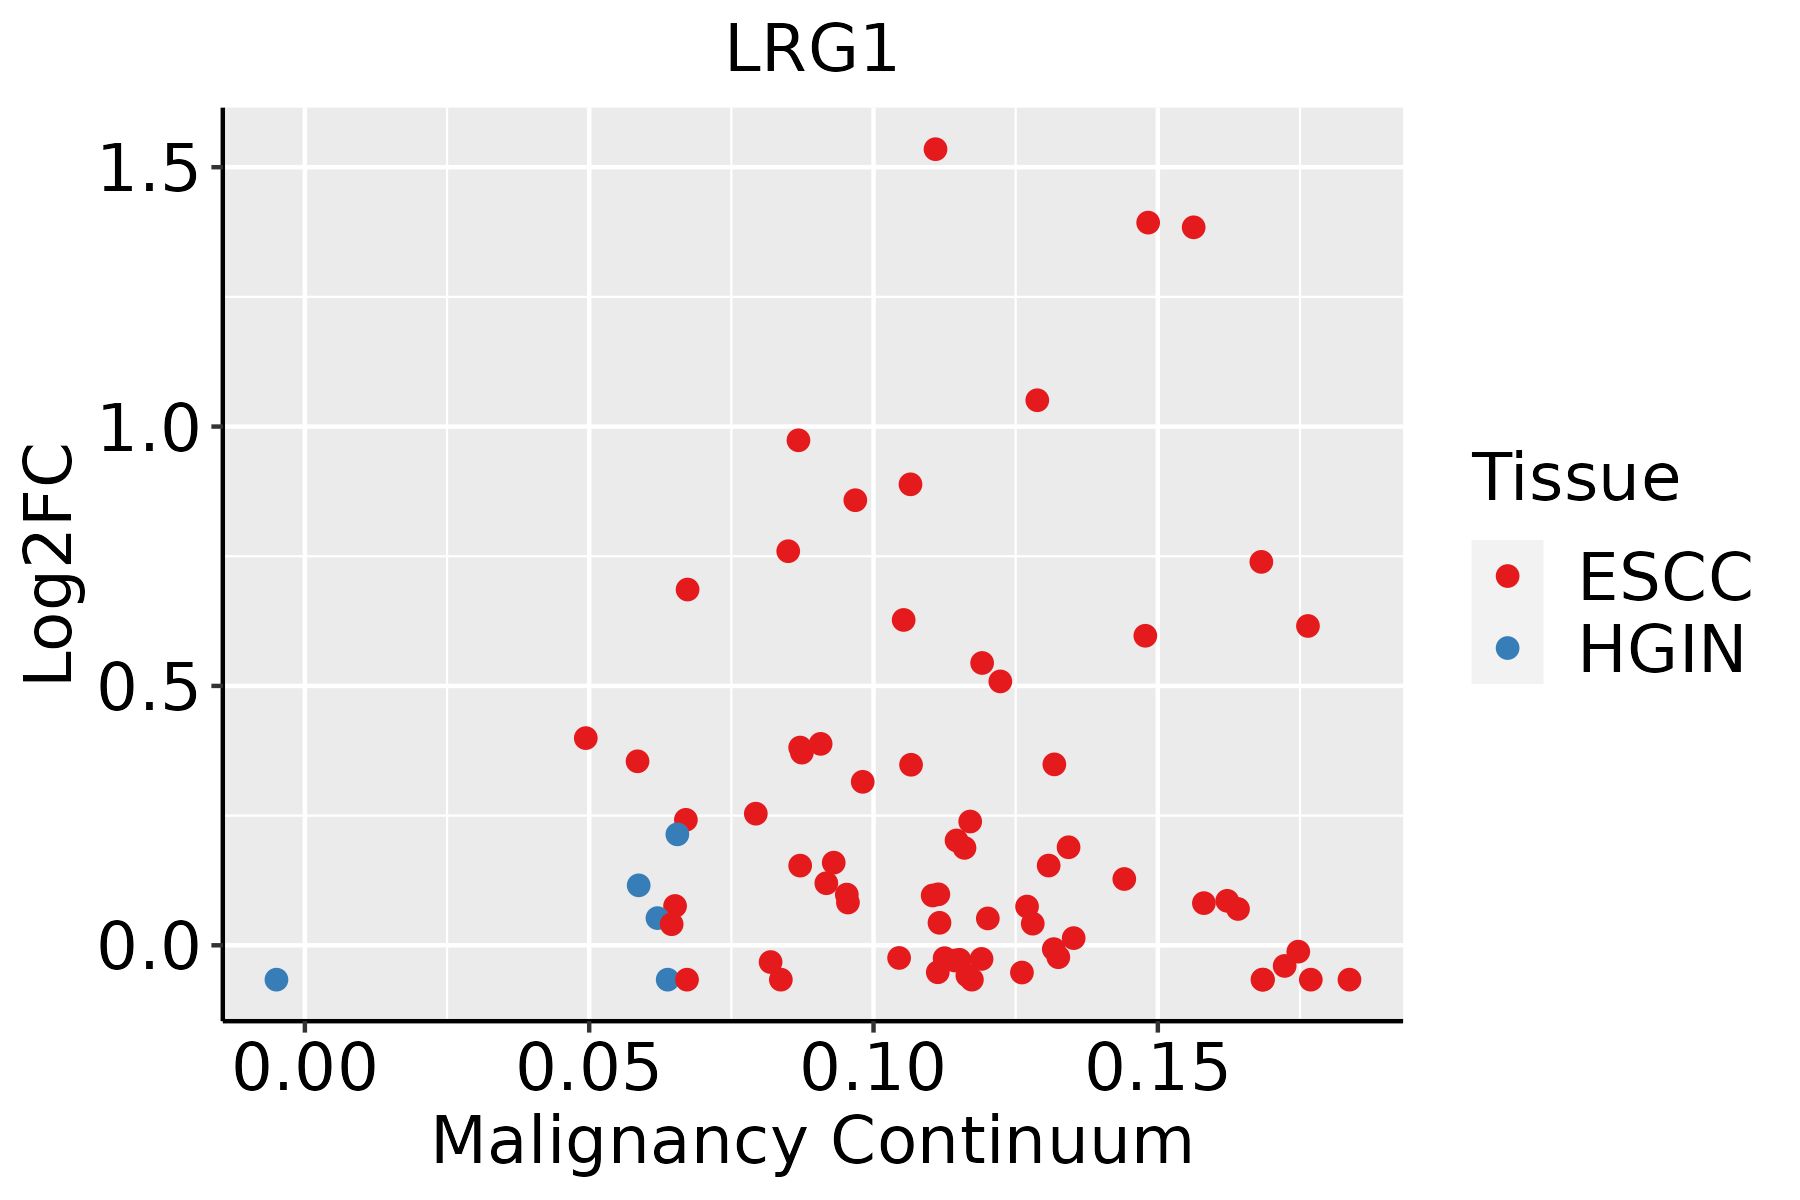 | ESCC: Esophageal squamous cell carcinoma |
| HGIN: High-grade intraepithelial neoplasias | ||
| LGIN: Low-grade intraepithelial neoplasias | ||
| Liver |  | HCC: Hepatocellular carcinoma |
| NAFLD: Non-alcoholic fatty liver disease | ||
| Oral Cavity | 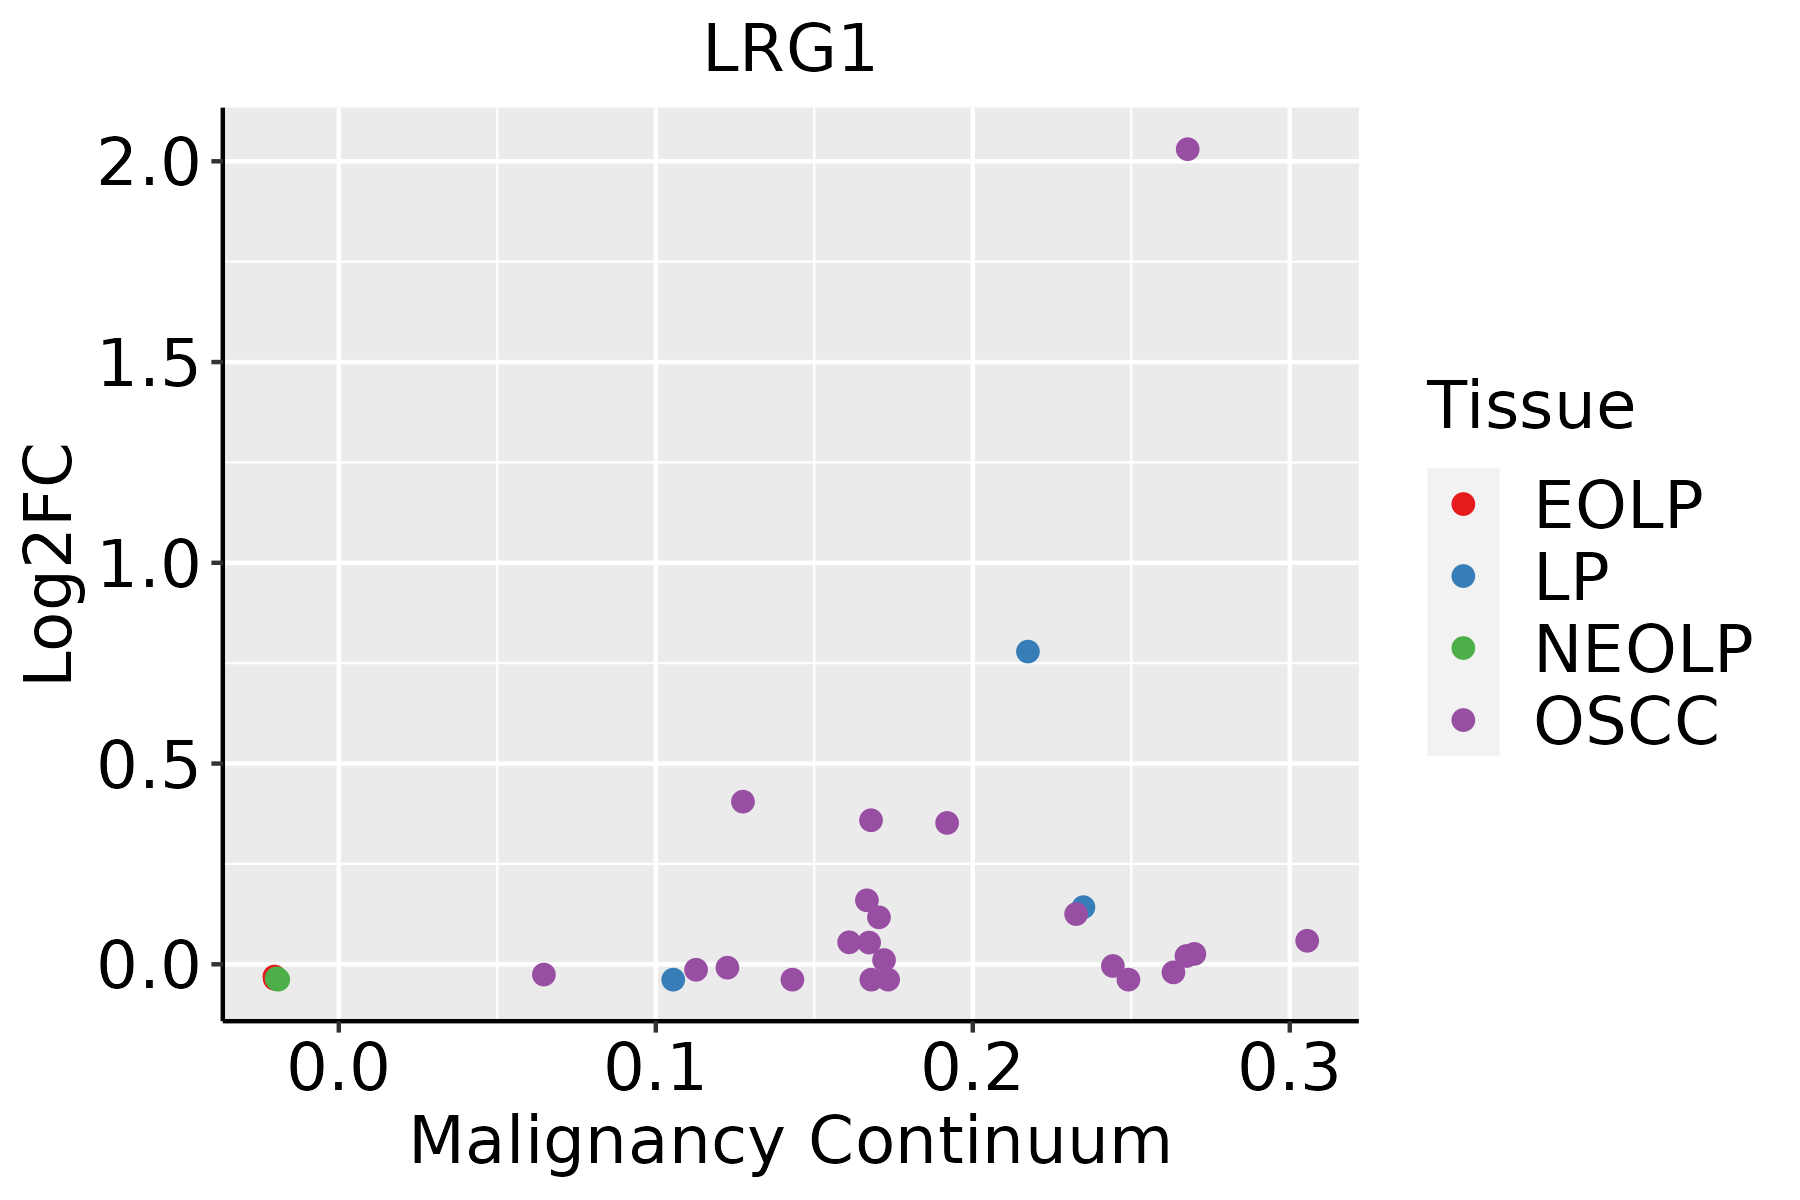 | EOLP: Erosive Oral lichen planus |
| LP: leukoplakia | ||
| NEOLP: Non-erosive oral lichen planus | ||
| OSCC: Oral squamous cell carcinoma |
| ∗log2FC in expression of this searched gene in stem-like cells from each diseased tissue sample relative to stem-like cells in normal samples in each tissue plotted against the malignancy continuum. Samples are colored based on if they are from different disease stage. |
Top |
Malignant transformation related pathway analysis |
| Find out the enriched GO biological processes and KEGG pathways involved in transition from healthy to precancer to cancer |
| Tissue | Disease Stage | Enriched GO biological Processes |
| Colorectum | AD |  |
| Colorectum | SER |  |
| Colorectum | MSS |  |
| Colorectum | MSI-H |  |
| Colorectum | FAP |  |
| ∗Top 15 enriched GO BP terms are showed in the bar plot of each disease state in each tissue. Each row represents a significant GO biological process which is colored according to the -log10(p.adjust). |
| Page: 1 2 3 4 5 6 7 8 9 |
| GO ID | Tissue | Disease Stage | Description | Gene Ratio | Bg Ratio | pvalue | p.adjust | Count |
| GO:0050673 | Colorectum | AD | epithelial cell proliferation | 119/3918 | 437/18723 | 8.75e-04 | 8.51e-03 | 119 |
| GO:0007178 | Colorectum | AD | transmembrane receptor protein serine/threonine kinase signaling pathway | 99/3918 | 355/18723 | 9.92e-04 | 9.28e-03 | 99 |
| GO:0071559 | Colorectum | AD | response to transforming growth factor beta | 74/3918 | 256/18723 | 1.45e-03 | 1.23e-02 | 74 |
| GO:0071560 | Colorectum | AD | cellular response to transforming growth factor beta stimulus | 72/3918 | 250/18723 | 1.85e-03 | 1.52e-02 | 72 |
| GO:0007179 | Colorectum | AD | transforming growth factor beta receptor signaling pathway | 59/3918 | 198/18723 | 1.94e-03 | 1.58e-02 | 59 |
| GO:0045444 | Colorectum | SER | fat cell differentiation | 51/2897 | 229/18723 | 3.96e-03 | 3.26e-02 | 51 |
| GO:00506731 | Colorectum | MSS | epithelial cell proliferation | 108/3467 | 437/18723 | 6.76e-04 | 7.30e-03 | 108 |
| GO:00071781 | Colorectum | MSS | transmembrane receptor protein serine/threonine kinase signaling pathway | 86/3467 | 355/18723 | 4.04e-03 | 2.95e-02 | 86 |
| GO:0050678 | Colorectum | MSS | regulation of epithelial cell proliferation | 90/3467 | 381/18723 | 6.92e-03 | 4.45e-02 | 90 |
| GO:000838026 | Esophagus | HGIN | RNA splicing | 160/2587 | 434/18723 | 3.74e-34 | 1.12e-30 | 160 |
| GO:000037520 | Esophagus | HGIN | RNA splicing, via transesterification reactions | 115/2587 | 324/18723 | 3.16e-23 | 3.80e-20 | 115 |
| GO:000037720 | Esophagus | HGIN | RNA splicing, via transesterification reactions with bulged adenosine as nucleophile | 113/2587 | 320/18723 | 1.24e-22 | 9.26e-20 | 113 |
| GO:000039820 | Esophagus | HGIN | mRNA splicing, via spliceosome | 113/2587 | 320/18723 | 1.24e-22 | 9.26e-20 | 113 |
| GO:003450417 | Esophagus | HGIN | protein localization to nucleus | 84/2587 | 290/18723 | 1.06e-11 | 1.24e-09 | 84 |
| GO:000734610 | Esophagus | HGIN | regulation of mitotic cell cycle | 98/2587 | 457/18723 | 4.39e-06 | 1.42e-04 | 98 |
| GO:00447729 | Esophagus | HGIN | mitotic cell cycle phase transition | 89/2587 | 424/18723 | 2.80e-05 | 7.21e-04 | 89 |
| GO:19019906 | Esophagus | HGIN | regulation of mitotic cell cycle phase transition | 65/2587 | 299/18723 | 1.12e-04 | 2.36e-03 | 65 |
| GO:20000456 | Esophagus | HGIN | regulation of G1/S transition of mitotic cell cycle | 36/2587 | 142/18723 | 1.74e-04 | 3.35e-03 | 36 |
| GO:00000827 | Esophagus | HGIN | G1/S transition of mitotic cell cycle | 48/2587 | 214/18723 | 3.97e-04 | 6.07e-03 | 48 |
| GO:00448437 | Esophagus | HGIN | cell cycle G1/S phase transition | 52/2587 | 241/18723 | 6.19e-04 | 8.58e-03 | 52 |
| Page: 1 2 3 4 5 6 7 8 9 10 11 |
| Pathway ID | Tissue | Disease Stage | Description | Gene Ratio | Bg Ratio | pvalue | p.adjust | qvalue | Count |
| Page: 1 |
Top |
Cell-cell communication analysis |
| Identification of potential cell-cell interactions between two cell types and their ligand-receptor pairs for different disease states |
| Ligand | Receptor | LRpair | Pathway | Tissue | Disease Stage |
| CDH1 | KLRG1 | CDH1_KLRG1 | CDH1 | Breast | DCIS |
| CDH1 | KLRG1 | CDH1_KLRG1 | CDH1 | Breast | Healthy |
| CDH1 | KLRG1 | CDH1_KLRG1 | CDH1 | Cervix | CC |
| CDH1 | KLRG1 | CDH1_KLRG1 | CDH1 | Cervix | Precancer |
| CDH1 | KLRG1 | CDH1_KLRG1 | CDH1 | Endometrium | ADJ |
| CDH1 | KLRG1 | CDH1_KLRG1 | CDH1 | Endometrium | AEH |
| CDH1 | KLRG1 | CDH1_KLRG1 | CDH1 | Endometrium | Healthy |
| CDH1 | KLRG1 | CDH1_KLRG1 | CDH1 | Esophagus | ESCC |
| CDH1 | KLRG1 | CDH1_KLRG1 | CDH1 | GC | ADJ |
| CDH1 | KLRG1 | CDH1_KLRG1 | CDH1 | HNSCC | OSCC |
| CDH1 | KLRG1 | CDH1_KLRG1 | CDH1 | HNSCC | Precancer |
| CDH1 | KLRG1 | CDH1_KLRG1 | CDH1 | Liver | HCC |
| CDH1 | KLRG1 | CDH1_KLRG1 | CDH1 | Liver | Healthy |
| CDH1 | KLRG1 | CDH1_KLRG1 | CDH1 | Liver | Precancer |
| CDH1 | KLRG1 | CDH1_KLRG1 | CDH1 | Lung | AAH |
| CDH1 | KLRG1 | CDH1_KLRG1 | CDH1 | Lung | ADJ |
| CDH1 | KLRG1 | CDH1_KLRG1 | CDH1 | Lung | AIS |
| CDH1 | KLRG1 | CDH1_KLRG1 | CDH1 | Lung | IAC |
| CDH1 | KLRG1 | CDH1_KLRG1 | CDH1 | Lung | MIAC |
| CDH1 | KLRG1 | CDH1_KLRG1 | CDH1 | Lung | Precancer |
| Page: 1 |
Top |
Single-cell gene regulatory network inference analysis |
| Find out the significant the regulons (TFs) and the target genes of each regulon across cell types for different disease states |
| TF | Cell Type | Tissue | Disease Stage | Target Gene | RSS | Regulon Activity |
| ∗The dot plots of a searched regulon are shown for all cell subpopulations in each disease state of each tissue based on the regulon specific score inferred using pySCENIC and by calculating the average expression. |
| Page: 1 |
Top |
Somatic mutation of malignant transformation related genes |
| Annotation of somatic variants for genes involved in malignant transformation |
| Hugo Symbol | Variant Class | Variant Classification | dbSNP RS | HGVSc | HGVSp | HGVSp Short | SWISSPROT | BIOTYPE | SIFT | PolyPhen | Tumor Sample Barcode | Tissue | Histology | Sex | Age | Stage | Therapy Types | Drugs | Outcome |
| LRG1 | SNV | Missense_Mutation | c.286N>A | p.Glu96Lys | p.E96K | P02750 | protein_coding | deleterious(0) | possibly_damaging(0.567) | TCGA-AC-A23H-01 | Breast | breast invasive carcinoma | Female | >=65 | I/II | Unknown | Unknown | PD | |
| LRG1 | SNV | Missense_Mutation | rs200386362 | c.338N>A | p.Arg113Gln | p.R113Q | P02750 | protein_coding | tolerated(0.52) | benign(0) | TCGA-BH-A0DZ-01 | Breast | breast invasive carcinoma | Female | <65 | I/II | Chemotherapy | docetaxel | SD |
| LRG1 | SNV | Missense_Mutation | c.317N>C | p.Ser106Thr | p.S106T | P02750 | protein_coding | tolerated(0.45) | benign(0.003) | TCGA-EW-A1PA-01 | Breast | breast invasive carcinoma | Female | <65 | I/II | Chemotherapy | cyclophosphamide | SD | |
| LRG1 | SNV | Missense_Mutation | novel | c.529N>T | p.Arg177Trp | p.R177W | P02750 | protein_coding | tolerated(0.09) | benign(0.03) | TCGA-LD-A7W5-01 | Breast | breast invasive carcinoma | Female | <65 | III/IV | Chemotherapy | taxotere | SD |
| LRG1 | insertion | In_Frame_Ins | novel | c.563_564insAAATGAGAAAGAAGT | p.Thr188_Leu189insAsnGluLysGluVal | p.T188_L189insNEKEV | P02750 | protein_coding | TCGA-AN-A0FX-01 | Breast | breast invasive carcinoma | Female | <65 | I/II | Unknown | Unknown | SD | ||
| LRG1 | SNV | Missense_Mutation | c.943C>G | p.Gln315Glu | p.Q315E | P02750 | protein_coding | tolerated(0.96) | benign(0.01) | TCGA-EK-A3GK-01 | Cervix | cervical & endocervical cancer | Female | <65 | I/II | Unknown | Unknown | SD | |
| LRG1 | SNV | Missense_Mutation | rs138157436 | c.524G>A | p.Arg175His | p.R175H | P02750 | protein_coding | tolerated(0.2) | benign(0.007) | TCGA-AA-A010-01 | Colorectum | colon adenocarcinoma | Female | <65 | I/II | Chemotherapy | folinic | CR |
| LRG1 | SNV | Missense_Mutation | c.740N>G | p.Lys247Arg | p.K247R | P02750 | protein_coding | tolerated(0.79) | benign(0.003) | TCGA-AZ-4308-01 | Colorectum | colon adenocarcinoma | Female | <65 | III/IV | Targeted Molecular therapy | avastin | CR | |
| LRG1 | SNV | Missense_Mutation | novel | c.449N>G | p.Asn150Ser | p.N150S | P02750 | protein_coding | deleterious(0) | possibly_damaging(0.876) | TCGA-CM-5349-01 | Colorectum | colon adenocarcinoma | Female | >=65 | I/II | Unknown | Unknown | SD |
| LRG1 | SNV | Missense_Mutation | rs750105391 | c.271N>A | p.Ala91Thr | p.A91T | P02750 | protein_coding | tolerated(0.3) | benign(0.053) | TCGA-CM-6162-01 | Colorectum | colon adenocarcinoma | Female | <65 | III/IV | Chemotherapy | oxaliplatin | SD |
| Page: 1 2 3 4 5 |
Top |
Related drugs of malignant transformation related genes |
| Identification of chemicals and drugs interact with genes involved in malignant transfromation |
| (DGIdb 4.0) |
| Entrez ID | Symbol | Category | Interaction Types | Drug Claim Name | Drug Name | PMIDs |
| Page: 1 |

Copyright 2023-Present -The University of Texas Health Science Center at Houston |