
|
|||||
|
 | |
| |
| |
| |
| |
| |
|
Gene: LRFN4 |
Gene summary for LRFN4 |
| Gene information | Species | Human | Gene symbol | LRFN4 | Gene ID | 78999 |
| Gene name | leucine rich repeat and fibronectin type III domain containing 4 | |
| Gene Alias | FIGLER6 | |
| Cytomap | 11q13.2 | |
| Gene Type | protein-coding | GO ID | GO:0006996 | UniProtAcc | A0A024R5I6 |
Top |
Malignant transformation analysis |
| Identification of the aberrant gene expression in precancerous and cancerous lesions by comparing the gene expression of stem-like cells in diseased tissues with normal stem cells |
| Entrez ID | Symbol | Replicates | Species | Organ | Tissue | Adj P-value | Log2FC | Malignancy |
| 78999 | LRFN4 | C04 | Human | Oral cavity | OSCC | 1.48e-14 | 5.86e-01 | 0.2633 |
| 78999 | LRFN4 | C21 | Human | Oral cavity | OSCC | 9.08e-20 | 6.66e-01 | 0.2678 |
| 78999 | LRFN4 | C30 | Human | Oral cavity | OSCC | 3.05e-30 | 1.07e+00 | 0.3055 |
| 78999 | LRFN4 | C38 | Human | Oral cavity | OSCC | 4.68e-03 | 3.23e-01 | 0.172 |
| 78999 | LRFN4 | C43 | Human | Oral cavity | OSCC | 3.34e-03 | 7.98e-02 | 0.1704 |
| 78999 | LRFN4 | C51 | Human | Oral cavity | OSCC | 3.51e-27 | 1.07e+00 | 0.2674 |
| 78999 | LRFN4 | C08 | Human | Oral cavity | OSCC | 1.94e-13 | 3.24e-01 | 0.1919 |
| 78999 | LRFN4 | SYSMH1 | Human | Oral cavity | OSCC | 2.37e-14 | 2.71e-01 | 0.1127 |
| 78999 | LRFN4 | SYSMH2 | Human | Oral cavity | OSCC | 4.12e-20 | 5.70e-01 | 0.2326 |
| 78999 | LRFN4 | SYSMH3 | Human | Oral cavity | OSCC | 2.04e-19 | 4.36e-01 | 0.2442 |
| 78999 | LRFN4 | SYSMH5 | Human | Oral cavity | OSCC | 1.84e-02 | 1.28e-01 | 0.0647 |
| Page: 1 |
| Tissue | Expression Dynamics | Abbreviation |
| Oral Cavity | 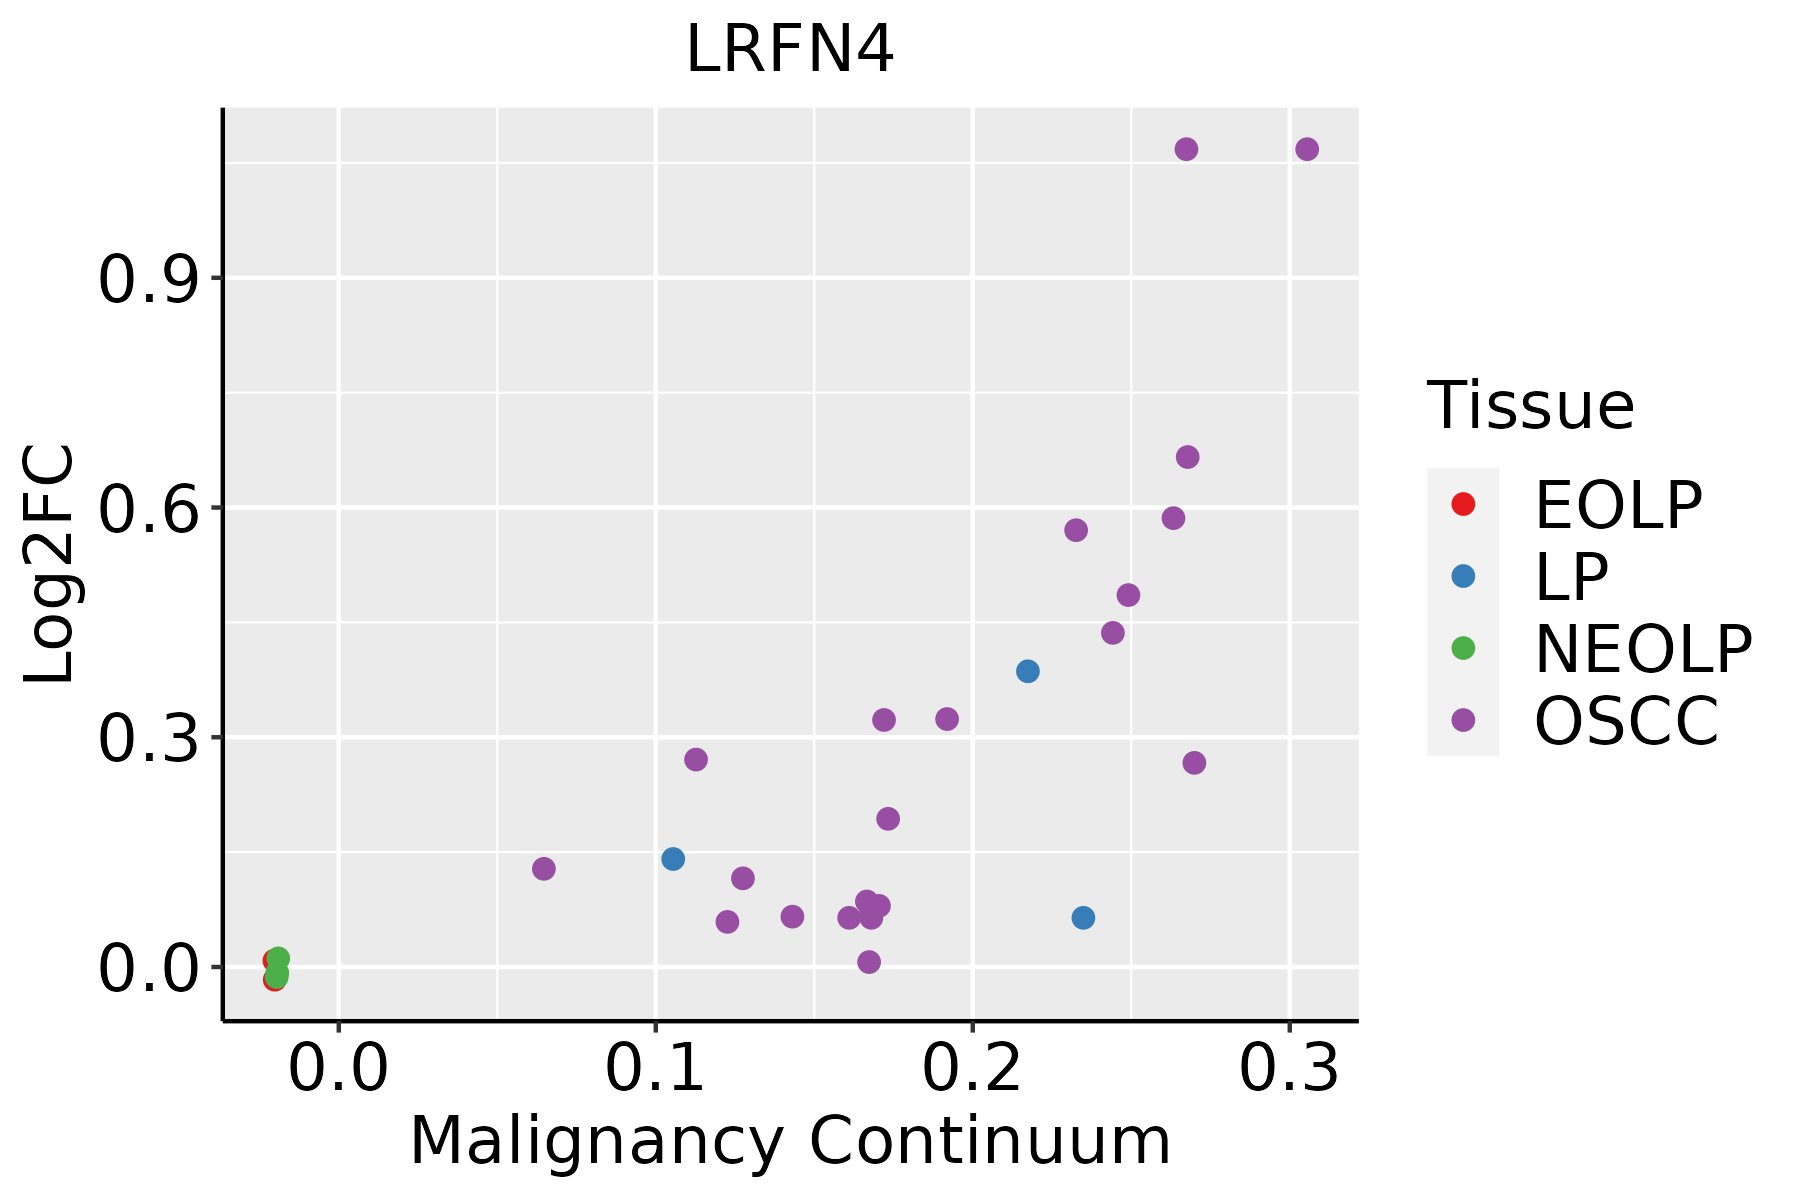 | EOLP: Erosive Oral lichen planus |
| LP: leukoplakia | ||
| NEOLP: Non-erosive oral lichen planus | ||
| OSCC: Oral squamous cell carcinoma |
| ∗log2FC in expression of this searched gene in stem-like cells from each diseased tissue sample relative to stem-like cells in normal samples in each tissue plotted against the malignancy continuum. Samples are colored based on if they are from different disease stage. |
Top |
Malignant transformation related pathway analysis |
| Find out the enriched GO biological processes and KEGG pathways involved in transition from healthy to precancer to cancer |
| Tissue | Disease Stage | Enriched GO biological Processes |
| Colorectum | AD |  |
| Colorectum | SER |  |
| Colorectum | MSS |  |
| Colorectum | MSI-H |  |
| Colorectum | FAP |  |
| ∗Top 15 enriched GO BP terms are showed in the bar plot of each disease state in each tissue. Each row represents a significant GO biological process which is colored according to the -log10(p.adjust). |
| Page: 1 2 3 4 5 6 7 8 9 |
| GO ID | Tissue | Disease Stage | Description | Gene Ratio | Bg Ratio | pvalue | p.adjust | Count |
| GO:19021155 | Oral cavity | OSCC | regulation of organelle assembly | 109/7305 | 186/18723 | 4.54e-08 | 8.45e-07 | 109 |
| GO:003432916 | Oral cavity | OSCC | cell junction assembly | 190/7305 | 420/18723 | 4.99e-03 | 1.96e-02 | 190 |
| Page: 1 |
| Pathway ID | Tissue | Disease Stage | Description | Gene Ratio | Bg Ratio | pvalue | p.adjust | qvalue | Count |
| Page: 1 |
Top |
Cell-cell communication analysis |
| Identification of potential cell-cell interactions between two cell types and their ligand-receptor pairs for different disease states |
| Ligand | Receptor | LRpair | Pathway | Tissue | Disease Stage |
| Page: 1 |
Top |
Single-cell gene regulatory network inference analysis |
| Find out the significant the regulons (TFs) and the target genes of each regulon across cell types for different disease states |
| TF | Cell Type | Tissue | Disease Stage | Target Gene | RSS | Regulon Activity |
| ∗The dot plots of a searched regulon are shown for all cell subpopulations in each disease state of each tissue based on the regulon specific score inferred using pySCENIC and by calculating the average expression. |
| Page: 1 |
Top |
Somatic mutation of malignant transformation related genes |
| Annotation of somatic variants for genes involved in malignant transformation |
| Hugo Symbol | Variant Class | Variant Classification | dbSNP RS | HGVSc | HGVSp | HGVSp Short | SWISSPROT | BIOTYPE | SIFT | PolyPhen | Tumor Sample Barcode | Tissue | Histology | Sex | Age | Stage | Therapy Types | Drugs | Outcome |
| LRFN4 | SNV | Missense_Mutation | rs371172656 | c.1508N>T | p.Ser503Leu | p.S503L | Q6PJG9 | protein_coding | tolerated(0.2) | benign(0.001) | TCGA-A2-A0YK-01 | Breast | breast invasive carcinoma | Female | <65 | I/II | Chemotherapy | cytoxan | SD |
| LRFN4 | SNV | Missense_Mutation | novel | c.213G>A | p.Met71Ile | p.M71I | Q6PJG9 | protein_coding | deleterious(0) | probably_damaging(0.999) | TCGA-DS-A1OB-01 | Cervix | cervical & endocervical cancer | Female | <65 | I/II | Chemotherapy | carboplatin | PD |
| LRFN4 | SNV | Missense_Mutation | novel | c.1859G>A | p.Cys620Tyr | p.C620Y | Q6PJG9 | protein_coding | tolerated_low_confidence(0.07) | possibly_damaging(0.447) | TCGA-EA-A3HS-01 | Cervix | cervical & endocervical cancer | Female | <65 | I/II | Unknown | Unknown | SD |
| LRFN4 | SNV | Missense_Mutation | novel | c.358G>T | p.Val120Phe | p.V120F | Q6PJG9 | protein_coding | deleterious(0.05) | possibly_damaging(0.732) | TCGA-VS-A8EB-01 | Cervix | cervical & endocervical cancer | Female | <65 | III/IV | Unknown | Unknown | PD |
| LRFN4 | SNV | Missense_Mutation | c.1735N>T | p.Arg579Trp | p.R579W | Q6PJG9 | protein_coding | deleterious(0.03) | benign(0.428) | TCGA-AA-3492-01 | Colorectum | colon adenocarcinoma | Female | >=65 | I/II | Unknown | Unknown | SD | |
| LRFN4 | SNV | Missense_Mutation | novel | c.646C>T | p.Arg216Cys | p.R216C | Q6PJG9 | protein_coding | deleterious(0) | probably_damaging(0.998) | TCGA-AA-A00N-01 | Colorectum | colon adenocarcinoma | Male | >=65 | I/II | Unknown | Unknown | PD |
| LRFN4 | SNV | Missense_Mutation | c.295N>T | p.Arg99Cys | p.R99C | Q6PJG9 | protein_coding | deleterious(0) | probably_damaging(1) | TCGA-AD-6895-01 | Colorectum | colon adenocarcinoma | Male | >=65 | III/IV | Unknown | Unknown | SD | |
| LRFN4 | SNV | Missense_Mutation | c.1327N>A | p.Glu443Lys | p.E443K | Q6PJG9 | protein_coding | tolerated(0.8) | benign(0.121) | TCGA-AM-5821-01 | Colorectum | colon adenocarcinoma | Female | >=65 | I/II | Unknown | Unknown | SD | |
| LRFN4 | SNV | Missense_Mutation | c.269N>A | p.Arg90His | p.R90H | Q6PJG9 | protein_coding | tolerated(0.56) | benign(0.005) | TCGA-CK-5916-01 | Colorectum | colon adenocarcinoma | Female | >=65 | I/II | Unknown | Unknown | PD | |
| LRFN4 | SNV | Missense_Mutation | c.959N>A | p.Arg320Gln | p.R320Q | Q6PJG9 | protein_coding | deleterious(0.01) | possibly_damaging(0.745) | TCGA-WS-AB45-01 | Colorectum | colon adenocarcinoma | Female | <65 | I/II | Unknown | Unknown | SD |
| Page: 1 2 3 4 |
Top |
Related drugs of malignant transformation related genes |
| Identification of chemicals and drugs interact with genes involved in malignant transfromation |
| (DGIdb 4.0) |
| Entrez ID | Symbol | Category | Interaction Types | Drug Claim Name | Drug Name | PMIDs |
| Page: 1 |

Copyright 2023-Present -The University of Texas Health Science Center at Houston |