
|
|||||
|
 | |
| |
| |
| |
| |
| |
|
Gene: LRCH1 |
Gene summary for LRCH1 |
| Gene information | Species | Human | Gene symbol | LRCH1 | Gene ID | 23143 |
| Gene name | leucine rich repeats and calponin homology domain containing 1 | |
| Gene Alias | CHDC1 | |
| Cytomap | 13q14.13-q14.2 | |
| Gene Type | protein-coding | GO ID | GO:0002376 | UniProtAcc | Q9Y2L9 |
Top |
Malignant transformation analysis |
| Identification of the aberrant gene expression in precancerous and cancerous lesions by comparing the gene expression of stem-like cells in diseased tissues with normal stem cells |
| Entrez ID | Symbol | Replicates | Species | Organ | Tissue | Adj P-value | Log2FC | Malignancy |
| 23143 | LRCH1 | CCI_1 | Human | Cervix | CC | 4.50e-03 | 6.55e-01 | 0.528 |
| 23143 | LRCH1 | CCI_2 | Human | Cervix | CC | 2.00e-05 | 7.02e-01 | 0.5249 |
| 23143 | LRCH1 | CCI_3 | Human | Cervix | CC | 3.37e-05 | 4.44e-01 | 0.516 |
| 23143 | LRCH1 | Tumor | Human | Cervix | CC | 4.41e-03 | -1.32e-01 | 0.1241 |
| 23143 | LRCH1 | HTA11_3410_2000001011 | Human | Colorectum | AD | 1.29e-06 | -4.35e-01 | 0.0155 |
| 23143 | LRCH1 | HTA11_696_2000001011 | Human | Colorectum | AD | 4.15e-06 | -2.63e-01 | -0.1464 |
| 23143 | LRCH1 | HTA11_866_2000001011 | Human | Colorectum | AD | 2.58e-02 | -2.39e-01 | -0.1001 |
| 23143 | LRCH1 | HTA11_866_3004761011 | Human | Colorectum | AD | 1.35e-05 | -4.42e-01 | 0.096 |
| 23143 | LRCH1 | HTA11_10711_2000001011 | Human | Colorectum | AD | 5.59e-05 | -4.51e-01 | 0.0338 |
| 23143 | LRCH1 | HTA11_7696_3000711011 | Human | Colorectum | AD | 5.91e-09 | -4.06e-01 | 0.0674 |
| 23143 | LRCH1 | HTA11_99999970781_79442 | Human | Colorectum | MSS | 3.91e-06 | -2.59e-01 | 0.294 |
| 23143 | LRCH1 | HTA11_99999965104_69814 | Human | Colorectum | MSS | 7.38e-07 | 6.93e-01 | 0.281 |
| 23143 | LRCH1 | HTA11_99999974143_84620 | Human | Colorectum | MSS | 1.06e-02 | -2.99e-01 | 0.3005 |
| 23143 | LRCH1 | F007 | Human | Colorectum | FAP | 1.76e-02 | 5.66e-02 | 0.1176 |
| 23143 | LRCH1 | A015-C-203 | Human | Colorectum | FAP | 3.10e-21 | -4.01e-01 | -0.1294 |
| 23143 | LRCH1 | A015-C-204 | Human | Colorectum | FAP | 8.32e-07 | -3.01e-01 | -0.0228 |
| 23143 | LRCH1 | A014-C-040 | Human | Colorectum | FAP | 2.49e-03 | -2.42e-01 | -0.1184 |
| 23143 | LRCH1 | A002-C-201 | Human | Colorectum | FAP | 2.40e-13 | -3.47e-01 | 0.0324 |
| 23143 | LRCH1 | A001-C-119 | Human | Colorectum | FAP | 1.00e-07 | -2.90e-01 | -0.1557 |
| 23143 | LRCH1 | A001-C-108 | Human | Colorectum | FAP | 6.79e-09 | -2.37e-01 | -0.0272 |
| Page: 1 2 3 4 5 6 |
| Tissue | Expression Dynamics | Abbreviation |
| Cervix | 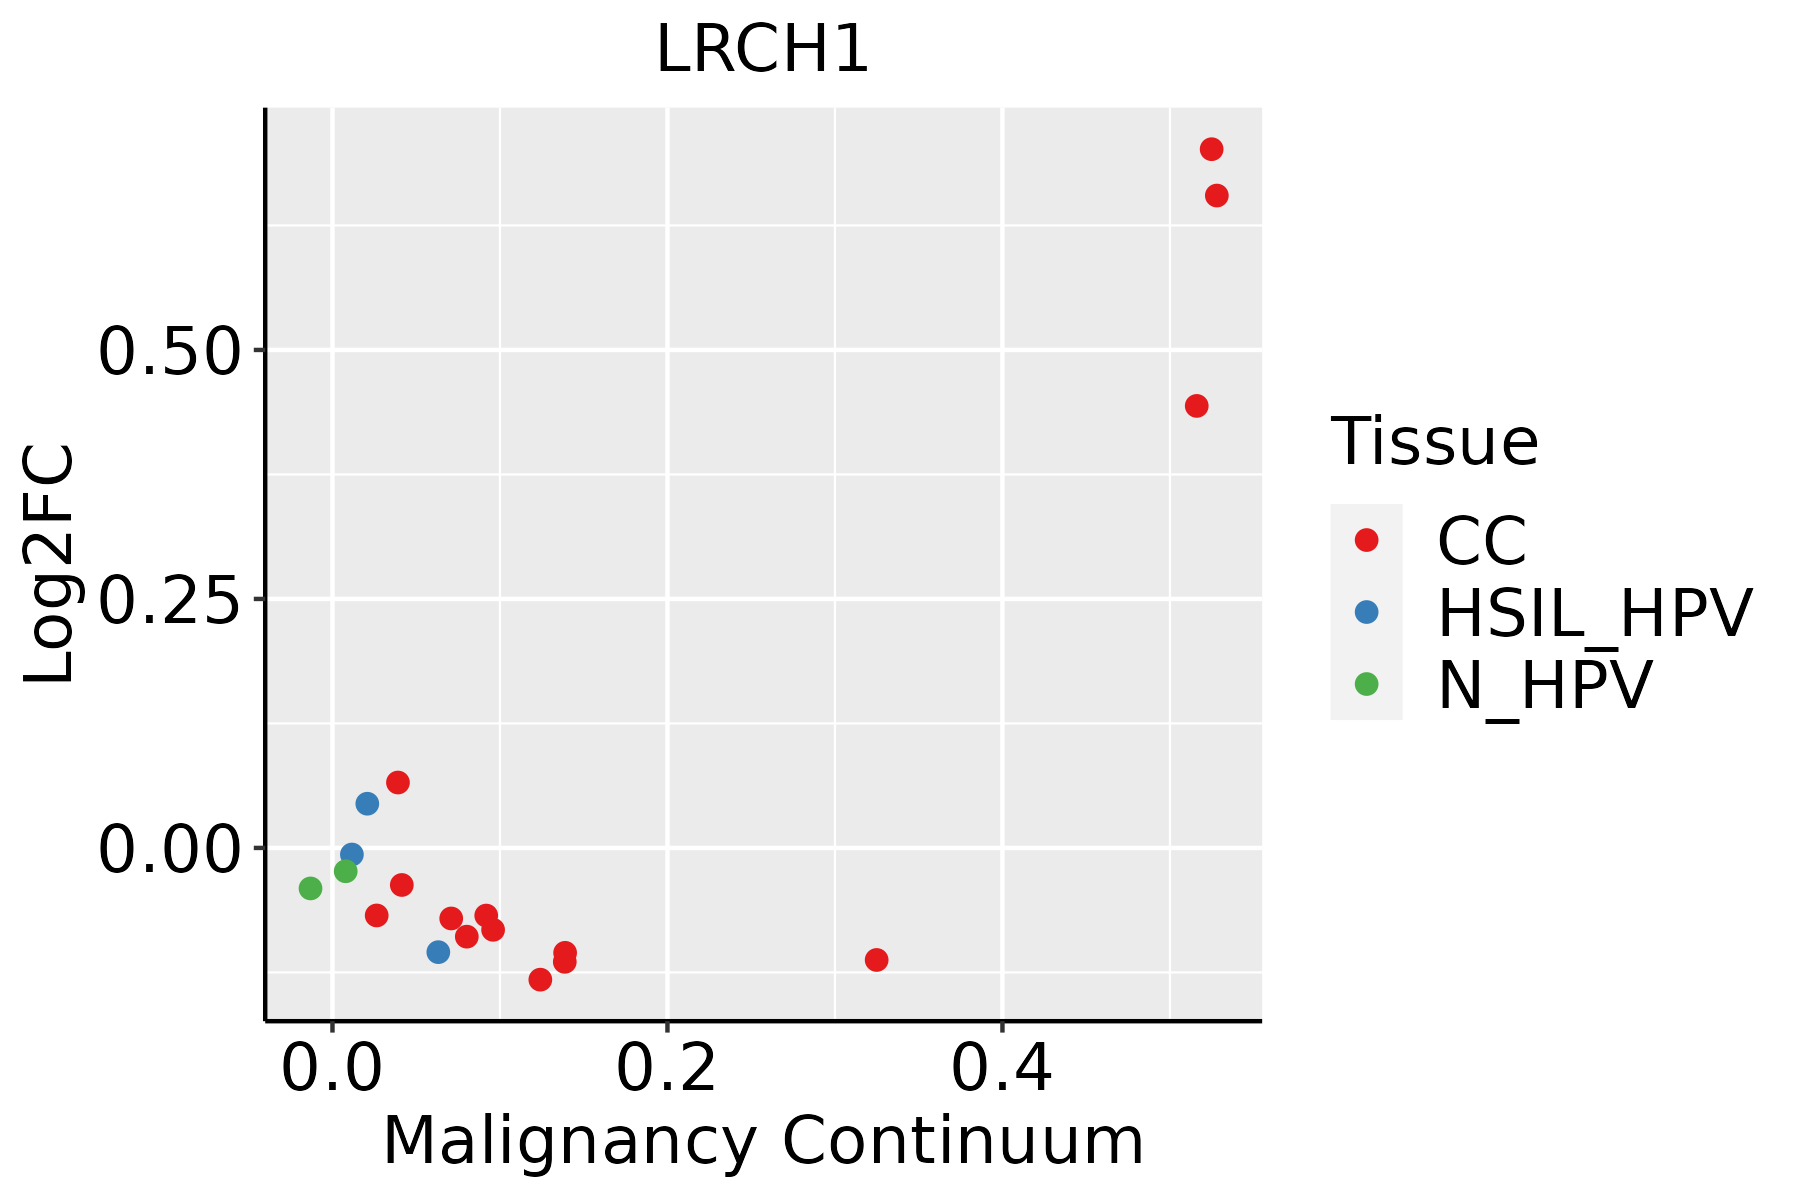 | CC: Cervix cancer |
| HSIL_HPV: HPV-infected high-grade squamous intraepithelial lesions | ||
| N_HPV: HPV-infected normal cervix | ||
| Colorectum (GSE201348) |  | FAP: Familial adenomatous polyposis |
| CRC: Colorectal cancer | ||
| Colorectum (HTA11) |  | AD: Adenomas |
| SER: Sessile serrated lesions | ||
| MSI-H: Microsatellite-high colorectal cancer | ||
| MSS: Microsatellite stable colorectal cancer | ||
| Endometrium |  | AEH: Atypical endometrial hyperplasia |
| EEC: Endometrioid Cancer | ||
| Esophagus | 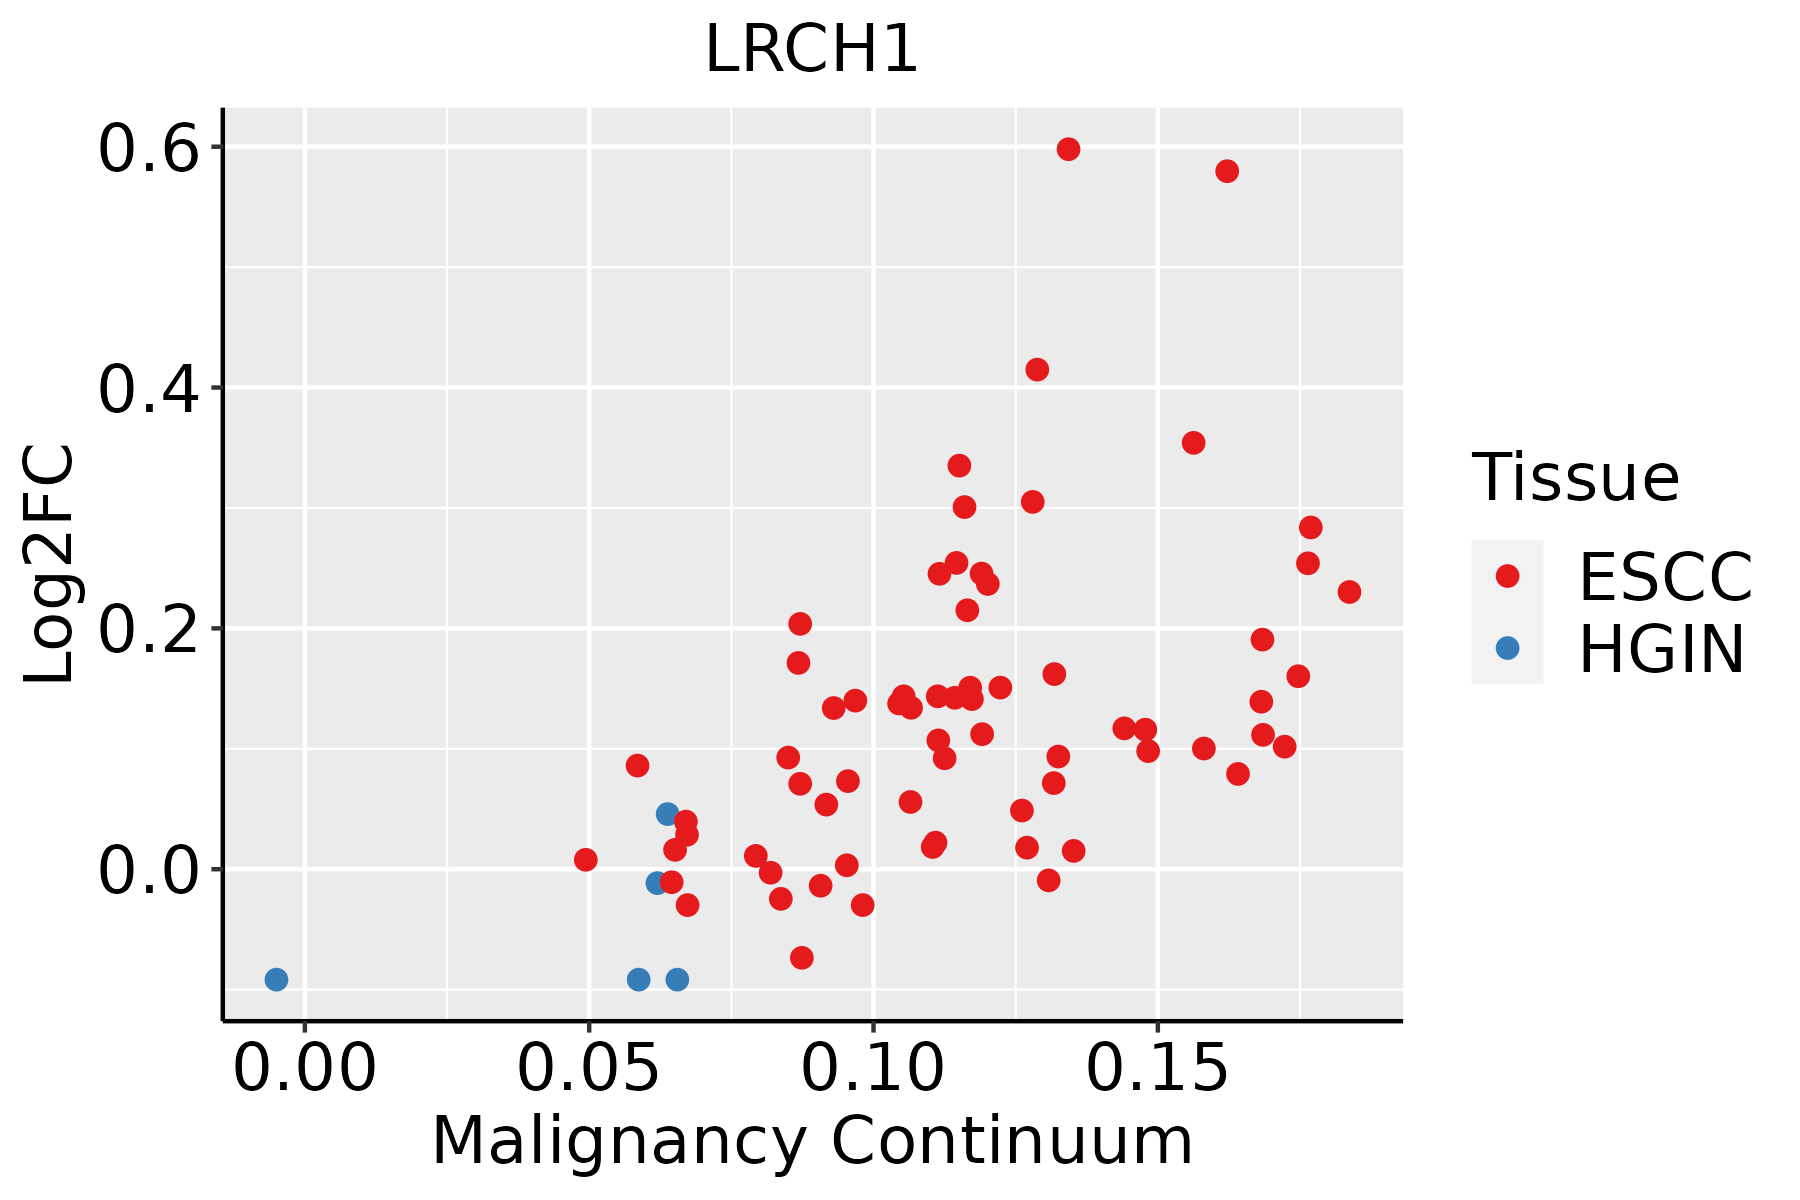 | ESCC: Esophageal squamous cell carcinoma |
| HGIN: High-grade intraepithelial neoplasias | ||
| LGIN: Low-grade intraepithelial neoplasias | ||
| Prostate |  | BPH: Benign Prostatic Hyperplasia |
| ∗log2FC in expression of this searched gene in stem-like cells from each diseased tissue sample relative to stem-like cells in normal samples in each tissue plotted against the malignancy continuum. Samples are colored based on if they are from different disease stage. |
Top |
Malignant transformation related pathway analysis |
| Find out the enriched GO biological processes and KEGG pathways involved in transition from healthy to precancer to cancer |
| Tissue | Disease Stage | Enriched GO biological Processes |
| Colorectum | AD |  |
| Colorectum | SER |  |
| Colorectum | MSS |  |
| Colorectum | MSI-H |  |
| Colorectum | FAP |  |
| ∗Top 15 enriched GO BP terms are showed in the bar plot of each disease state in each tissue. Each row represents a significant GO biological process which is colored according to the -log10(p.adjust). |
| Page: 1 2 3 4 5 6 7 8 9 |
| GO ID | Tissue | Disease Stage | Description | Gene Ratio | Bg Ratio | pvalue | p.adjust | Count |
| GO:00026837 | Cervix | CC | negative regulation of immune system process | 94/2311 | 434/18723 | 2.63e-08 | 1.87e-06 | 94 |
| GO:00430877 | Cervix | CC | regulation of GTPase activity | 79/2311 | 348/18723 | 4.21e-08 | 2.60e-06 | 79 |
| GO:00513469 | Cervix | CC | negative regulation of hydrolase activity | 81/2311 | 379/18723 | 4.27e-07 | 1.67e-05 | 81 |
| GO:00509007 | Cervix | CC | leukocyte migration | 78/2311 | 369/18723 | 1.09e-06 | 3.80e-05 | 78 |
| GO:00026857 | Cervix | CC | regulation of leukocyte migration | 50/2311 | 210/18723 | 2.95e-06 | 8.31e-05 | 50 |
| GO:00716755 | Cervix | CC | regulation of mononuclear cell migration | 31/2311 | 115/18723 | 1.67e-05 | 3.22e-04 | 31 |
| GO:00512713 | Cervix | CC | negative regulation of cellular component movement | 73/2311 | 367/18723 | 2.22e-05 | 3.95e-04 | 73 |
| GO:00400133 | Cervix | CC | negative regulation of locomotion | 76/2311 | 391/18723 | 3.47e-05 | 5.60e-04 | 76 |
| GO:20001463 | Cervix | CC | negative regulation of cell motility | 71/2311 | 359/18723 | 3.47e-05 | 5.60e-04 | 71 |
| GO:00303363 | Cervix | CC | negative regulation of cell migration | 68/2311 | 344/18723 | 5.11e-05 | 7.70e-04 | 68 |
| GO:00716745 | Cervix | CC | mononuclear cell migration | 40/2311 | 196/18723 | 8.79e-04 | 7.62e-03 | 40 |
| GO:20004043 | Cervix | CC | regulation of T cell migration | 13/2311 | 42/18723 | 1.18e-03 | 9.56e-03 | 13 |
| GO:00726782 | Cervix | CC | T cell migration | 17/2311 | 66/18723 | 2.20e-03 | 1.58e-02 | 17 |
| GO:20004012 | Cervix | CC | regulation of lymphocyte migration | 16/2311 | 61/18723 | 2.40e-03 | 1.70e-02 | 16 |
| GO:0043087 | Colorectum | AD | regulation of GTPase activity | 110/3918 | 348/18723 | 1.64e-06 | 5.03e-05 | 110 |
| GO:00430872 | Colorectum | MSS | regulation of GTPase activity | 101/3467 | 348/18723 | 1.00e-06 | 3.46e-05 | 101 |
| GO:00513461 | Colorectum | MSS | negative regulation of hydrolase activity | 92/3467 | 379/18723 | 2.85e-03 | 2.22e-02 | 92 |
| GO:00430873 | Colorectum | FAP | regulation of GTPase activity | 85/2622 | 348/18723 | 1.20e-07 | 7.68e-06 | 85 |
| GO:00430874 | Colorectum | CRC | regulation of GTPase activity | 69/2078 | 348/18723 | 1.11e-06 | 6.69e-05 | 69 |
| GO:00430878 | Endometrium | AEH | regulation of GTPase activity | 66/2100 | 348/18723 | 1.26e-05 | 2.77e-04 | 66 |
| Page: 1 2 3 |
| Pathway ID | Tissue | Disease Stage | Description | Gene Ratio | Bg Ratio | pvalue | p.adjust | qvalue | Count |
| Page: 1 |
Top |
Cell-cell communication analysis |
| Identification of potential cell-cell interactions between two cell types and their ligand-receptor pairs for different disease states |
| Ligand | Receptor | LRpair | Pathway | Tissue | Disease Stage |
| Page: 1 |
Top |
Single-cell gene regulatory network inference analysis |
| Find out the significant the regulons (TFs) and the target genes of each regulon across cell types for different disease states |
| TF | Cell Type | Tissue | Disease Stage | Target Gene | RSS | Regulon Activity |
| ∗The dot plots of a searched regulon are shown for all cell subpopulations in each disease state of each tissue based on the regulon specific score inferred using pySCENIC and by calculating the average expression. |
| Page: 1 |
Top |
Somatic mutation of malignant transformation related genes |
| Annotation of somatic variants for genes involved in malignant transformation |
| Hugo Symbol | Variant Class | Variant Classification | dbSNP RS | HGVSc | HGVSp | HGVSp Short | SWISSPROT | BIOTYPE | SIFT | PolyPhen | Tumor Sample Barcode | Tissue | Histology | Sex | Age | Stage | Therapy Types | Drugs | Outcome |
| LRCH1 | SNV | Missense_Mutation | c.643N>C | p.Glu215Gln | p.E215Q | Q9Y2L9 | protein_coding | deleterious(0) | benign(0.083) | TCGA-5L-AAT1-01 | Breast | breast invasive carcinoma | Female | <65 | III/IV | Hormone Therapy | letrozol | SD | |
| LRCH1 | SNV | Missense_Mutation | novel | c.1595N>G | p.Ser532Cys | p.S532C | Q9Y2L9 | protein_coding | deleterious(0.01) | possibly_damaging(0.893) | TCGA-A2-A0CR-01 | Breast | breast invasive carcinoma | Female | <65 | I/II | Chemotherapy | adriamycin | CR |
| LRCH1 | SNV | Missense_Mutation | c.1586G>C | p.Arg529Thr | p.R529T | Q9Y2L9 | protein_coding | tolerated(0.05) | benign(0.167) | TCGA-A2-A0SY-01 | Breast | breast invasive carcinoma | Female | <65 | III/IV | Hormone Therapy | arimidex | SD | |
| LRCH1 | SNV | Missense_Mutation | c.765N>C | p.Met255Ile | p.M255I | Q9Y2L9 | protein_coding | deleterious(0) | probably_damaging(0.981) | TCGA-AC-A23H-01 | Breast | breast invasive carcinoma | Female | >=65 | I/II | Unknown | Unknown | PD | |
| LRCH1 | SNV | Missense_Mutation | c.1864N>T | p.Arg622Cys | p.R622C | Q9Y2L9 | protein_coding | deleterious(0) | probably_damaging(0.999) | TCGA-AN-A046-01 | Breast | breast invasive carcinoma | Female | >=65 | I/II | Unknown | Unknown | SD | |
| LRCH1 | SNV | Missense_Mutation | c.1830G>T | p.Gln610His | p.Q610H | Q9Y2L9 | protein_coding | tolerated(0.38) | probably_damaging(0.999) | TCGA-AN-A0AK-01 | Breast | breast invasive carcinoma | Female | >=65 | I/II | Unknown | Unknown | SD | |
| LRCH1 | SNV | Missense_Mutation | rs776852021 | c.940N>A | p.Val314Met | p.V314M | Q9Y2L9 | protein_coding | deleterious(0.04) | benign(0.148) | TCGA-BH-A0AW-01 | Breast | breast invasive carcinoma | Female | <65 | I/II | Chemotherapy | carboplatin | SD |
| LRCH1 | SNV | Missense_Mutation | c.1462N>A | p.Ala488Thr | p.A488T | Q9Y2L9 | protein_coding | tolerated(0.45) | benign(0.003) | TCGA-BH-A0HF-01 | Breast | breast invasive carcinoma | Female | >=65 | I/II | Hormone Therapy | arimidex | SD | |
| LRCH1 | SNV | Missense_Mutation | c.1462N>A | p.Ala488Thr | p.A488T | Q9Y2L9 | protein_coding | tolerated(0.45) | benign(0.003) | TCGA-BH-A0W3-01 | Breast | breast invasive carcinoma | Female | <65 | I/II | Unknown | Unknown | SD | |
| LRCH1 | SNV | Missense_Mutation | c.47C>T | p.Ser16Leu | p.S16L | Q9Y2L9 | protein_coding | deleterious_low_confidence(0.01) | benign(0.054) | TCGA-BH-A18P-01 | Breast | breast invasive carcinoma | Female | <65 | I/II | Unknown | Unknown | PD |
| Page: 1 2 3 4 5 6 7 8 |
Top |
Related drugs of malignant transformation related genes |
| Identification of chemicals and drugs interact with genes involved in malignant transfromation |
| (DGIdb 4.0) |
| Entrez ID | Symbol | Category | Interaction Types | Drug Claim Name | Drug Name | PMIDs |
| Page: 1 |

Copyright 2023-Present -The University of Texas Health Science Center at Houston |