
|
|||||
|
 | |
| |
| |
| |
| |
| |
|
Gene: LPIN2 |
Gene summary for LPIN2 |
| Gene information | Species | Human | Gene symbol | LPIN2 | Gene ID | 9663 |
| Gene name | lipin 2 | |
| Gene Alias | LPIN2 | |
| Cytomap | 18p11.31 | |
| Gene Type | protein-coding | GO ID | GO:0006082 | UniProtAcc | Q92539 |
Top |
Malignant transformation analysis |
| Identification of the aberrant gene expression in precancerous and cancerous lesions by comparing the gene expression of stem-like cells in diseased tissues with normal stem cells |
| Entrez ID | Symbol | Replicates | Species | Organ | Tissue | Adj P-value | Log2FC | Malignancy |
| 9663 | LPIN2 | LZE7T | Human | Esophagus | ESCC | 1.13e-02 | 2.12e-01 | 0.0667 |
| 9663 | LPIN2 | LZE24T | Human | Esophagus | ESCC | 3.26e-02 | 8.68e-02 | 0.0596 |
| 9663 | LPIN2 | P1T-E | Human | Esophagus | ESCC | 1.04e-02 | 3.95e-01 | 0.0875 |
| 9663 | LPIN2 | P2T-E | Human | Esophagus | ESCC | 7.41e-16 | 4.27e-01 | 0.1177 |
| 9663 | LPIN2 | P4T-E | Human | Esophagus | ESCC | 4.70e-13 | 3.38e-01 | 0.1323 |
| 9663 | LPIN2 | P5T-E | Human | Esophagus | ESCC | 4.69e-06 | 5.71e-02 | 0.1327 |
| 9663 | LPIN2 | P8T-E | Human | Esophagus | ESCC | 1.43e-10 | 2.25e-01 | 0.0889 |
| 9663 | LPIN2 | P9T-E | Human | Esophagus | ESCC | 1.14e-11 | 2.64e-01 | 0.1131 |
| 9663 | LPIN2 | P10T-E | Human | Esophagus | ESCC | 9.71e-22 | 4.08e-01 | 0.116 |
| 9663 | LPIN2 | P11T-E | Human | Esophagus | ESCC | 1.87e-07 | 3.30e-01 | 0.1426 |
| 9663 | LPIN2 | P16T-E | Human | Esophagus | ESCC | 3.77e-05 | 1.59e-01 | 0.1153 |
| 9663 | LPIN2 | P21T-E | Human | Esophagus | ESCC | 1.64e-13 | 3.08e-01 | 0.1617 |
| 9663 | LPIN2 | P22T-E | Human | Esophagus | ESCC | 1.03e-04 | 1.50e-01 | 0.1236 |
| 9663 | LPIN2 | P23T-E | Human | Esophagus | ESCC | 2.99e-15 | 7.09e-01 | 0.108 |
| 9663 | LPIN2 | P24T-E | Human | Esophagus | ESCC | 3.14e-03 | 5.19e-02 | 0.1287 |
| 9663 | LPIN2 | P26T-E | Human | Esophagus | ESCC | 2.49e-26 | 5.15e-01 | 0.1276 |
| 9663 | LPIN2 | P27T-E | Human | Esophagus | ESCC | 2.07e-13 | 3.47e-01 | 0.1055 |
| 9663 | LPIN2 | P31T-E | Human | Esophagus | ESCC | 1.62e-14 | 3.59e-01 | 0.1251 |
| 9663 | LPIN2 | P32T-E | Human | Esophagus | ESCC | 4.58e-05 | 1.27e-01 | 0.1666 |
| 9663 | LPIN2 | P37T-E | Human | Esophagus | ESCC | 8.60e-09 | 2.60e-01 | 0.1371 |
| Page: 1 2 3 4 5 |
| Tissue | Expression Dynamics | Abbreviation |
| Esophagus | 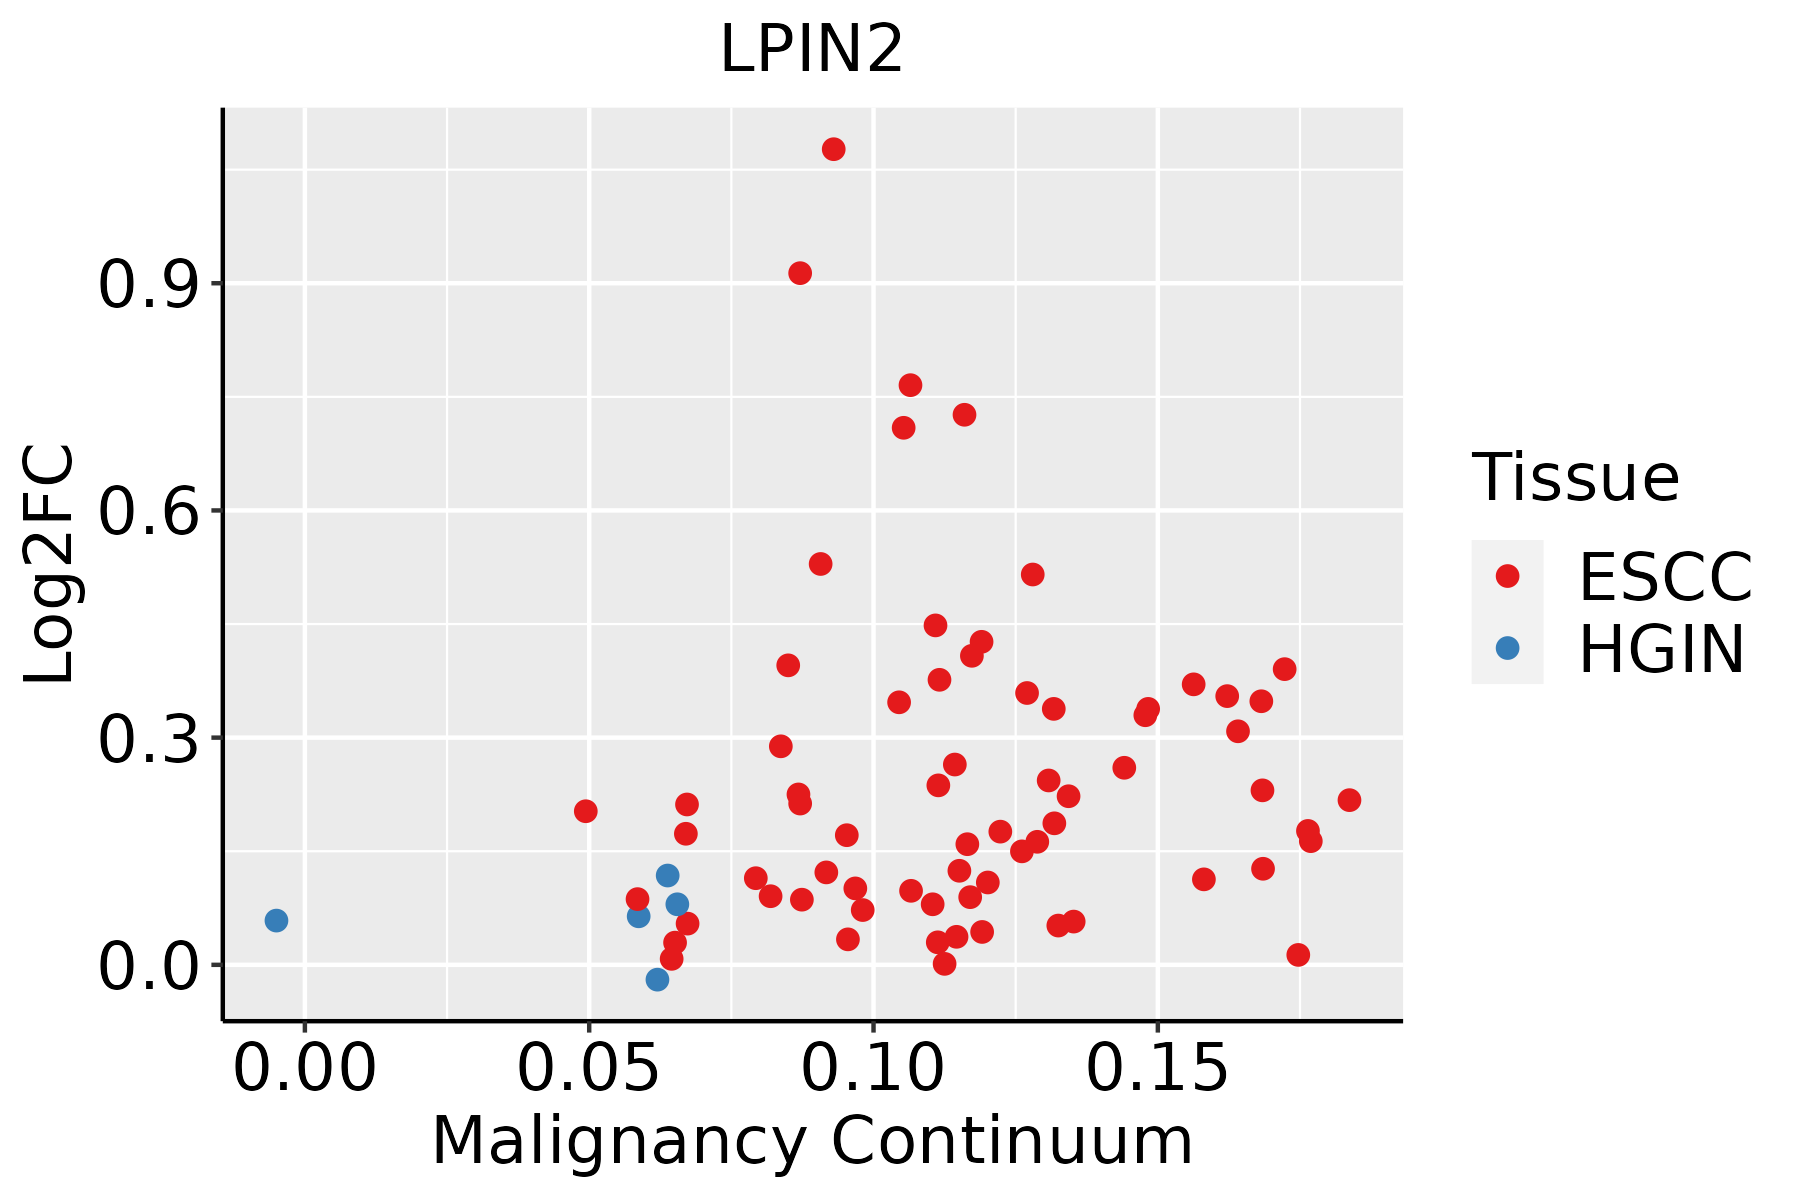 | ESCC: Esophageal squamous cell carcinoma |
| HGIN: High-grade intraepithelial neoplasias | ||
| LGIN: Low-grade intraepithelial neoplasias | ||
| Liver | 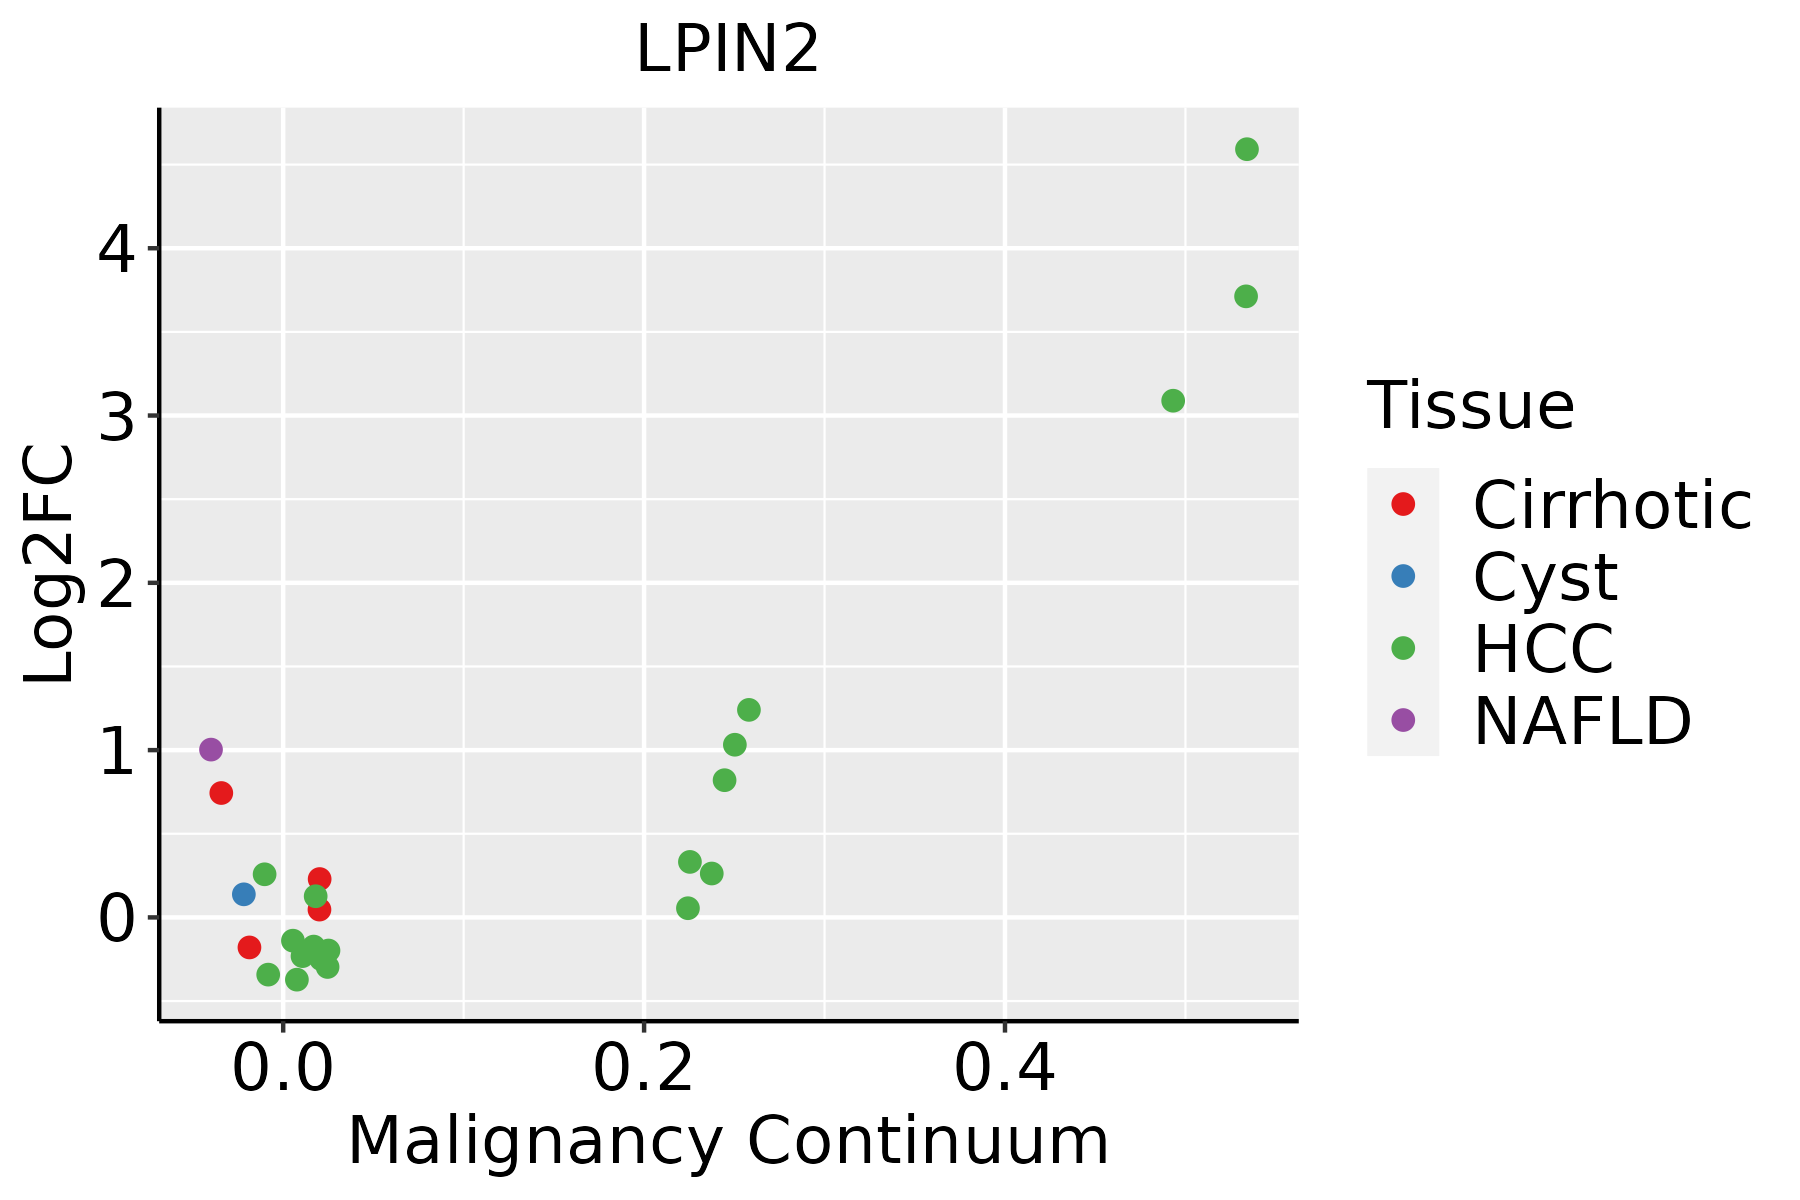 | HCC: Hepatocellular carcinoma |
| NAFLD: Non-alcoholic fatty liver disease | ||
| Lung |  | AAH: Atypical adenomatous hyperplasia |
| AIS: Adenocarcinoma in situ | ||
| IAC: Invasive lung adenocarcinoma | ||
| MIA: Minimally invasive adenocarcinoma | ||
| Thyroid | 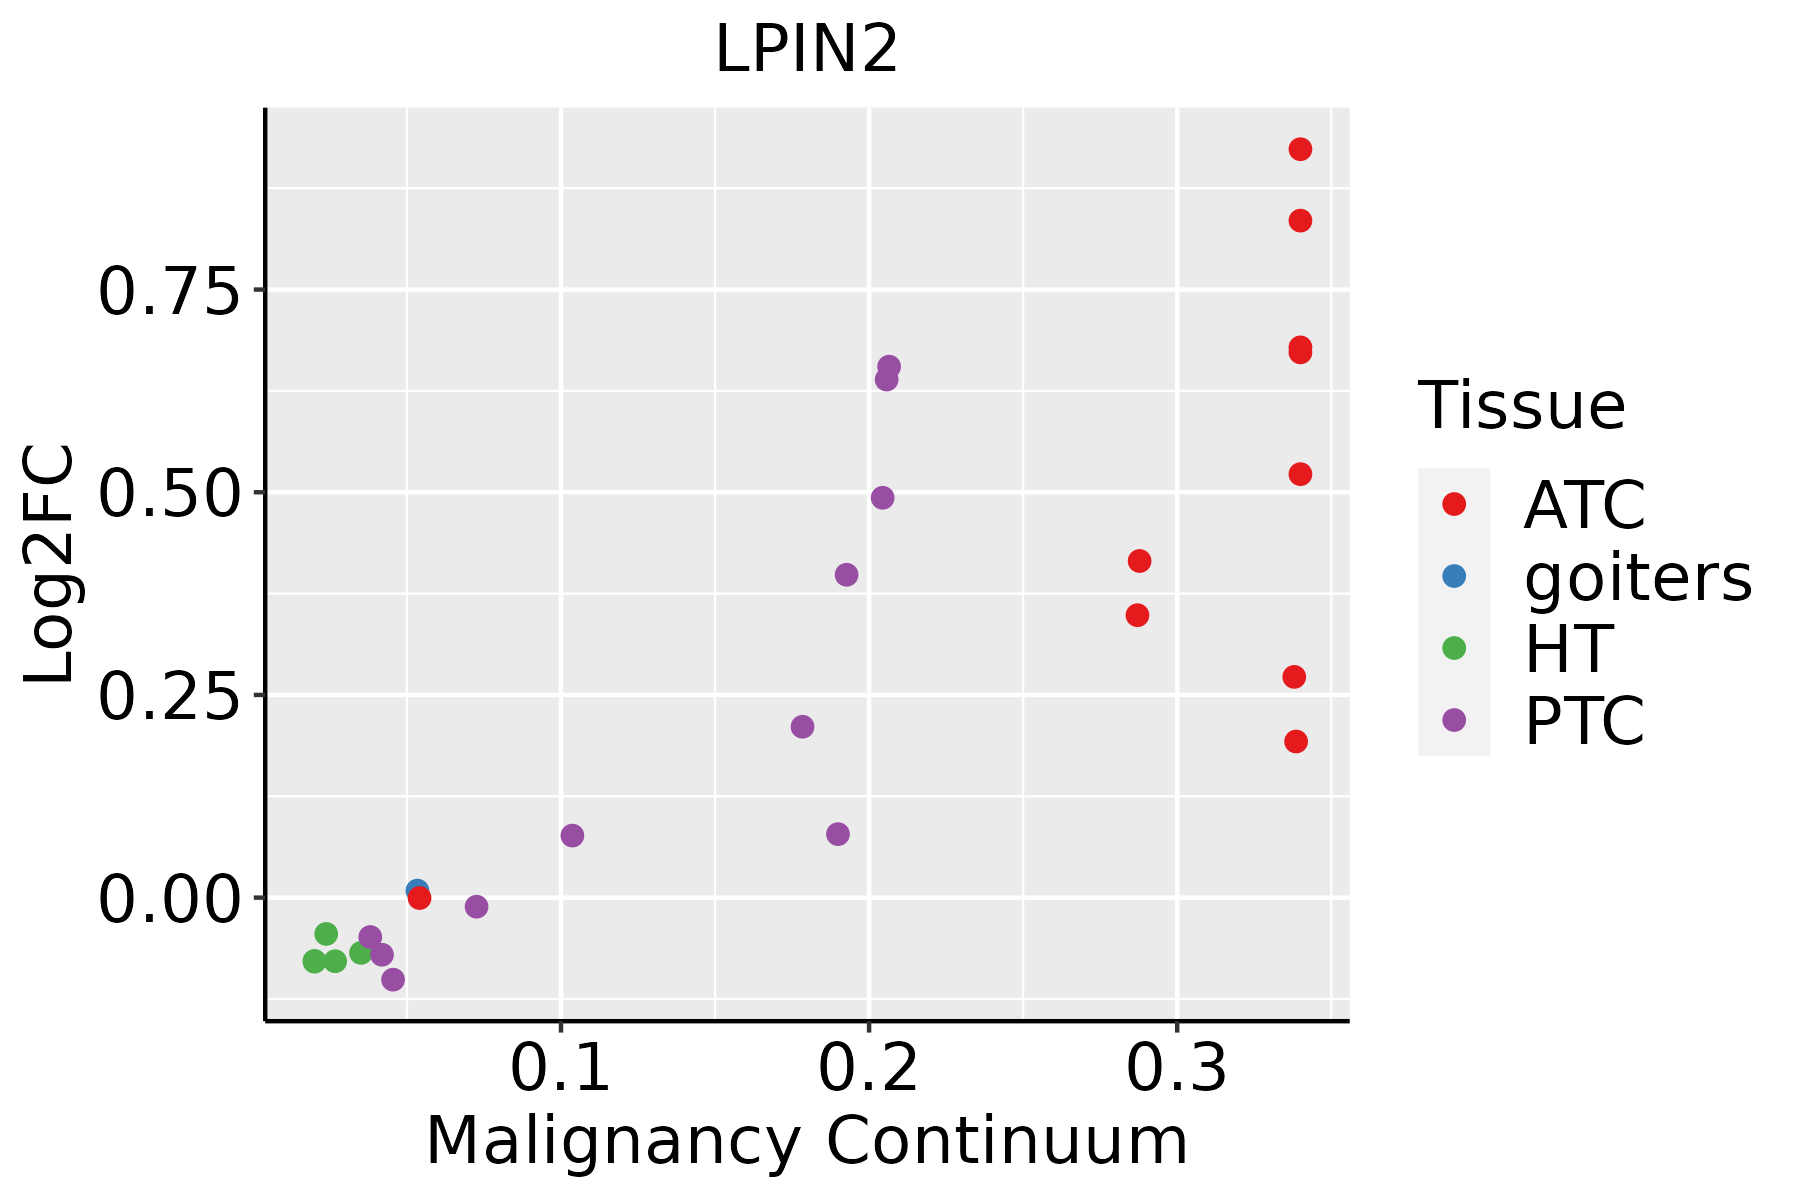 | ATC: Anaplastic thyroid cancer |
| HT: Hashimoto's thyroiditis | ||
| PTC: Papillary thyroid cancer |
| ∗log2FC in expression of this searched gene in stem-like cells from each diseased tissue sample relative to stem-like cells in normal samples in each tissue plotted against the malignancy continuum. Samples are colored based on if they are from different disease stage. |
Top |
Malignant transformation related pathway analysis |
| Find out the enriched GO biological processes and KEGG pathways involved in transition from healthy to precancer to cancer |
| Tissue | Disease Stage | Enriched GO biological Processes |
| Colorectum | AD |  |
| Colorectum | SER |  |
| Colorectum | MSS |  |
| Colorectum | MSI-H |  |
| Colorectum | FAP |  |
| ∗Top 15 enriched GO BP terms are showed in the bar plot of each disease state in each tissue. Each row represents a significant GO biological process which is colored according to the -log10(p.adjust). |
| Page: 1 2 3 4 5 6 7 8 9 |
| GO ID | Tissue | Disease Stage | Description | Gene Ratio | Bg Ratio | pvalue | p.adjust | Count |
| GO:001631110 | Esophagus | ESCC | dephosphorylation | 251/8552 | 417/18723 | 1.26e-09 | 2.99e-08 | 251 |
| GO:00450175 | Esophagus | ESCC | glycerolipid biosynthetic process | 154/8552 | 252/18723 | 5.20e-07 | 6.96e-06 | 154 |
| GO:190165319 | Esophagus | ESCC | cellular response to peptide | 208/8552 | 359/18723 | 1.68e-06 | 2.01e-05 | 208 |
| GO:0043434111 | Esophagus | ESCC | response to peptide hormone | 234/8552 | 414/18723 | 4.93e-06 | 5.21e-05 | 234 |
| GO:003286918 | Esophagus | ESCC | cellular response to insulin stimulus | 124/8552 | 203/18723 | 6.63e-06 | 6.75e-05 | 124 |
| GO:003286818 | Esophagus | ESCC | response to insulin | 156/8552 | 264/18723 | 7.21e-06 | 7.20e-05 | 156 |
| GO:00090628 | Esophagus | ESCC | fatty acid catabolic process | 66/8552 | 100/18723 | 3.21e-05 | 2.66e-04 | 66 |
| GO:00066318 | Esophagus | ESCC | fatty acid metabolic process | 217/8552 | 390/18723 | 4.21e-05 | 3.39e-04 | 217 |
| GO:007137516 | Esophagus | ESCC | cellular response to peptide hormone stimulus | 166/8552 | 290/18723 | 4.48e-05 | 3.55e-04 | 166 |
| GO:00723297 | Esophagus | ESCC | monocarboxylic acid catabolic process | 74/8552 | 122/18723 | 6.03e-04 | 3.27e-03 | 74 |
| GO:00464864 | Esophagus | ESCC | glycerolipid metabolic process | 211/8552 | 392/18723 | 6.51e-04 | 3.46e-03 | 211 |
| GO:00442427 | Esophagus | ESCC | cellular lipid catabolic process | 121/8552 | 214/18723 | 8.63e-04 | 4.43e-03 | 121 |
| GO:00442827 | Esophagus | ESCC | small molecule catabolic process | 201/8552 | 376/18723 | 1.35e-03 | 6.41e-03 | 201 |
| GO:00160427 | Esophagus | ESCC | lipid catabolic process | 168/8552 | 320/18723 | 7.97e-03 | 2.84e-02 | 168 |
| GO:00463953 | Liver | NAFLD | carboxylic acid catabolic process | 73/1882 | 236/18723 | 4.16e-19 | 1.22e-15 | 73 |
| GO:00160544 | Liver | NAFLD | organic acid catabolic process | 73/1882 | 240/18723 | 1.20e-18 | 2.34e-15 | 73 |
| GO:00442825 | Liver | NAFLD | small molecule catabolic process | 91/1882 | 376/18723 | 8.96e-16 | 1.31e-12 | 91 |
| GO:00066316 | Liver | NAFLD | fatty acid metabolic process | 92/1882 | 390/18723 | 3.38e-15 | 3.29e-12 | 92 |
| GO:00723295 | Liver | NAFLD | monocarboxylic acid catabolic process | 39/1882 | 122/18723 | 2.40e-11 | 8.77e-09 | 39 |
| GO:00090626 | Liver | NAFLD | fatty acid catabolic process | 34/1882 | 100/18723 | 6.81e-11 | 1.99e-08 | 34 |
| Page: 1 2 3 4 5 |
| Pathway ID | Tissue | Disease Stage | Description | Gene Ratio | Bg Ratio | pvalue | p.adjust | qvalue | Count |
| hsa041505 | Esophagus | ESCC | mTOR signaling pathway | 98/4205 | 156/8465 | 5.81e-04 | 1.95e-03 | 9.97e-04 | 98 |
| hsa0415013 | Esophagus | ESCC | mTOR signaling pathway | 98/4205 | 156/8465 | 5.81e-04 | 1.95e-03 | 9.97e-04 | 98 |
| hsa04936 | Liver | Cirrhotic | Alcoholic liver disease | 60/2530 | 142/8465 | 1.07e-03 | 5.85e-03 | 3.61e-03 | 60 |
| hsa049361 | Liver | Cirrhotic | Alcoholic liver disease | 60/2530 | 142/8465 | 1.07e-03 | 5.85e-03 | 3.61e-03 | 60 |
| hsa049362 | Liver | HCC | Alcoholic liver disease | 89/4020 | 142/8465 | 1.73e-04 | 8.53e-04 | 4.75e-04 | 89 |
| hsa041502 | Liver | HCC | mTOR signaling pathway | 95/4020 | 156/8465 | 4.70e-04 | 1.99e-03 | 1.11e-03 | 95 |
| hsa049363 | Liver | HCC | Alcoholic liver disease | 89/4020 | 142/8465 | 1.73e-04 | 8.53e-04 | 4.75e-04 | 89 |
| hsa0415011 | Liver | HCC | mTOR signaling pathway | 95/4020 | 156/8465 | 4.70e-04 | 1.99e-03 | 1.11e-03 | 95 |
| hsa049364 | Lung | IAC | Alcoholic liver disease | 29/1053 | 142/8465 | 4.45e-03 | 2.07e-02 | 1.37e-02 | 29 |
| hsa0493611 | Lung | IAC | Alcoholic liver disease | 29/1053 | 142/8465 | 4.45e-03 | 2.07e-02 | 1.37e-02 | 29 |
| Page: 1 |
Top |
Cell-cell communication analysis |
| Identification of potential cell-cell interactions between two cell types and their ligand-receptor pairs for different disease states |
| Ligand | Receptor | LRpair | Pathway | Tissue | Disease Stage |
| Page: 1 |
Top |
Single-cell gene regulatory network inference analysis |
| Find out the significant the regulons (TFs) and the target genes of each regulon across cell types for different disease states |
| TF | Cell Type | Tissue | Disease Stage | Target Gene | RSS | Regulon Activity |
| ∗The dot plots of a searched regulon are shown for all cell subpopulations in each disease state of each tissue based on the regulon specific score inferred using pySCENIC and by calculating the average expression. |
| Page: 1 |
Top |
Somatic mutation of malignant transformation related genes |
| Annotation of somatic variants for genes involved in malignant transformation |
| Hugo Symbol | Variant Class | Variant Classification | dbSNP RS | HGVSc | HGVSp | HGVSp Short | SWISSPROT | BIOTYPE | SIFT | PolyPhen | Tumor Sample Barcode | Tissue | Histology | Sex | Age | Stage | Therapy Types | Drugs | Outcome |
| LPIN2 | SNV | Missense_Mutation | novel | c.2626N>C | p.Glu876Gln | p.E876Q | Q92539 | protein_coding | deleterious(0) | probably_damaging(0.914) | TCGA-A2-A0EQ-01 | Breast | breast invasive carcinoma | Female | <65 | I/II | Chemotherapy | adriamycin | SD |
| LPIN2 | SNV | Missense_Mutation | rs201325845 | c.1489N>A | p.Glu497Lys | p.E497K | Q92539 | protein_coding | deleterious(0.03) | possibly_damaging(0.572) | TCGA-AN-A046-01 | Breast | breast invasive carcinoma | Female | >=65 | I/II | Unknown | Unknown | SD |
| LPIN2 | SNV | Missense_Mutation | c.1231C>A | p.Leu411Ile | p.L411I | Q92539 | protein_coding | deleterious(0) | probably_damaging(0.997) | TCGA-D8-A1JK-01 | Breast | breast invasive carcinoma | Female | >=65 | I/II | Unknown | Unknown | SD | |
| LPIN2 | SNV | Missense_Mutation | c.898N>C | p.Val300Leu | p.V300L | Q92539 | protein_coding | tolerated(0.09) | benign(0.248) | TCGA-E9-A1RF-01 | Breast | breast invasive carcinoma | Female | >=65 | III/IV | Hormone Therapy | tamoxiphen | SD | |
| LPIN2 | SNV | Missense_Mutation | rs201325845 | c.1489N>A | p.Glu497Lys | p.E497K | Q92539 | protein_coding | deleterious(0.03) | possibly_damaging(0.572) | TCGA-EW-A1IZ-01 | Breast | breast invasive carcinoma | Female | <65 | III/IV | Chemotherapy | taxotere | SD |
| LPIN2 | deletion | Frame_Shift_Del | c.706_710delNNNNN | p.Pro236AspfsTer5 | p.P236Dfs*5 | Q92539 | protein_coding | TCGA-BH-A0B3-01 | Breast | breast invasive carcinoma | Female | <65 | I/II | Chemotherapy | cyclophosphamide | SD | |||
| LPIN2 | SNV | Missense_Mutation | rs749727482 | c.839N>A | p.Arg280Gln | p.R280Q | Q92539 | protein_coding | tolerated(0.18) | benign(0.165) | TCGA-2W-A8YY-01 | Cervix | cervical & endocervical cancer | Female | <65 | I/II | Chemotherapy | cisplatin | CR |
| LPIN2 | SNV | Missense_Mutation | novel | c.1333N>A | p.Gln445Lys | p.Q445K | Q92539 | protein_coding | tolerated(0.08) | possibly_damaging(0.627) | TCGA-C5-A7CK-01 | Cervix | cervical & endocervical cancer | Female | <65 | I/II | Chemotherapy | cisplatin | SD |
| LPIN2 | SNV | Missense_Mutation | novel | c.428N>A | p.Thr143Lys | p.T143K | Q92539 | protein_coding | tolerated(0.69) | benign(0) | TCGA-EK-A2H0-01 | Cervix | cervical & endocervical cancer | Female | <65 | I/II | Chemotherapy | cisplatin | CR |
| LPIN2 | SNV | Missense_Mutation | rs753664055 | c.2435G>A | p.Arg812His | p.R812H | Q92539 | protein_coding | deleterious(0) | probably_damaging(1) | TCGA-FU-A3WB-01 | Cervix | cervical & endocervical cancer | Female | <65 | I/II | Chemotherapy | cisplatin | CR |
| Page: 1 2 3 4 5 6 7 8 9 |
Top |
Related drugs of malignant transformation related genes |
| Identification of chemicals and drugs interact with genes involved in malignant transfromation |
| (DGIdb 4.0) |
| Entrez ID | Symbol | Category | Interaction Types | Drug Claim Name | Drug Name | PMIDs |
| Page: 1 |

Copyright 2023-Present -The University of Texas Health Science Center at Houston |