
|
|||||
|
 | |
| |
| |
| |
| |
| |
|
Gene: LPCAT4 |
Gene summary for LPCAT4 |
| Gene information | Species | Human | Gene symbol | LPCAT4 | Gene ID | 254531 |
| Gene name | lysophosphatidylcholine acyltransferase 4 | |
| Gene Alias | AGPAT7 | |
| Cytomap | 15q14 | |
| Gene Type | protein-coding | GO ID | GO:0006575 | UniProtAcc | Q643R3 |
Top |
Malignant transformation analysis |
| Identification of the aberrant gene expression in precancerous and cancerous lesions by comparing the gene expression of stem-like cells in diseased tissues with normal stem cells |
| Entrez ID | Symbol | Replicates | Species | Organ | Tissue | Adj P-value | Log2FC | Malignancy |
| 254531 | LPCAT4 | HTA11_2487_2000001011 | Human | Colorectum | SER | 3.69e-10 | 6.51e-01 | -0.1808 |
| 254531 | LPCAT4 | HTA11_78_2000001011 | Human | Colorectum | AD | 4.86e-05 | 4.20e-01 | -0.1088 |
| 254531 | LPCAT4 | HTA11_347_2000001011 | Human | Colorectum | AD | 1.82e-28 | 8.42e-01 | -0.1954 |
| 254531 | LPCAT4 | HTA11_411_2000001011 | Human | Colorectum | SER | 5.66e-05 | 9.80e-01 | -0.2602 |
| 254531 | LPCAT4 | HTA11_83_2000001011 | Human | Colorectum | SER | 1.79e-04 | 4.63e-01 | -0.1526 |
| 254531 | LPCAT4 | HTA11_696_2000001011 | Human | Colorectum | AD | 4.44e-08 | 6.31e-01 | -0.1464 |
| 254531 | LPCAT4 | HTA11_5212_2000001011 | Human | Colorectum | AD | 7.42e-03 | 5.38e-01 | -0.2061 |
| 254531 | LPCAT4 | HTA11_5216_2000001011 | Human | Colorectum | SER | 3.07e-03 | 5.60e-01 | -0.1462 |
| 254531 | LPCAT4 | A002-C-010 | Human | Colorectum | FAP | 1.24e-07 | -2.72e-01 | 0.242 |
| 254531 | LPCAT4 | A015-C-203 | Human | Colorectum | FAP | 3.94e-16 | -1.89e-01 | -0.1294 |
| 254531 | LPCAT4 | A002-C-201 | Human | Colorectum | FAP | 1.17e-03 | -1.70e-01 | 0.0324 |
| 254531 | LPCAT4 | A002-C-203 | Human | Colorectum | FAP | 3.17e-07 | -1.98e-01 | 0.2786 |
| 254531 | LPCAT4 | A001-C-119 | Human | Colorectum | FAP | 6.07e-03 | -3.52e-01 | -0.1557 |
| 254531 | LPCAT4 | A001-C-108 | Human | Colorectum | FAP | 7.33e-10 | -2.28e-01 | -0.0272 |
| 254531 | LPCAT4 | A002-C-205 | Human | Colorectum | FAP | 6.98e-08 | -2.81e-01 | -0.1236 |
| 254531 | LPCAT4 | A001-C-104 | Human | Colorectum | FAP | 3.56e-06 | -2.34e-01 | 0.0184 |
| 254531 | LPCAT4 | A015-C-006 | Human | Colorectum | FAP | 1.30e-04 | -2.63e-01 | -0.0994 |
| 254531 | LPCAT4 | A015-C-106 | Human | Colorectum | FAP | 9.32e-09 | -1.42e-01 | -0.0511 |
| 254531 | LPCAT4 | A002-C-114 | Human | Colorectum | FAP | 5.60e-05 | -1.90e-01 | -0.1561 |
| 254531 | LPCAT4 | A015-C-104 | Human | Colorectum | FAP | 1.80e-17 | -2.88e-01 | -0.1899 |
| Page: 1 2 3 4 5 6 |
| Tissue | Expression Dynamics | Abbreviation |
| Colorectum (GSE201348) | 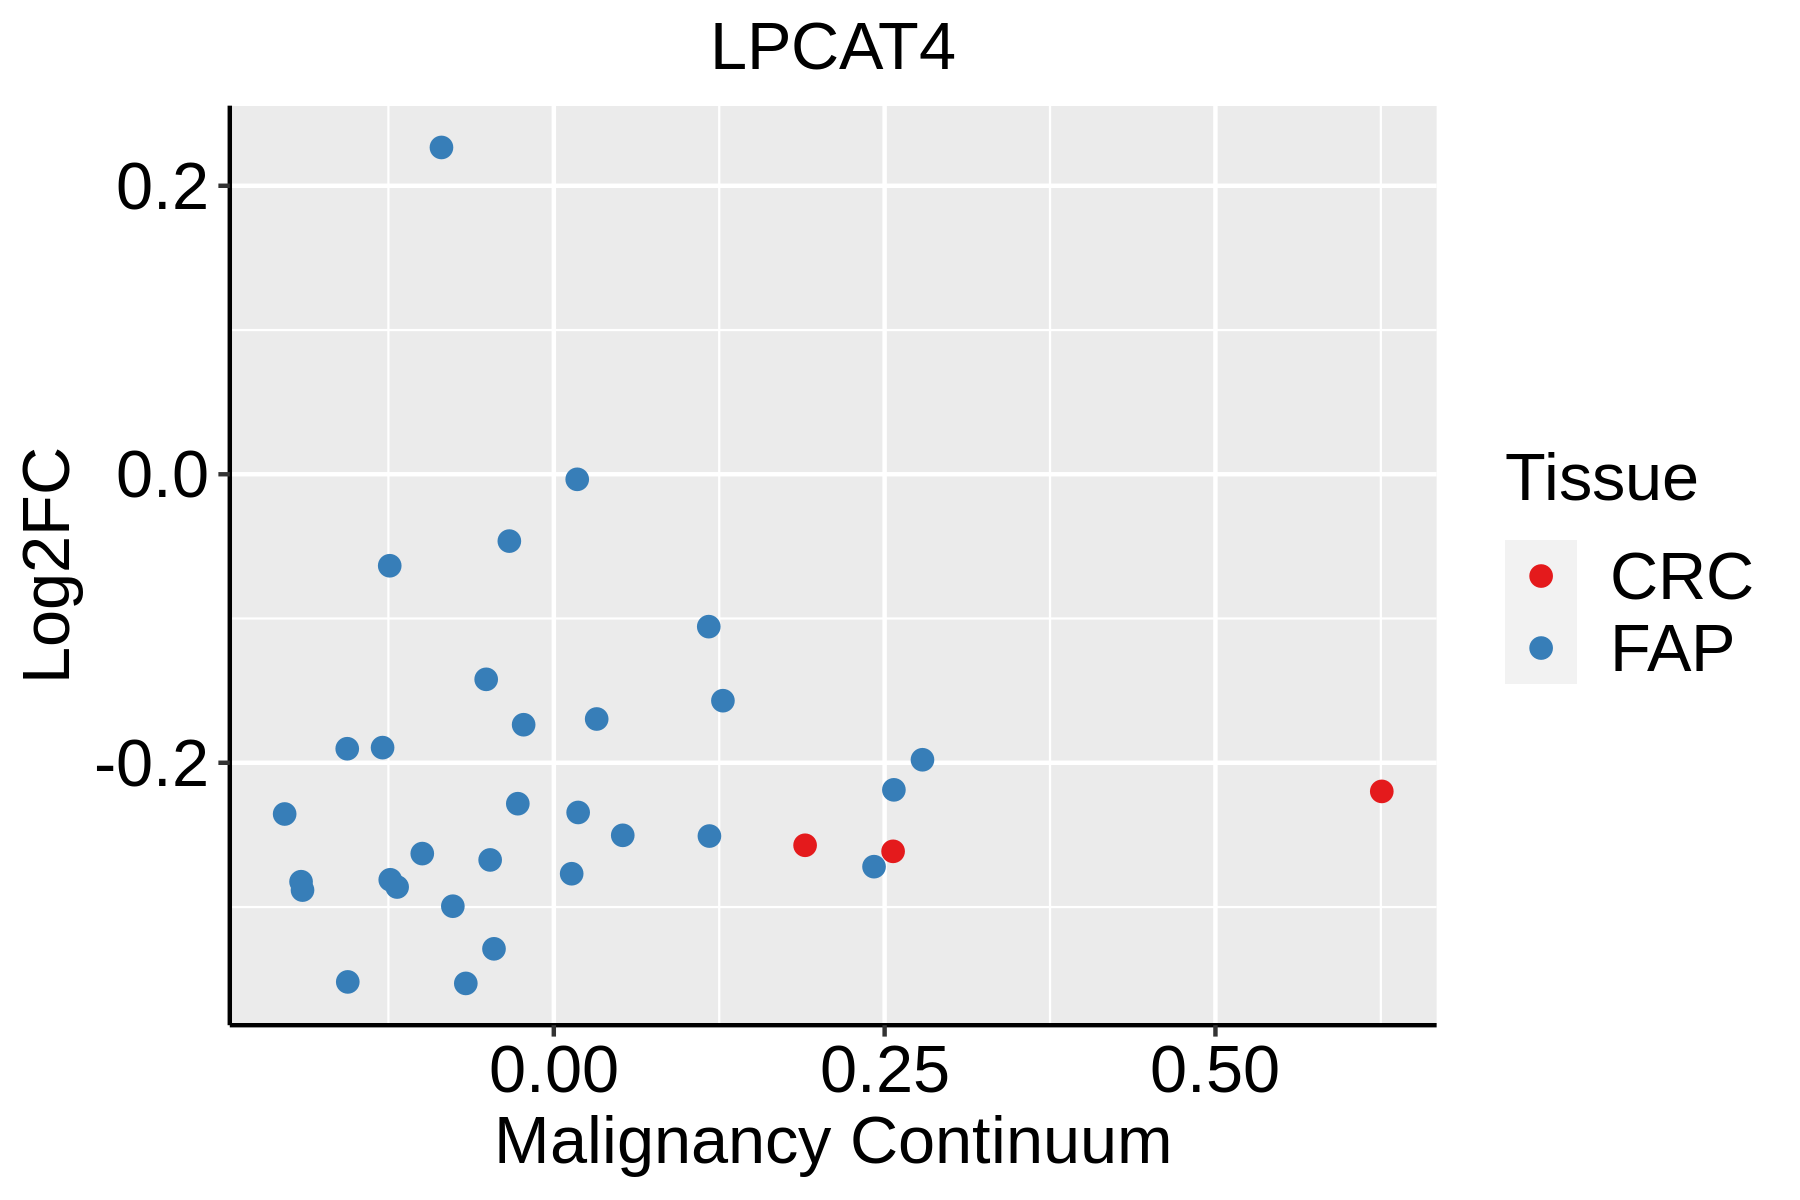 | FAP: Familial adenomatous polyposis |
| CRC: Colorectal cancer | ||
| Colorectum (HTA11) |  | AD: Adenomas |
| SER: Sessile serrated lesions | ||
| MSI-H: Microsatellite-high colorectal cancer | ||
| MSS: Microsatellite stable colorectal cancer | ||
| Esophagus |  | ESCC: Esophageal squamous cell carcinoma |
| HGIN: High-grade intraepithelial neoplasias | ||
| LGIN: Low-grade intraepithelial neoplasias | ||
| Liver |  | HCC: Hepatocellular carcinoma |
| NAFLD: Non-alcoholic fatty liver disease | ||
| Oral Cavity | 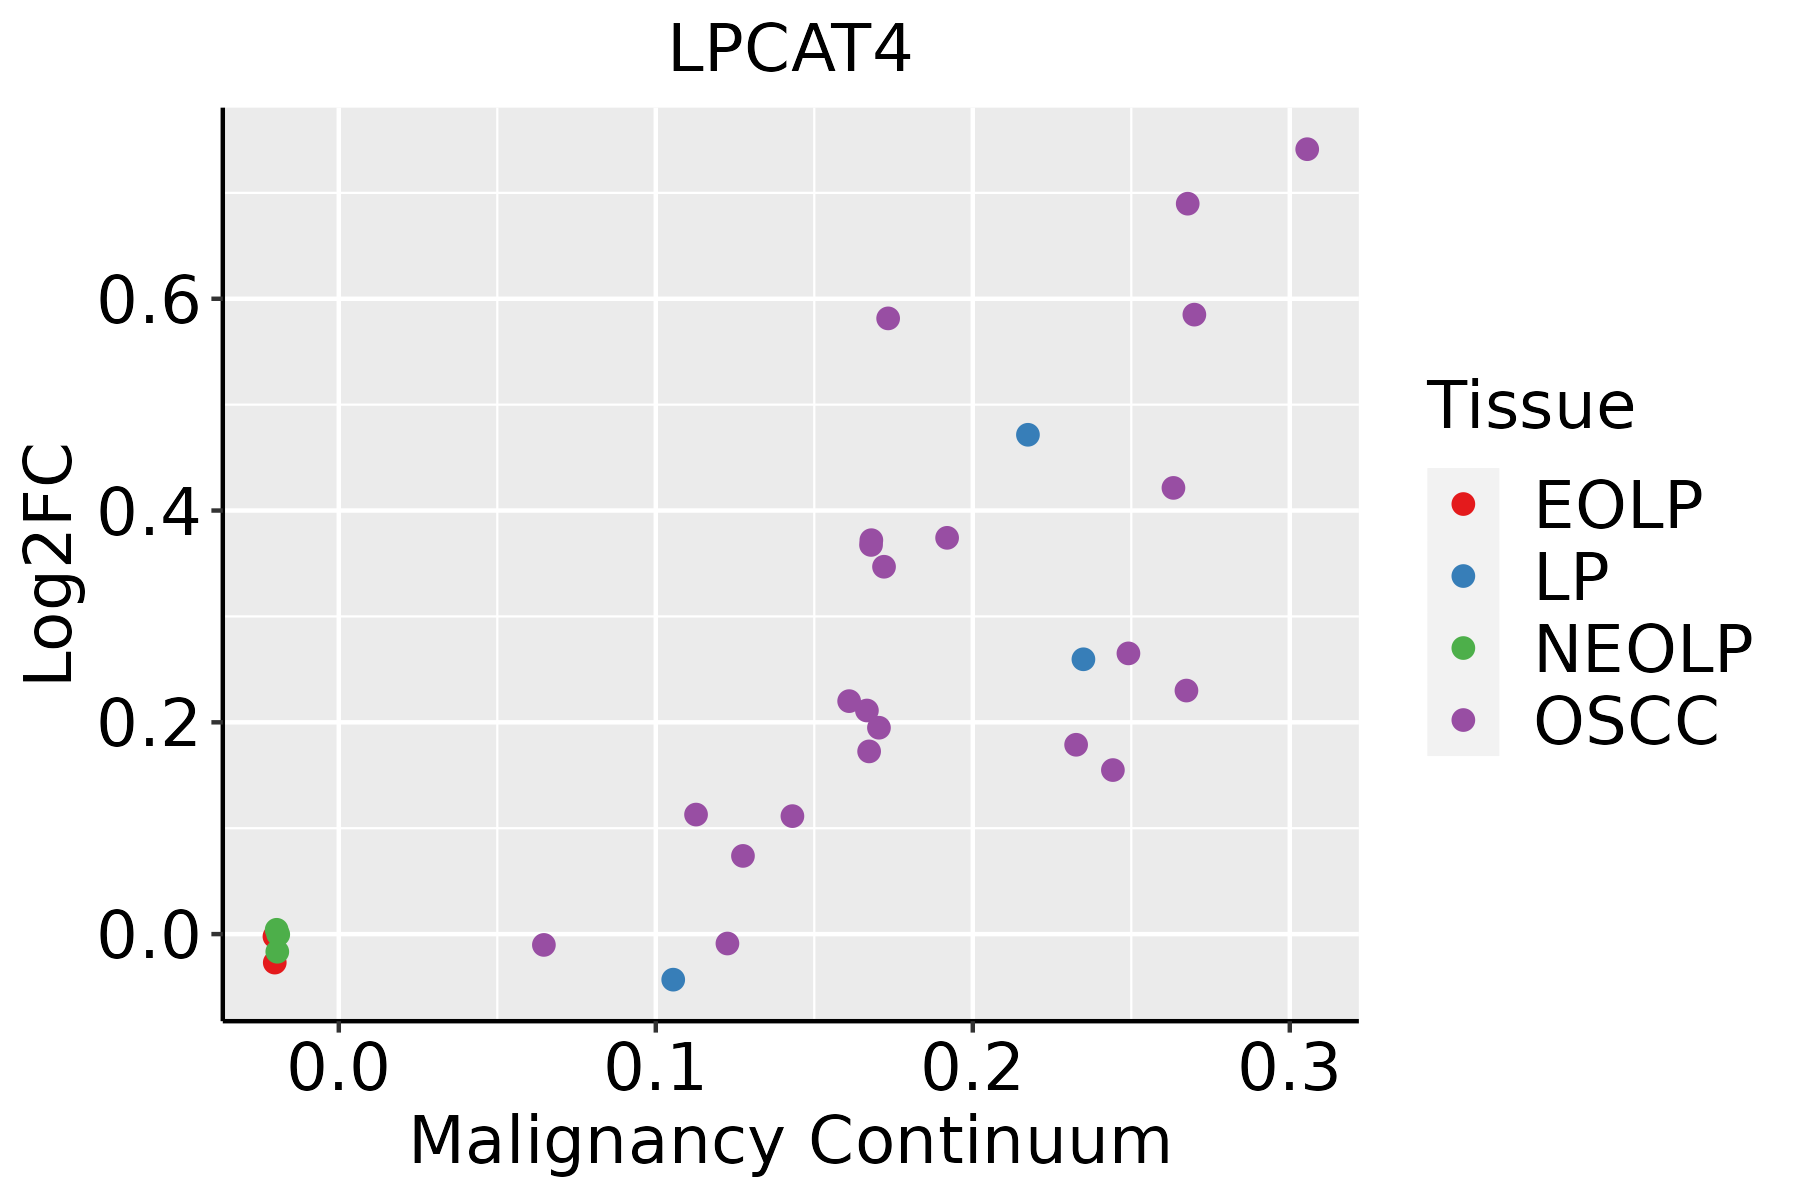 | EOLP: Erosive Oral lichen planus |
| LP: leukoplakia | ||
| NEOLP: Non-erosive oral lichen planus | ||
| OSCC: Oral squamous cell carcinoma |
| ∗log2FC in expression of this searched gene in stem-like cells from each diseased tissue sample relative to stem-like cells in normal samples in each tissue plotted against the malignancy continuum. Samples are colored based on if they are from different disease stage. |
Top |
Malignant transformation related pathway analysis |
| Find out the enriched GO biological processes and KEGG pathways involved in transition from healthy to precancer to cancer |
| Tissue | Disease Stage | Enriched GO biological Processes |
| Colorectum | AD |  |
| Colorectum | SER |  |
| Colorectum | MSS |  |
| Colorectum | MSI-H |  |
| Colorectum | FAP |  |
| ∗Top 15 enriched GO BP terms are showed in the bar plot of each disease state in each tissue. Each row represents a significant GO biological process which is colored according to the -log10(p.adjust). |
| Page: 1 2 3 4 5 6 7 8 9 |
| GO ID | Tissue | Disease Stage | Description | Gene Ratio | Bg Ratio | pvalue | p.adjust | Count |
| GO:0006575 | Colorectum | AD | cellular modified amino acid metabolic process | 59/3918 | 188/18723 | 4.80e-04 | 5.27e-03 | 59 |
| GO:0006650 | Colorectum | AD | glycerophospholipid metabolic process | 83/3918 | 306/18723 | 5.40e-03 | 3.55e-02 | 83 |
| GO:0006644 | Colorectum | AD | phospholipid metabolic process | 101/3918 | 383/18723 | 5.80e-03 | 3.67e-02 | 101 |
| GO:0045017 | Colorectum | AD | glycerolipid biosynthetic process | 69/3918 | 252/18723 | 8.33e-03 | 4.88e-02 | 69 |
| GO:0046486 | Colorectum | SER | glycerolipid metabolic process | 82/2897 | 392/18723 | 2.26e-03 | 2.17e-02 | 82 |
| GO:00066441 | Colorectum | SER | phospholipid metabolic process | 79/2897 | 383/18723 | 3.94e-03 | 3.24e-02 | 79 |
| GO:00450171 | Colorectum | SER | glycerolipid biosynthetic process | 55/2897 | 252/18723 | 4.47e-03 | 3.56e-02 | 55 |
| GO:00066501 | Colorectum | SER | glycerophospholipid metabolic process | 64/2897 | 306/18723 | 6.41e-03 | 4.60e-02 | 64 |
| GO:0008654 | Colorectum | FAP | phospholipid biosynthetic process | 54/2622 | 253/18723 | 8.88e-04 | 9.08e-03 | 54 |
| GO:00066502 | Colorectum | FAP | glycerophospholipid metabolic process | 62/2622 | 306/18723 | 1.54e-03 | 1.38e-02 | 62 |
| GO:00066442 | Colorectum | FAP | phospholipid metabolic process | 74/2622 | 383/18723 | 2.24e-03 | 1.83e-02 | 74 |
| GO:0046473 | Colorectum | FAP | phosphatidic acid metabolic process | 12/2622 | 37/18723 | 3.43e-03 | 2.48e-02 | 12 |
| GO:0046474 | Colorectum | FAP | glycerophospholipid biosynthetic process | 44/2622 | 211/18723 | 3.98e-03 | 2.76e-02 | 44 |
| GO:0006658 | Colorectum | FAP | phosphatidylserine metabolic process | 9/2622 | 25/18723 | 5.01e-03 | 3.33e-02 | 9 |
| GO:00450172 | Colorectum | FAP | glycerolipid biosynthetic process | 50/2622 | 252/18723 | 6.32e-03 | 3.95e-02 | 50 |
| GO:00086541 | Colorectum | CRC | phospholipid biosynthetic process | 49/2078 | 253/18723 | 7.07e-05 | 1.51e-03 | 49 |
| GO:00066503 | Colorectum | CRC | glycerophospholipid metabolic process | 55/2078 | 306/18723 | 2.10e-04 | 3.55e-03 | 55 |
| GO:00450173 | Colorectum | CRC | glycerolipid biosynthetic process | 47/2078 | 252/18723 | 2.47e-04 | 4.06e-03 | 47 |
| GO:00066443 | Colorectum | CRC | phospholipid metabolic process | 65/2078 | 383/18723 | 3.21e-04 | 4.95e-03 | 65 |
| GO:00464741 | Colorectum | CRC | glycerophospholipid biosynthetic process | 40/2078 | 211/18723 | 4.91e-04 | 7.02e-03 | 40 |
| Page: 1 2 3 |
| Pathway ID | Tissue | Disease Stage | Description | Gene Ratio | Bg Ratio | pvalue | p.adjust | qvalue | Count |
| Page: 1 |
Top |
Cell-cell communication analysis |
| Identification of potential cell-cell interactions between two cell types and their ligand-receptor pairs for different disease states |
| Ligand | Receptor | LRpair | Pathway | Tissue | Disease Stage |
| Page: 1 |
Top |
Single-cell gene regulatory network inference analysis |
| Find out the significant the regulons (TFs) and the target genes of each regulon across cell types for different disease states |
| TF | Cell Type | Tissue | Disease Stage | Target Gene | RSS | Regulon Activity |
| ∗The dot plots of a searched regulon are shown for all cell subpopulations in each disease state of each tissue based on the regulon specific score inferred using pySCENIC and by calculating the average expression. |
| Page: 1 |
Top |
Somatic mutation of malignant transformation related genes |
| Annotation of somatic variants for genes involved in malignant transformation |
| Hugo Symbol | Variant Class | Variant Classification | dbSNP RS | HGVSc | HGVSp | HGVSp Short | SWISSPROT | BIOTYPE | SIFT | PolyPhen | Tumor Sample Barcode | Tissue | Histology | Sex | Age | Stage | Therapy Types | Drugs | Outcome |
| LPCAT4 | SNV | Missense_Mutation | c.877N>G | p.Met293Val | p.M293V | Q643R3 | protein_coding | deleterious(0) | probably_damaging(0.98) | TCGA-BH-A18G-01 | Breast | breast invasive carcinoma | Female | >=65 | I/II | Unknown | Unknown | SD | |
| LPCAT4 | deletion | Frame_Shift_Del | c.169delN | p.Val57SerfsTer38 | p.V57Sfs*38 | Q643R3 | protein_coding | TCGA-D8-A27V-01 | Breast | breast invasive carcinoma | Female | <65 | I/II | Hormone Therapy | tamoxiphen | SD | |||
| LPCAT4 | SNV | Missense_Mutation | rs764269629 | c.664N>A | p.Ala222Thr | p.A222T | Q643R3 | protein_coding | deleterious(0.03) | possibly_damaging(0.7) | TCGA-2W-A8YY-01 | Cervix | cervical & endocervical cancer | Female | <65 | I/II | Chemotherapy | cisplatin | CR |
| LPCAT4 | SNV | Missense_Mutation | c.562N>T | p.Arg188Trp | p.R188W | Q643R3 | protein_coding | deleterious(0) | probably_damaging(1) | TCGA-MA-AA41-01 | Cervix | cervical & endocervical cancer | Female | <65 | I/II | Unknown | Unknown | SD | |
| LPCAT4 | SNV | Missense_Mutation | c.967N>C | p.Glu323Gln | p.E323Q | Q643R3 | protein_coding | deleterious(0) | probably_damaging(0.922) | TCGA-MY-A913-01 | Cervix | cervical & endocervical cancer | Female | <65 | I/II | Chemotherapy | cisplatin | CR | |
| LPCAT4 | SNV | Missense_Mutation | novel | c.328C>T | p.Arg110Cys | p.R110C | Q643R3 | protein_coding | deleterious(0) | probably_damaging(0.989) | TCGA-AA-A010-01 | Colorectum | colon adenocarcinoma | Female | <65 | I/II | Chemotherapy | folinic | CR |
| LPCAT4 | SNV | Missense_Mutation | c.523N>T | p.Pro175Ser | p.P175S | Q643R3 | protein_coding | deleterious(0) | probably_damaging(0.994) | TCGA-AD-5900-01 | Colorectum | colon adenocarcinoma | Male | >=65 | I/II | Unknown | Unknown | SD | |
| LPCAT4 | SNV | Missense_Mutation | c.380C>T | p.Ala127Val | p.A127V | Q643R3 | protein_coding | deleterious(0) | probably_damaging(0.999) | TCGA-AD-6964-01 | Colorectum | colon adenocarcinoma | Male | <65 | III/IV | Chemotherapy | folfox | PD | |
| LPCAT4 | SNV | Missense_Mutation | c.50G>A | p.Gly17Glu | p.G17E | Q643R3 | protein_coding | tolerated_low_confidence(0.58) | benign(0.001) | TCGA-CK-4951-01 | Colorectum | colon adenocarcinoma | Female | >=65 | I/II | Unknown | Unknown | PD | |
| LPCAT4 | SNV | Missense_Mutation | rs527812170 | c.1228N>T | p.Arg410Cys | p.R410C | Q643R3 | protein_coding | tolerated(0.08) | benign(0) | TCGA-F5-6814-01 | Colorectum | rectum adenocarcinoma | Male | <65 | I/II | Unknown | Unknown | SD |
| Page: 1 2 3 4 5 |
Top |
Related drugs of malignant transformation related genes |
| Identification of chemicals and drugs interact with genes involved in malignant transfromation |
| (DGIdb 4.0) |
| Entrez ID | Symbol | Category | Interaction Types | Drug Claim Name | Drug Name | PMIDs |
| Page: 1 |

Copyright 2023-Present -The University of Texas Health Science Center at Houston |