
|
|||||
|
 | |
| |
| |
| |
| |
| |
|
Gene: LPCAT3 |
Gene summary for LPCAT3 |
| Gene information | Species | Human | Gene symbol | LPCAT3 | Gene ID | 10162 |
| Gene name | lysophosphatidylcholine acyltransferase 3 | |
| Gene Alias | C3F | |
| Cytomap | 12p13.31 | |
| Gene Type | protein-coding | GO ID | GO:0003008 | UniProtAcc | Q6P1A2 |
Top |
Malignant transformation analysis |
| Identification of the aberrant gene expression in precancerous and cancerous lesions by comparing the gene expression of stem-like cells in diseased tissues with normal stem cells |
| Entrez ID | Symbol | Replicates | Species | Organ | Tissue | Adj P-value | Log2FC | Malignancy |
| 10162 | LPCAT3 | CCI_2 | Human | Cervix | CC | 1.73e-10 | 1.11e+00 | 0.5249 |
| 10162 | LPCAT3 | CCI_3 | Human | Cervix | CC | 2.79e-14 | 1.01e+00 | 0.516 |
| 10162 | LPCAT3 | sample3 | Human | Cervix | CC | 1.71e-03 | 1.56e-01 | 0.1387 |
| 10162 | LPCAT3 | T3 | Human | Cervix | CC | 9.25e-03 | 1.54e-01 | 0.1389 |
| 10162 | LPCAT3 | HTA11_3410_2000001011 | Human | Colorectum | AD | 1.80e-26 | -6.74e-01 | 0.0155 |
| 10162 | LPCAT3 | HTA11_2487_2000001011 | Human | Colorectum | SER | 1.02e-15 | -6.74e-01 | -0.1808 |
| 10162 | LPCAT3 | HTA11_2951_2000001011 | Human | Colorectum | AD | 3.65e-03 | -6.74e-01 | 0.0216 |
| 10162 | LPCAT3 | HTA11_1938_2000001011 | Human | Colorectum | AD | 6.51e-12 | -6.74e-01 | -0.0811 |
| 10162 | LPCAT3 | HTA11_78_2000001011 | Human | Colorectum | AD | 6.05e-16 | -6.66e-01 | -0.1088 |
| 10162 | LPCAT3 | HTA11_347_2000001011 | Human | Colorectum | AD | 1.76e-24 | -6.64e-01 | -0.1954 |
| 10162 | LPCAT3 | HTA11_2112_2000001011 | Human | Colorectum | SER | 1.42e-02 | -6.74e-01 | -0.2196 |
| 10162 | LPCAT3 | HTA11_3361_2000001011 | Human | Colorectum | AD | 2.23e-12 | -6.74e-01 | -0.1207 |
| 10162 | LPCAT3 | HTA11_83_2000001011 | Human | Colorectum | SER | 7.22e-10 | -6.74e-01 | -0.1526 |
| 10162 | LPCAT3 | HTA11_696_2000001011 | Human | Colorectum | AD | 8.59e-39 | -6.70e-01 | -0.1464 |
| 10162 | LPCAT3 | HTA11_866_2000001011 | Human | Colorectum | AD | 2.11e-32 | -6.65e-01 | -0.1001 |
| 10162 | LPCAT3 | HTA11_1391_2000001011 | Human | Colorectum | AD | 7.12e-19 | -6.67e-01 | -0.059 |
| 10162 | LPCAT3 | HTA11_2992_2000001011 | Human | Colorectum | SER | 2.56e-04 | -6.74e-01 | -0.1706 |
| 10162 | LPCAT3 | HTA11_5212_2000001011 | Human | Colorectum | AD | 3.68e-05 | -6.74e-01 | -0.2061 |
| 10162 | LPCAT3 | HTA11_5216_2000001011 | Human | Colorectum | SER | 3.65e-03 | -6.74e-01 | -0.1462 |
| 10162 | LPCAT3 | HTA11_546_2000001011 | Human | Colorectum | AD | 1.73e-08 | -6.74e-01 | -0.0842 |
| Page: 1 2 3 4 5 6 7 8 9 |
| Tissue | Expression Dynamics | Abbreviation |
| Cervix | 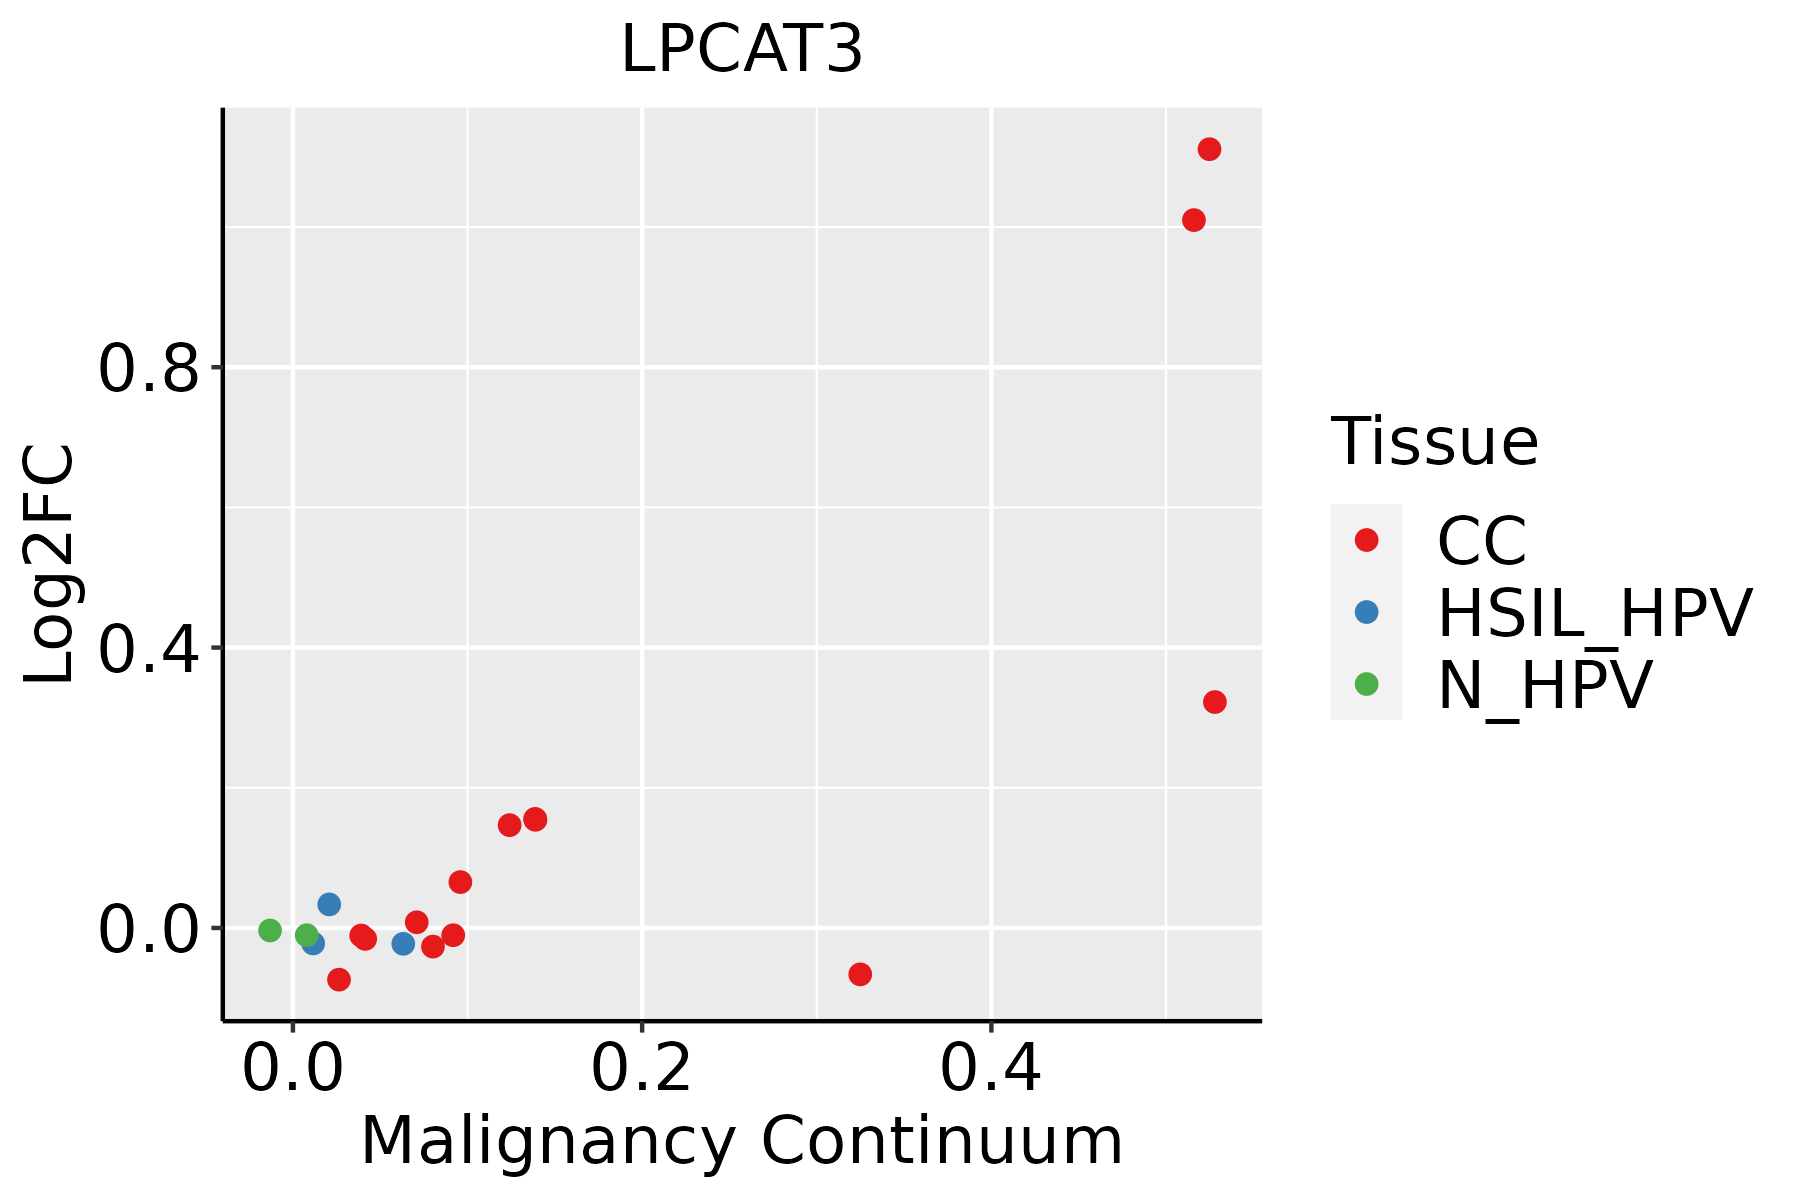 | CC: Cervix cancer |
| HSIL_HPV: HPV-infected high-grade squamous intraepithelial lesions | ||
| N_HPV: HPV-infected normal cervix | ||
| Colorectum (GSE201348) |  | FAP: Familial adenomatous polyposis |
| CRC: Colorectal cancer | ||
| Colorectum (HTA11) |  | AD: Adenomas |
| SER: Sessile serrated lesions | ||
| MSI-H: Microsatellite-high colorectal cancer | ||
| MSS: Microsatellite stable colorectal cancer | ||
| Esophagus | 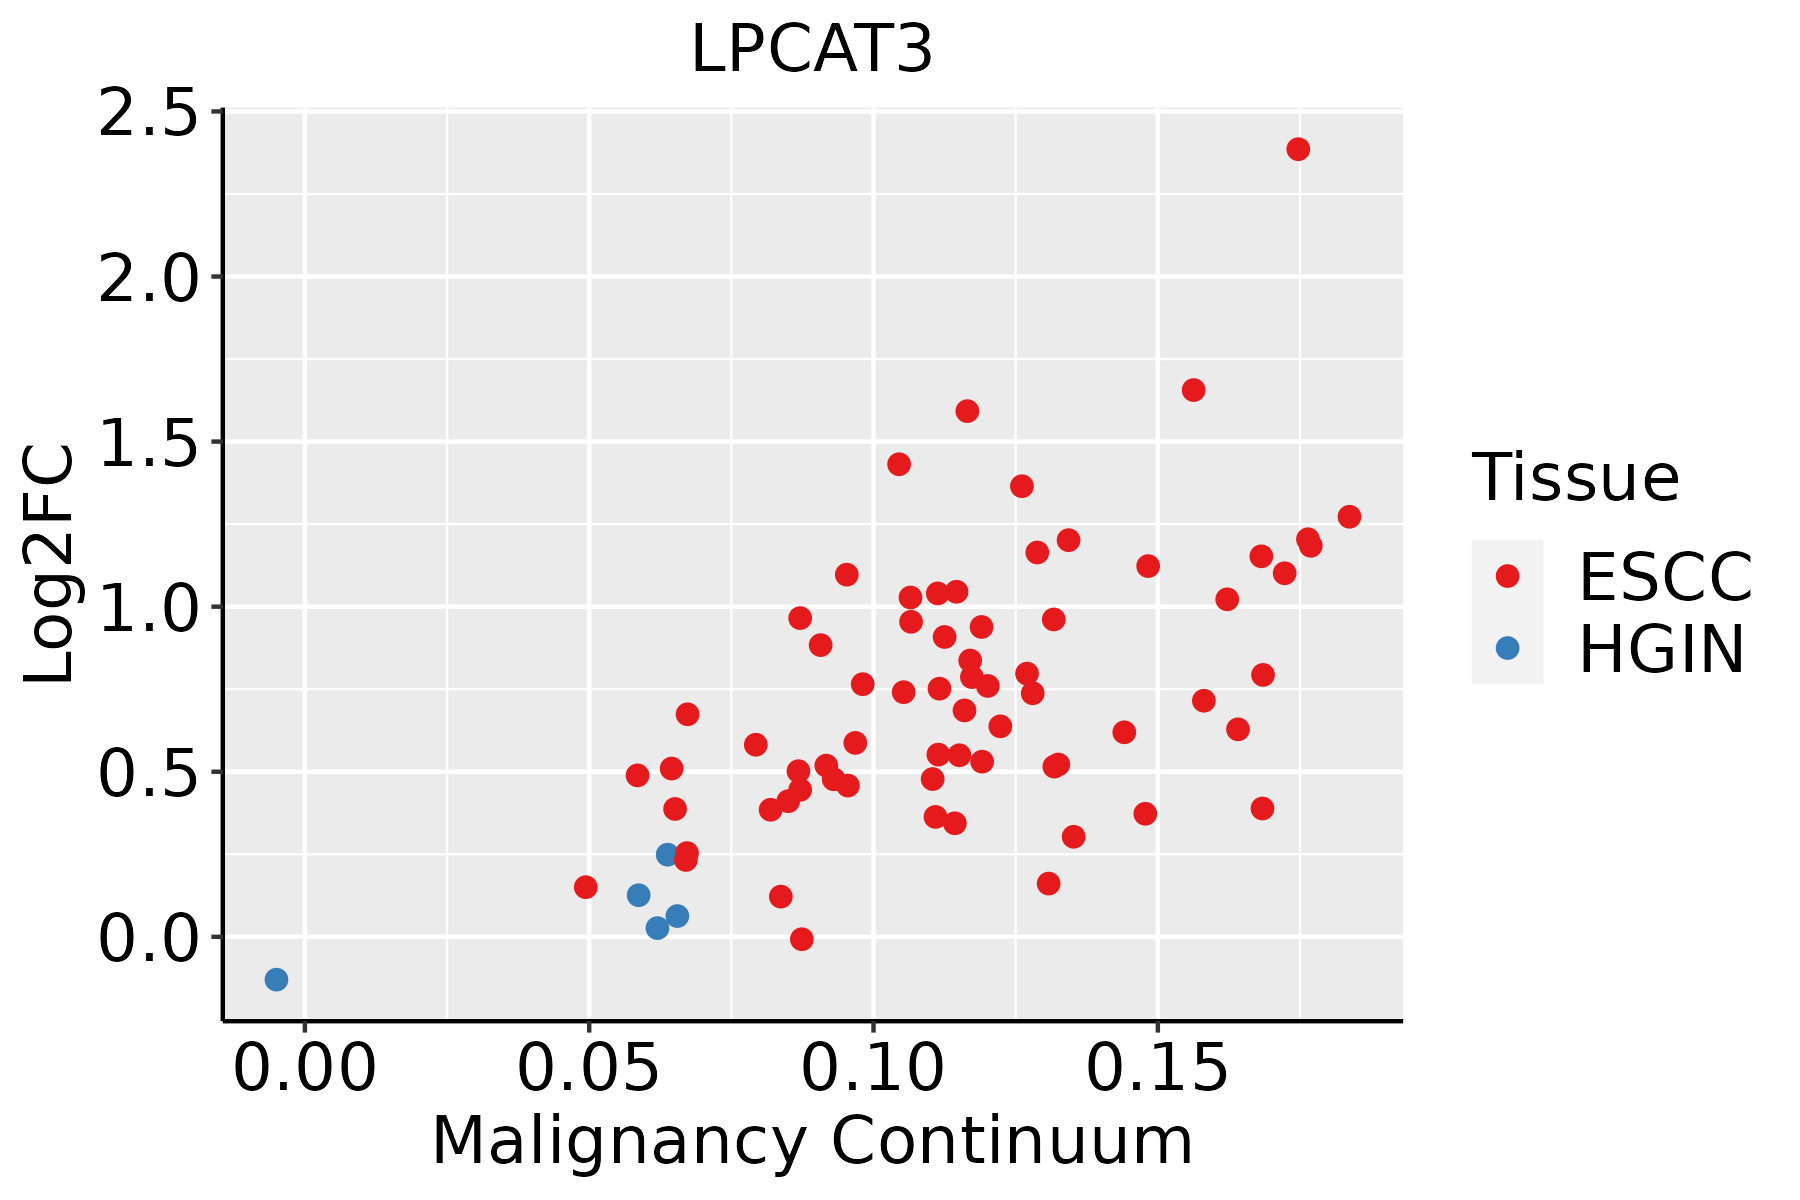 | ESCC: Esophageal squamous cell carcinoma |
| HGIN: High-grade intraepithelial neoplasias | ||
| LGIN: Low-grade intraepithelial neoplasias | ||
| Liver | 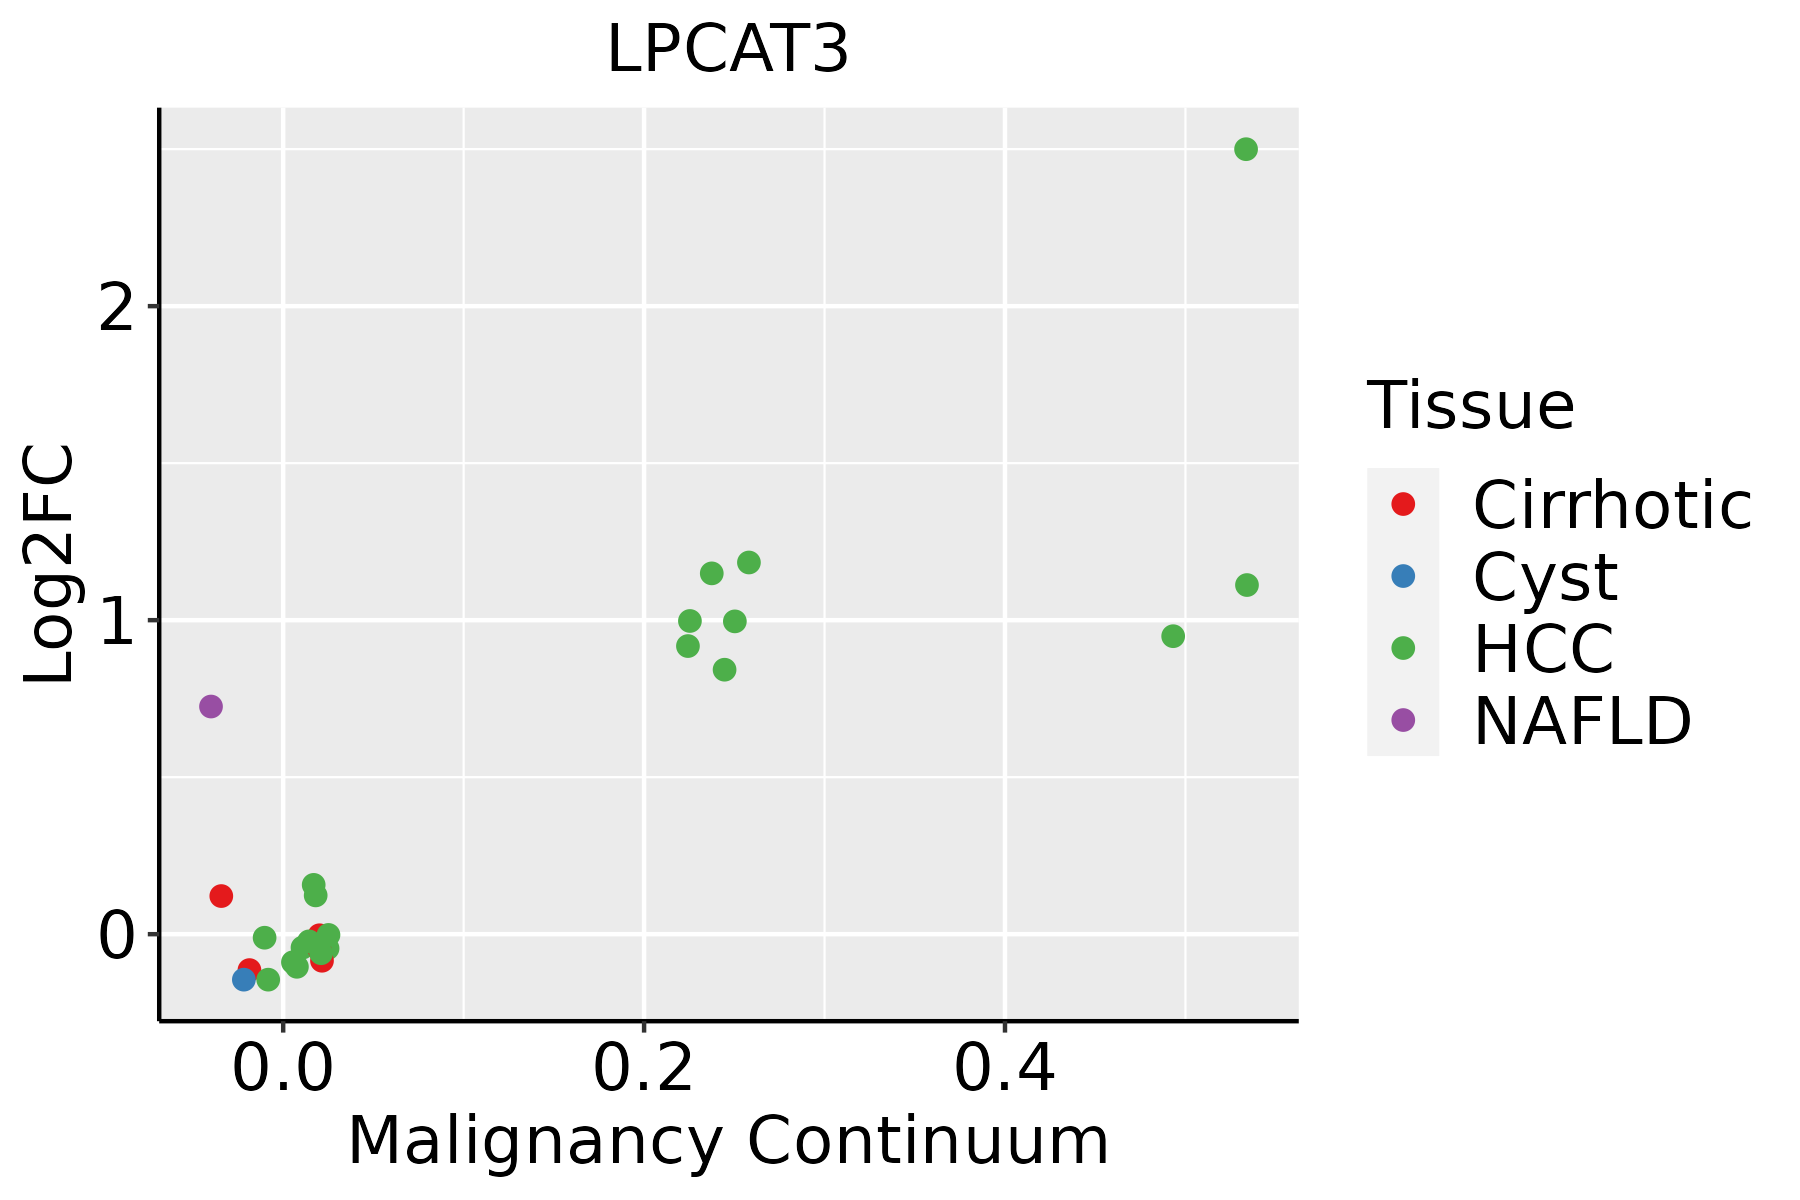 | HCC: Hepatocellular carcinoma |
| NAFLD: Non-alcoholic fatty liver disease | ||
| Oral Cavity |  | EOLP: Erosive Oral lichen planus |
| LP: leukoplakia | ||
| NEOLP: Non-erosive oral lichen planus | ||
| OSCC: Oral squamous cell carcinoma | ||
| Prostate | 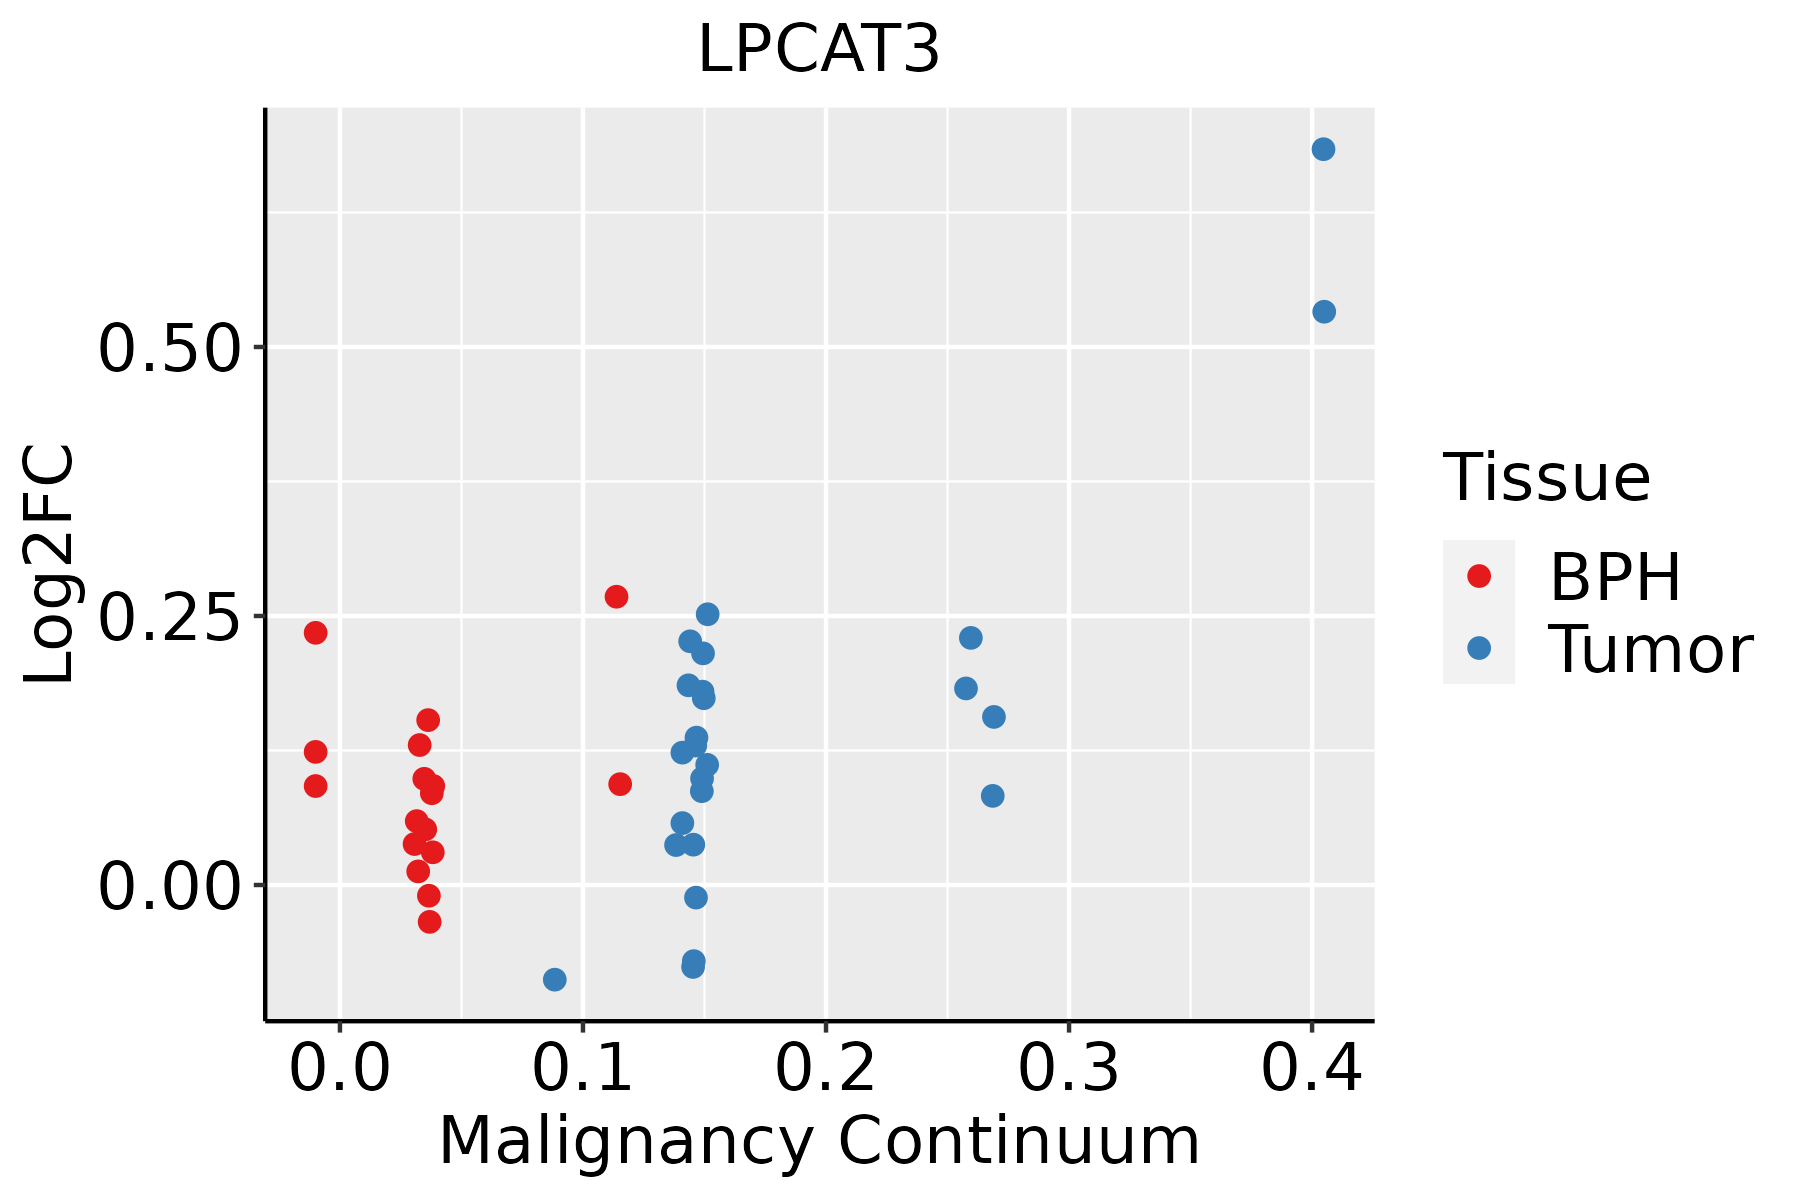 | BPH: Benign Prostatic Hyperplasia |
| Skin |  | AK: Actinic keratosis |
| cSCC: Cutaneous squamous cell carcinoma | ||
| SCCIS:squamous cell carcinoma in situ |
| ∗log2FC in expression of this searched gene in stem-like cells from each diseased tissue sample relative to stem-like cells in normal samples in each tissue plotted against the malignancy continuum. Samples are colored based on if they are from different disease stage. |
Top |
Malignant transformation related pathway analysis |
| Find out the enriched GO biological processes and KEGG pathways involved in transition from healthy to precancer to cancer |
| Tissue | Disease Stage | Enriched GO biological Processes |
| Colorectum | AD |  |
| Colorectum | SER |  |
| Colorectum | MSS |  |
| Colorectum | MSI-H |  |
| Colorectum | FAP |  |
| ∗Top 15 enriched GO BP terms are showed in the bar plot of each disease state in each tissue. Each row represents a significant GO biological process which is colored according to the -log10(p.adjust). |
| Page: 1 2 3 4 5 6 7 8 9 |
| GO ID | Tissue | Disease Stage | Description | Gene Ratio | Bg Ratio | pvalue | p.adjust | Count |
| GO:004586210 | Cervix | CC | positive regulation of proteolysis | 95/2311 | 372/18723 | 1.84e-12 | 6.86e-10 | 95 |
| GO:190589710 | Cervix | CC | regulation of response to endoplasmic reticulum stress | 27/2311 | 82/18723 | 9.24e-07 | 3.25e-05 | 27 |
| GO:004887210 | Cervix | CC | homeostasis of number of cells | 61/2311 | 272/18723 | 2.17e-06 | 6.55e-05 | 61 |
| GO:003497610 | Cervix | CC | response to endoplasmic reticulum stress | 57/2311 | 256/18723 | 5.81e-06 | 1.42e-04 | 57 |
| GO:190357310 | Cervix | CC | negative regulation of response to endoplasmic reticulum stress | 17/2311 | 44/18723 | 8.57e-06 | 1.97e-04 | 17 |
| GO:00507273 | Cervix | CC | regulation of inflammatory response | 75/2311 | 386/18723 | 3.95e-05 | 6.18e-04 | 75 |
| GO:00069846 | Cervix | CC | ER-nucleus signaling pathway | 16/2311 | 46/18723 | 7.12e-05 | 9.90e-04 | 16 |
| GO:00516048 | Cervix | CC | protein maturation | 56/2311 | 294/18723 | 5.90e-04 | 5.59e-03 | 56 |
| GO:00321022 | Cervix | CC | negative regulation of response to external stimulus | 75/2311 | 420/18723 | 5.96e-04 | 5.61e-03 | 75 |
| GO:0031348 | Cervix | CC | negative regulation of defense response | 48/2311 | 258/18723 | 2.30e-03 | 1.65e-02 | 48 |
| GO:0045862 | Colorectum | AD | positive regulation of proteolysis | 129/3918 | 372/18723 | 4.04e-10 | 3.46e-08 | 129 |
| GO:0034976 | Colorectum | AD | response to endoplasmic reticulum stress | 90/3918 | 256/18723 | 8.48e-08 | 4.28e-06 | 90 |
| GO:0048872 | Colorectum | AD | homeostasis of number of cells | 87/3918 | 272/18723 | 1.16e-05 | 2.61e-04 | 87 |
| GO:0006066 | Colorectum | AD | alcohol metabolic process | 106/3918 | 353/18723 | 3.02e-05 | 5.57e-04 | 106 |
| GO:1905897 | Colorectum | AD | regulation of response to endoplasmic reticulum stress | 32/3918 | 82/18723 | 1.37e-04 | 1.95e-03 | 32 |
| GO:0006984 | Colorectum | AD | ER-nucleus signaling pathway | 21/3918 | 46/18723 | 1.47e-04 | 2.08e-03 | 21 |
| GO:0030258 | Colorectum | AD | lipid modification | 67/3918 | 212/18723 | 1.66e-04 | 2.27e-03 | 67 |
| GO:0006575 | Colorectum | AD | cellular modified amino acid metabolic process | 59/3918 | 188/18723 | 4.80e-04 | 5.27e-03 | 59 |
| GO:0051604 | Colorectum | AD | protein maturation | 85/3918 | 294/18723 | 6.73e-04 | 6.91e-03 | 85 |
| GO:0007029 | Colorectum | AD | endoplasmic reticulum organization | 31/3918 | 87/18723 | 1.08e-03 | 1.00e-02 | 31 |
| Page: 1 2 3 4 5 6 7 8 9 10 11 12 13 14 15 16 17 18 19 |
| Pathway ID | Tissue | Disease Stage | Description | Gene Ratio | Bg Ratio | pvalue | p.adjust | qvalue | Count |
| hsa04216 | Colorectum | AD | Ferroptosis | 21/2092 | 41/8465 | 2.23e-04 | 1.78e-03 | 1.13e-03 | 21 |
| hsa042161 | Colorectum | AD | Ferroptosis | 21/2092 | 41/8465 | 2.23e-04 | 1.78e-03 | 1.13e-03 | 21 |
| hsa042162 | Colorectum | MSS | Ferroptosis | 18/1875 | 41/8465 | 1.53e-03 | 8.53e-03 | 5.23e-03 | 18 |
| hsa042163 | Colorectum | MSS | Ferroptosis | 18/1875 | 41/8465 | 1.53e-03 | 8.53e-03 | 5.23e-03 | 18 |
| hsa042164 | Colorectum | FAP | Ferroptosis | 18/1404 | 41/8465 | 3.49e-05 | 3.65e-04 | 2.22e-04 | 18 |
| hsa042165 | Colorectum | FAP | Ferroptosis | 18/1404 | 41/8465 | 3.49e-05 | 3.65e-04 | 2.22e-04 | 18 |
| hsa0421628 | Esophagus | HGIN | Ferroptosis | 15/1383 | 41/8465 | 1.35e-03 | 1.26e-02 | 1.00e-02 | 15 |
| hsa04216111 | Esophagus | HGIN | Ferroptosis | 15/1383 | 41/8465 | 1.35e-03 | 1.26e-02 | 1.00e-02 | 15 |
| hsa0421629 | Esophagus | ESCC | Ferroptosis | 33/4205 | 41/8465 | 4.58e-05 | 1.99e-04 | 1.02e-04 | 33 |
| hsa0421638 | Esophagus | ESCC | Ferroptosis | 33/4205 | 41/8465 | 4.58e-05 | 1.99e-04 | 1.02e-04 | 33 |
| hsa042168 | Liver | NAFLD | Ferroptosis | 12/1043 | 41/8465 | 2.98e-03 | 2.96e-02 | 2.39e-02 | 12 |
| hsa0421611 | Liver | NAFLD | Ferroptosis | 12/1043 | 41/8465 | 2.98e-03 | 2.96e-02 | 2.39e-02 | 12 |
| hsa0421641 | Liver | HCC | Ferroptosis | 33/4020 | 41/8465 | 1.42e-05 | 9.88e-05 | 5.50e-05 | 33 |
| hsa0421651 | Liver | HCC | Ferroptosis | 33/4020 | 41/8465 | 1.42e-05 | 9.88e-05 | 5.50e-05 | 33 |
| hsa0421620 | Oral cavity | OSCC | Ferroptosis | 29/3704 | 41/8465 | 4.26e-04 | 1.30e-03 | 6.60e-04 | 29 |
| hsa04216110 | Oral cavity | OSCC | Ferroptosis | 29/3704 | 41/8465 | 4.26e-04 | 1.30e-03 | 6.60e-04 | 29 |
| hsa0421627 | Oral cavity | LP | Ferroptosis | 19/2418 | 41/8465 | 1.15e-02 | 3.91e-02 | 2.52e-02 | 19 |
| hsa0421637 | Oral cavity | LP | Ferroptosis | 19/2418 | 41/8465 | 1.15e-02 | 3.91e-02 | 2.52e-02 | 19 |
| hsa0421643 | Oral cavity | NEOLP | Ferroptosis | 14/1112 | 41/8465 | 4.69e-04 | 2.71e-03 | 1.71e-03 | 14 |
| hsa0421653 | Oral cavity | NEOLP | Ferroptosis | 14/1112 | 41/8465 | 4.69e-04 | 2.71e-03 | 1.71e-03 | 14 |
| Page: 1 2 |
Top |
Cell-cell communication analysis |
| Identification of potential cell-cell interactions between two cell types and their ligand-receptor pairs for different disease states |
| Ligand | Receptor | LRpair | Pathway | Tissue | Disease Stage |
| Page: 1 |
Top |
Single-cell gene regulatory network inference analysis |
| Find out the significant the regulons (TFs) and the target genes of each regulon across cell types for different disease states |
| TF | Cell Type | Tissue | Disease Stage | Target Gene | RSS | Regulon Activity |
| ∗The dot plots of a searched regulon are shown for all cell subpopulations in each disease state of each tissue based on the regulon specific score inferred using pySCENIC and by calculating the average expression. |
| Page: 1 |
Top |
Somatic mutation of malignant transformation related genes |
| Annotation of somatic variants for genes involved in malignant transformation |
| Hugo Symbol | Variant Class | Variant Classification | dbSNP RS | HGVSc | HGVSp | HGVSp Short | SWISSPROT | BIOTYPE | SIFT | PolyPhen | Tumor Sample Barcode | Tissue | Histology | Sex | Age | Stage | Therapy Types | Drugs | Outcome |
| LPCAT3 | SNV | Missense_Mutation | rs781889016 | c.1216A>C | p.Thr406Pro | p.T406P | Q6P1A2 | protein_coding | tolerated(0.35) | benign(0.305) | TCGA-A8-A07F-01 | Breast | breast invasive carcinoma | Female | >=65 | I/II | Hormone Therapy | tamoxiphen | SD |
| LPCAT3 | SNV | Missense_Mutation | novel | c.791N>G | p.His264Arg | p.H264R | Q6P1A2 | protein_coding | tolerated(0.93) | benign(0) | TCGA-AC-A3QQ-01 | Breast | breast invasive carcinoma | Female | <65 | I/II | Unknown | Unknown | SD |
| LPCAT3 | SNV | Missense_Mutation | rs781889016 | c.1216N>C | p.Thr406Pro | p.T406P | Q6P1A2 | protein_coding | tolerated(0.35) | benign(0.305) | TCGA-AO-A0JB-01 | Breast | breast invasive carcinoma | Female | <65 | III/IV | Chemotherapy | cyclophosphamide | SD |
| LPCAT3 | deletion | Frame_Shift_Del | c.915_958delNNNNNNNNNNNNNNNNNNNNNNNNNNNNNNNNNNNNNNNNNNNN | p.Phe305LeufsTer6 | p.F305Lfs*6 | Q6P1A2 | protein_coding | TCGA-A1-A0SO-01 | Breast | breast invasive carcinoma | Female | >=65 | I/II | Chemotherapy | SD | ||||
| LPCAT3 | SNV | Missense_Mutation | rs782146370 | c.1039N>T | p.Arg347Cys | p.R347C | Q6P1A2 | protein_coding | deleterious(0) | probably_damaging(0.991) | TCGA-2W-A8YY-01 | Cervix | cervical & endocervical cancer | Female | <65 | I/II | Chemotherapy | cisplatin | CR |
| LPCAT3 | SNV | Missense_Mutation | rs782213474 | c.908A>G | p.Asn303Ser | p.N303S | Q6P1A2 | protein_coding | tolerated(0.07) | benign(0.027) | TCGA-ZJ-A8QR-01 | Cervix | cervical & endocervical cancer | Female | <65 | I/II | Unknown | Unknown | SD |
| LPCAT3 | SNV | Missense_Mutation | c.902G>A | p.Gly301Asp | p.G301D | Q6P1A2 | protein_coding | deleterious(0.03) | probably_damaging(0.994) | TCGA-G4-6302-01 | Colorectum | colon adenocarcinoma | Female | >=65 | I/II | Unknown | Unknown | SD | |
| LPCAT3 | SNV | Missense_Mutation | c.530C>T | p.Ala177Val | p.A177V | Q6P1A2 | protein_coding | tolerated(0.06) | benign(0.076) | TCGA-G4-6628-01 | Colorectum | colon adenocarcinoma | Male | >=65 | I/II | Unknown | Unknown | SD | |
| LPCAT3 | SNV | Missense_Mutation | c.503C>G | p.Ser168Cys | p.S168C | Q6P1A2 | protein_coding | deleterious(0.04) | possibly_damaging(0.815) | TCGA-AG-3726-01 | Colorectum | rectum adenocarcinoma | Female | <65 | I/II | Unknown | Unknown | SD | |
| LPCAT3 | SNV | Missense_Mutation | novel | c.570C>A | p.Phe190Leu | p.F190L | Q6P1A2 | protein_coding | tolerated(0.07) | possibly_damaging(0.699) | TCGA-EI-6917-01 | Colorectum | rectum adenocarcinoma | Male | <65 | III/IV | Chemotherapy | 5fluorouracil+oxaciplatina+l-folinian | SD |
| Page: 1 2 3 4 5 |
Top |
Related drugs of malignant transformation related genes |
| Identification of chemicals and drugs interact with genes involved in malignant transfromation |
| (DGIdb 4.0) |
| Entrez ID | Symbol | Category | Interaction Types | Drug Claim Name | Drug Name | PMIDs |
| Page: 1 |

Copyright 2023-Present -The University of Texas Health Science Center at Houston |