Schematic overview of the cellular and molecular mechanisms involved in the cancer progression, including the proposed cellular and molecular mechanisms in cancer cells trajectory. AT1: alveolar type 1 cells; AT2: alveolar type 2 cells; AAH: atypical adenomatous hyperplasia; AIS: adenocarcinoma in situ; MIA: minimally invasive adenocarcinoma; IA: invasive adenocarcinoma; EMT: epithelial-mesenchymal transition

Home

Download

Statistics

Help

Contact

Center for Computational Systems Medicine
leaf

Gene summary

leaf

Malignant transformation analysis

leaf

Malignant transformation related pathway analysis

leaf

Cell-cell communication analysis

leaf

Single-cell gene regulatory network inference analysis

leaf

Somatic mutation of malignant transformation related genes

leaf

Related drugs of malignant transformation related genes

Gene: LPCAT2

Gene summary for LPCAT2

check button Gene summary.

Gene informationSpeciesHuman
Gene symbol

LPCAT2

Gene ID

54947

Gene namelysophosphatidylcholine acyltransferase 2
Gene AliasAGPAT11
Cytomap16q12.2
Gene Typeprotein-coding
GO ID

GO:0006629

UniProtAcc

Q7L5N7


Top

Malignant transformation analysis

check button Identification of the aberrant gene expression in precancerous and cancerous lesions by comparing the gene expression of stem-like cells in diseased tissues with normal stem cells
check button Malignant transformation involving gene list.
Entrez IDSymbolReplicatesSpeciesOrganTissueAdj P-valueLog2FCMalignancy
54947LPCAT2LZE4THumanEsophagusESCC3.25e-104.39e-010.0811
54947LPCAT2LZE7THumanEsophagusESCC1.66e-032.92e-010.0667
54947LPCAT2LZE8THumanEsophagusESCC2.67e-061.09e-010.067
54947LPCAT2LZE24THumanEsophagusESCC3.69e-134.32e-010.0596
54947LPCAT2LZE6THumanEsophagusESCC8.09e-051.28e-010.0845
54947LPCAT2P2T-EHumanEsophagusESCC1.43e-183.60e-010.1177
54947LPCAT2P4T-EHumanEsophagusESCC8.38e-133.57e-010.1323
54947LPCAT2P5T-EHumanEsophagusESCC8.89e-133.20e-010.1327
54947LPCAT2P8T-EHumanEsophagusESCC6.81e-252.08e-010.0889
54947LPCAT2P9T-EHumanEsophagusESCC8.22e-037.74e-020.1131
54947LPCAT2P10T-EHumanEsophagusESCC2.86e-153.14e-010.116
54947LPCAT2P11T-EHumanEsophagusESCC1.86e-104.47e-010.1426
54947LPCAT2P12T-EHumanEsophagusESCC1.19e-173.74e-010.1122
54947LPCAT2P15T-EHumanEsophagusESCC1.48e-113.57e-010.1149
54947LPCAT2P16T-EHumanEsophagusESCC2.96e-255.20e-010.1153
54947LPCAT2P17T-EHumanEsophagusESCC8.84e-052.95e-010.1278
54947LPCAT2P19T-EHumanEsophagusESCC3.04e-022.22e-010.1662
54947LPCAT2P20T-EHumanEsophagusESCC6.58e-163.04e-010.1124
54947LPCAT2P21T-EHumanEsophagusESCC1.36e-427.82e-010.1617
54947LPCAT2P22T-EHumanEsophagusESCC5.62e-131.61e-010.1236
Page: 1 2 3 4 5 6 

check button Transcriptomic changes along malignancy continuum.
TissueExpression DynamicsAbbreviation
EsophagusThe image shows the transcriptomic changes along malignancy continuum.log2FC in expression of this searched gene in stem-like cells from each diseased tissue sample relative to stem-like cells in normal samples in each tissue plotted against the malignancy continuum. Samples are colored based on if they are from different disease stage.ESCC: Esophageal squamous cell carcinoma
HGIN: High-grade intraepithelial neoplasias
LGIN: Low-grade intraepithelial neoplasias
LiverThe image shows the transcriptomic changes along malignancy continuum.log2FC in expression of this searched gene in stem-like cells from each diseased tissue sample relative to stem-like cells in normal samples in each tissue plotted against the malignancy continuum. Samples are colored based on if they are from different disease stage.HCC: Hepatocellular carcinoma
NAFLD: Non-alcoholic fatty liver disease
Oral CavityThe image shows the transcriptomic changes along malignancy continuum.log2FC in expression of this searched gene in stem-like cells from each diseased tissue sample relative to stem-like cells in normal samples in each tissue plotted against the malignancy continuum. Samples are colored based on if they are from different disease stage.
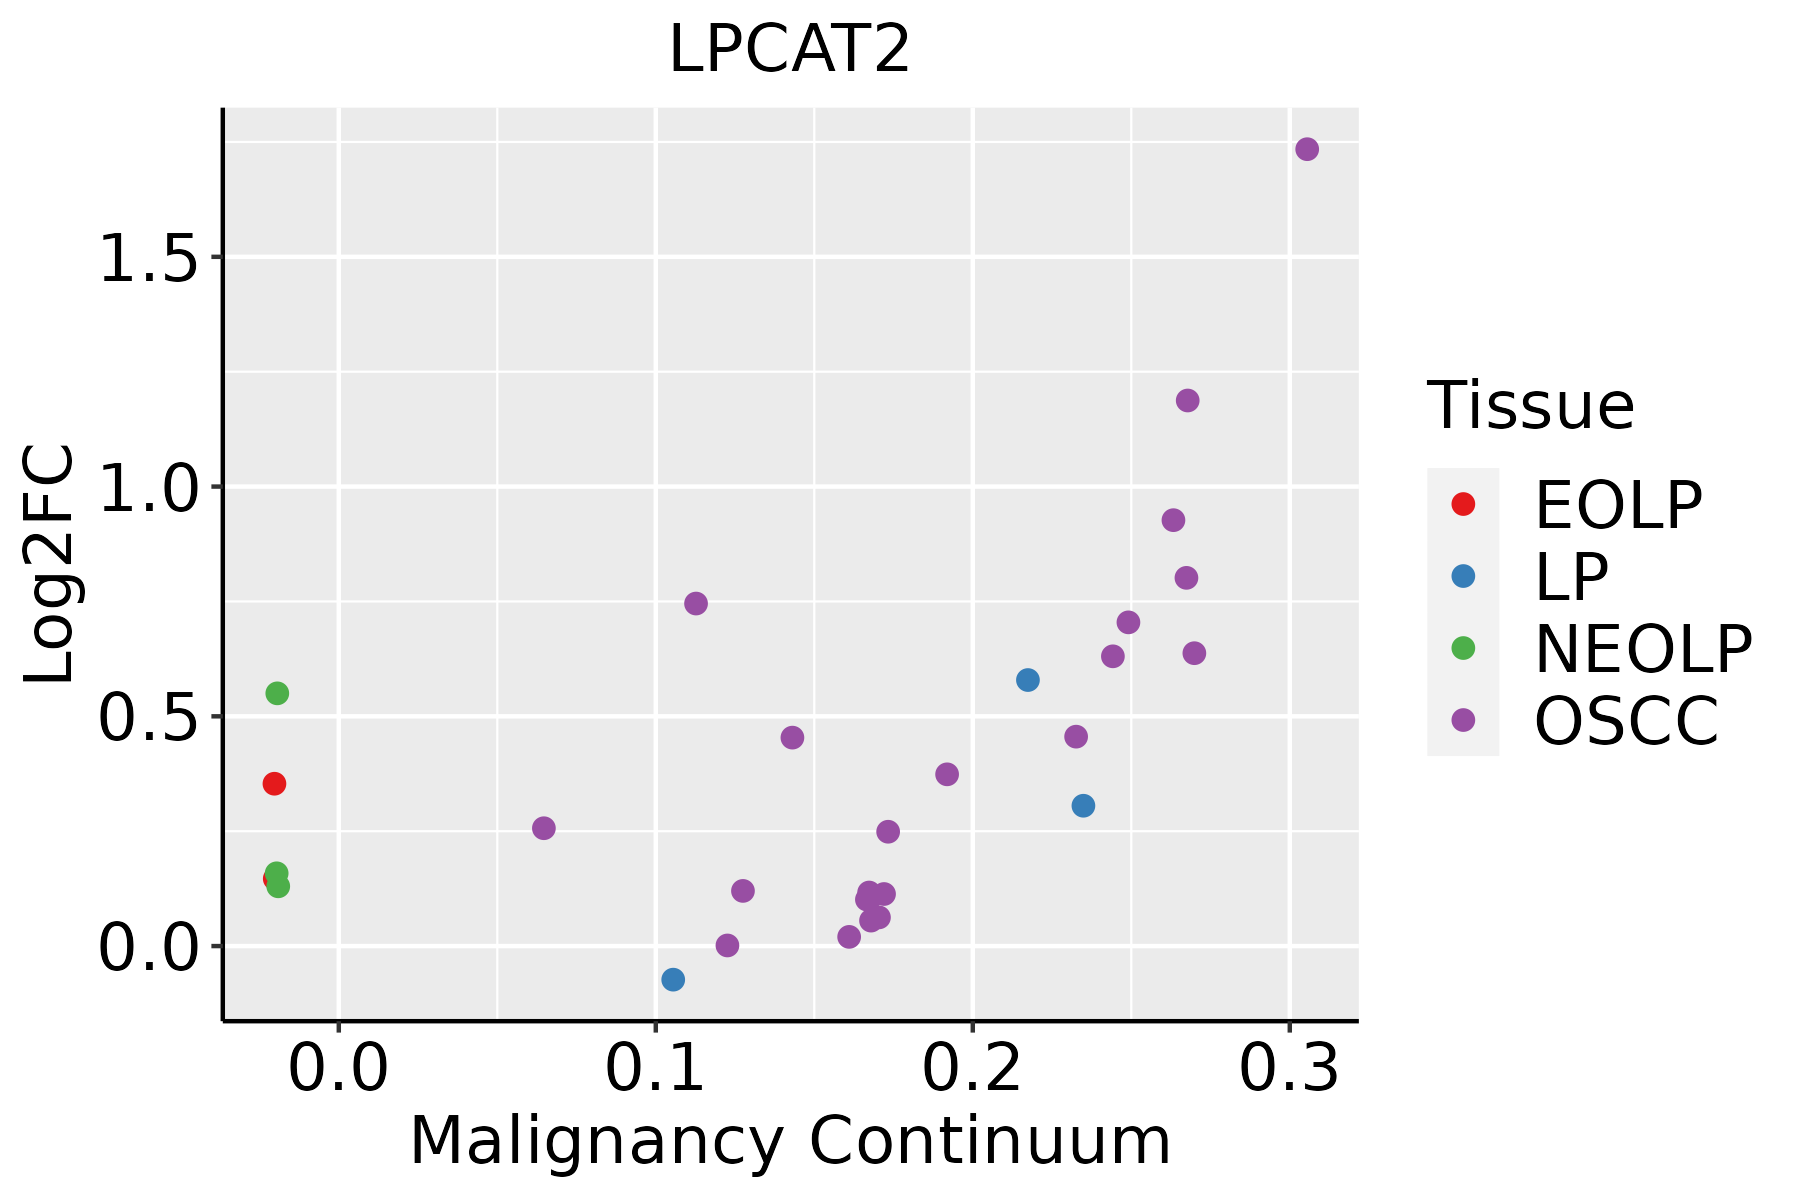
EOLP: Erosive Oral lichen planus
LP: leukoplakia
NEOLP: Non-erosive oral lichen planus
OSCC: Oral squamous cell carcinoma
SkinThe image shows the transcriptomic changes along malignancy continuum.log2FC in expression of this searched gene in stem-like cells from each diseased tissue sample relative to stem-like cells in normal samples in each tissue plotted against the malignancy continuum. Samples are colored based on if they are from different disease stage.AK: Actinic keratosis
cSCC: Cutaneous squamous cell carcinoma
SCCIS:squamous cell carcinoma in situ
ThyroidThe image shows the transcriptomic changes along malignancy continuum.log2FC in expression of this searched gene in stem-like cells from each diseased tissue sample relative to stem-like cells in normal samples in each tissue plotted against the malignancy continuum. Samples are colored based on if they are from different disease stage.
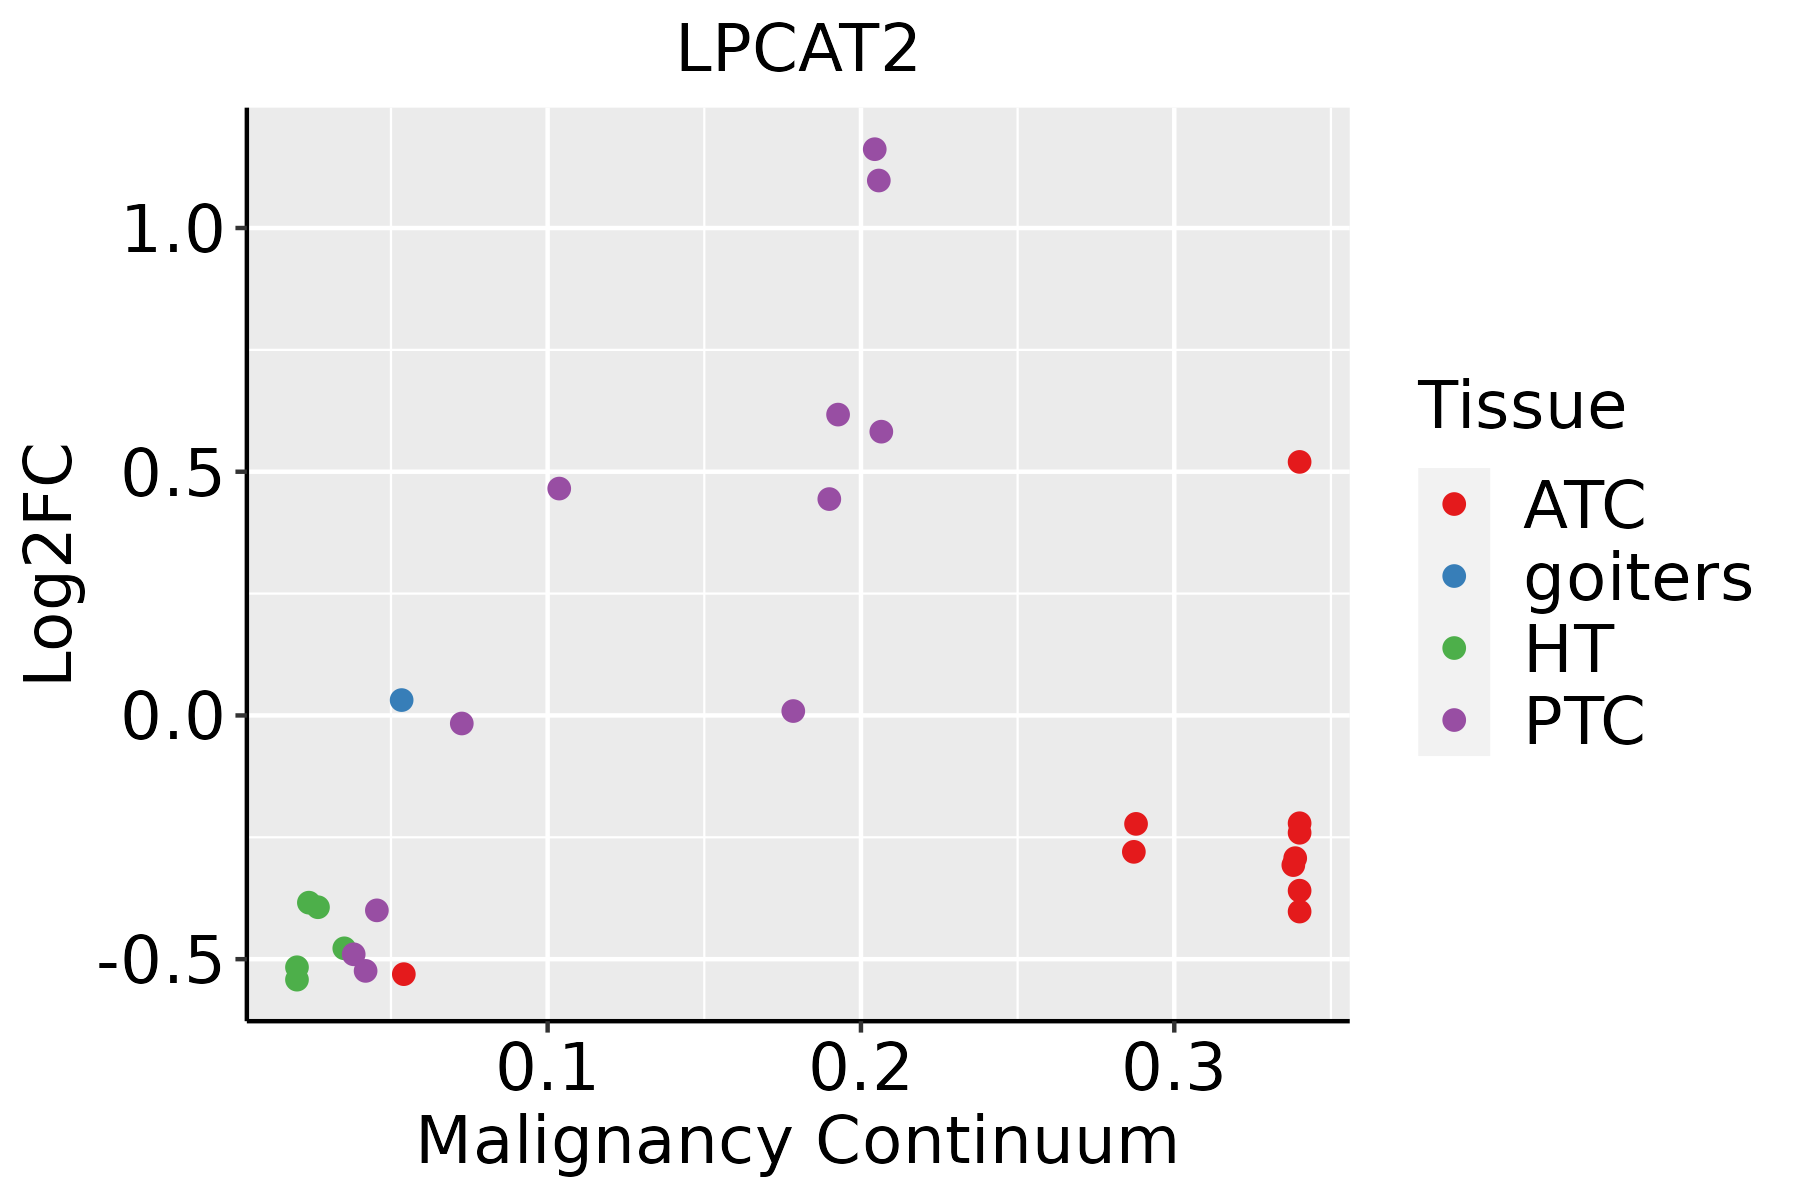
ATC: Anaplastic thyroid cancer
HT: Hashimoto's thyroiditis
PTC: Papillary thyroid cancer
∗log2FC in expression of this searched gene in stem-like cells from each diseased tissue sample relative to stem-like cells in normal samples in each tissue plotted against the malignancy continuum. Samples are colored based on if they are from different disease stage.

Top

Malignant transformation related pathway analysis

check buttonFind out the enriched GO biological processes and KEGG pathways involved in transition from healthy to precancer to cancer
check button Figure of enriched GO biological processes.
TissueDisease StageEnriched GO biological Processes
ColorectumADGO analysis - Figure of enriched GO biological processes: Top 15 enriched GO BP terms are showed in the bar plot of each disease state in each tissue. Each row represents a significant GO biological process which is colored according to the -log10(p.adjust).
ColorectumSERGO analysis - Figure of enriched GO biological processes: Top 15 enriched GO BP terms are showed in the bar plot of each disease state in each tissue. Each row represents a significant GO biological process which is colored according to the -log10(p.adjust).
ColorectumMSSGO analysis - Figure of enriched GO biological processes: Top 15 enriched GO BP terms are showed in the bar plot of each disease state in each tissue. Each row represents a significant GO biological process which is colored according to the -log10(p.adjust).
ColorectumMSI-HGO analysis - Figure of enriched GO biological processes: Top 15 enriched GO BP terms are showed in the bar plot of each disease state in each tissue. Each row represents a significant GO biological process which is colored according to the -log10(p.adjust).
ColorectumFAPGO analysis - Figure of enriched GO biological processes: Top 15 enriched GO BP terms are showed in the bar plot of each disease state in each tissue. Each row represents a significant GO biological process which is colored according to the -log10(p.adjust).
∗Top 15 enriched GO BP terms are showed in the bar plot of each disease state in each tissue. Each row represents a significant GO biological process which is colored according to the -log10(p.adjust).
Page: 1 2 3 4 5 6 7 8 9 

check button Enriched GO biological processes.
GO IDTissueDisease StageDescriptionGene RatioBg Ratiopvaluep.adjustCount
GO:00086544EsophagusESCCphospholipid biosynthetic process162/8552253/187232.59e-095.73e-08162
GO:00464744EsophagusESCCglycerophospholipid biosynthetic process135/8552211/187235.75e-081.02e-06135
GO:00450175EsophagusESCCglycerolipid biosynthetic process154/8552252/187235.20e-076.96e-06154
GO:00066446EsophagusESCCphospholipid metabolic process218/8552383/187235.37e-065.59e-05218
GO:00066505EsophagusESCCglycerophospholipid metabolic process174/8552306/187234.92e-053.85e-04174
GO:00464864EsophagusESCCglycerolipid metabolic process211/8552392/187236.51e-043.46e-03211
GO:00086542LiverHCCphospholipid biosynthetic process150/7958253/187234.77e-081.03e-06150
GO:00066444LiverHCCphospholipid metabolic process214/7958383/187237.25e-081.48e-06214
GO:004648611LiverHCCglycerolipid metabolic process215/7958392/187234.54e-077.49e-06215
GO:004501711LiverHCCglycerolipid biosynthetic process143/7958252/187233.27e-064.31e-05143
GO:00066504LiverHCCglycerophospholipid metabolic process168/7958306/187237.27e-068.62e-05168
GO:004647411LiverHCCglycerophospholipid biosynthetic process121/7958211/187239.12e-061.06e-04121
GO:0036151LiverHCCphosphatidylcholine acyl-chain remodeling11/795814/187236.81e-032.73e-0211
GO:00086543Oral cavityOSCCphospholipid biosynthetic process130/7305253/187233.96e-053.46e-04130
GO:00464743Oral cavityOSCCglycerophospholipid biosynthetic process102/7305211/187233.50e-031.48e-02102
GO:00066445Oral cavityOSCCphospholipid metabolic process175/7305383/187234.21e-031.71e-02175
GO:0008611Oral cavityLPether lipid biosynthetic process7/462311/187237.01e-033.96e-027
GO:0046504Oral cavityLPglycerol ether biosynthetic process7/462311/187237.01e-033.96e-027
GO:0097384Oral cavityLPcellular lipid biosynthetic process7/462311/187237.01e-033.96e-027
Page: 1 

check button Enriched KEGG pathways.
Pathway IDTissueDisease StageDescriptionGene RatioBg Ratiopvaluep.adjustqvalueCount
Page: 1 

Top

Cell-cell communication analysis

check buttonIdentification of potential cell-cell interactions between two cell types and their ligand-receptor pairs for different disease states
LigandReceptorLRpairPathwayTissueDisease Stage
Page: 1 

Top

Single-cell gene regulatory network inference analysis

check buttonFind out the significant the regulons (TFs) and the target genes of each regulon across cell types for different disease states
TFCell TypeTissueDisease StageTarget GeneRSSRegulon Activity
∗The dot plots of a searched regulon are shown for all cell subpopulations in each disease state of each tissue based on the regulon specific score inferred using pySCENIC and by calculating the average expression.
Page: 1 

Top

Somatic mutation of malignant transformation related genes

check buttonAnnotation of somatic variants for genes involved in malignant transformation
Hugo SymbolVariant ClassVariant ClassificationdbSNP RSHGVScHGVSpHGVSp ShortSWISSPROTBIOTYPESIFTPolyPhenTumor Sample BarcodeTissueHistologySexAgeStageTherapy TypesDrugsOutcome
LPCAT2SNVMissense_Mutationnovelc.514N>Ap.Val172Ilep.V172IQ7L5N7protein_codingtolerated(1)benign(0)TCGA-BH-A0HF-01Breastbreast invasive carcinomaFemale>=65I/IIHormone TherapyarimidexSD
LPCAT2SNVMissense_Mutationc.622T>Ap.Ser208Thrp.S208TQ7L5N7protein_codingdeleterious(0)possibly_damaging(0.802)TCGA-D8-A1XK-01Breastbreast invasive carcinomaFemale<65I/IIChemotherapydoxorubicine+cyclophosphamideSD
LPCAT2SNVMissense_Mutationc.930G>Tp.Met310Ilep.M310IQ7L5N7protein_codingdeleterious(0.01)possibly_damaging(0.496)TCGA-GM-A2DH-01Breastbreast invasive carcinomaFemale<65I/IIChemotherapytaxolCR
LPCAT2insertionFrame_Shift_Insnovelc.1292_1293insCTTCACTTCCACAAAGp.Glu431AspfsTer13p.E431Dfs*13Q7L5N7protein_codingTCGA-AN-A0FX-01Breastbreast invasive carcinomaFemale<65I/IIUnknownUnknownSD
LPCAT2deletionFrame_Shift_Delc.884delNp.Asn297MetfsTer13p.N297Mfs*13Q7L5N7protein_codingTCGA-BH-A0HA-01Breastbreast invasive carcinomaFemale<65I/IIUnknownUnknownSD
LPCAT2SNVMissense_Mutationrs569284862c.253G>Ap.Ala85Thrp.A85TQ7L5N7protein_codingtolerated(0.41)benign(0.001)TCGA-EA-A410-01Cervixcervical & endocervical cancerFemale<65I/IIUnknownUnknownSD
LPCAT2SNVMissense_Mutationrs762221312c.497N>Ap.Arg166Glnp.R166QQ7L5N7protein_codingdeleterious(0.01)possibly_damaging(0.497)TCGA-FU-A3HZ-01Cervixcervical & endocervical cancerFemale<65I/IIChemotherapycisplatinCR
LPCAT2SNVMissense_Mutationnovelc.1188N>Cp.Leu396Phep.L396FQ7L5N7protein_codingdeleterious(0.01)possibly_damaging(0.729)TCGA-JW-A5VL-01Cervixcervical & endocervical cancerFemale<65I/IIUnknownUnknownSD
LPCAT2SNVMissense_Mutationrs762221312c.497G>Ap.Arg166Glnp.R166QQ7L5N7protein_codingdeleterious(0.01)possibly_damaging(0.497)TCGA-AA-3984-01Colorectumcolon adenocarcinomaFemale<65I/IIUnknownUnknownSD
LPCAT2SNVMissense_Mutationnovelc.1055N>Cp.Lys352Thrp.K352TQ7L5N7protein_codingdeleterious(0.03)probably_damaging(0.985)TCGA-AZ-4315-01Colorectumcolon adenocarcinomaMale<65I/IIUnknownUnknownSD
Page: 1 2 3 4 5 6 

Top

Related drugs of malignant transformation related genes

check buttonIdentification of chemicals and drugs interact with genes involved in malignant transfromation
(DGIdb 4.0)
Entrez IDSymbolCategoryInteraction TypesDrug Claim NameDrug NamePMIDs
Page: 1