Schematic overview of the cellular and molecular mechanisms involved in the cancer progression, including the proposed cellular and molecular mechanisms in cancer cells trajectory. AT1: alveolar type 1 cells; AT2: alveolar type 2 cells; AAH: atypical adenomatous hyperplasia; AIS: adenocarcinoma in situ; MIA: minimally invasive adenocarcinoma; IA: invasive adenocarcinoma; EMT: epithelial-mesenchymal transition

Home

Download

Statistics

Help

Contact

Center for Computational Systems Medicine
leaf

Gene summary

leaf

Malignant transformation analysis

leaf

Malignant transformation related pathway analysis

leaf

Cell-cell communication analysis

leaf

Single-cell gene regulatory network inference analysis

leaf

Somatic mutation of malignant transformation related genes

leaf

Related drugs of malignant transformation related genes

Gene: LPCAT1

Gene summary for LPCAT1

check button Gene summary.

Gene informationSpeciesHuman
Gene symbol

LPCAT1

Gene ID

79888

Gene namelysophosphatidylcholine acyltransferase 1
Gene AliasAGPAT10
Cytomap5p15.33
Gene Typeprotein-coding
GO ID

GO:0001654

UniProtAcc

Q8NF37


Top

Malignant transformation analysis

check button Identification of the aberrant gene expression in precancerous and cancerous lesions by comparing the gene expression of stem-like cells in diseased tissues with normal stem cells
check button Malignant transformation involving gene list.
Entrez IDSymbolReplicatesSpeciesOrganTissueAdj P-valueLog2FCMalignancy
79888LPCAT1LZE24THumanEsophagusESCC2.12e-051.01e-010.0596
79888LPCAT1P2T-EHumanEsophagusESCC4.11e-152.70e-010.1177
79888LPCAT1P4T-EHumanEsophagusESCC2.06e-091.93e-010.1323
79888LPCAT1P5T-EHumanEsophagusESCC4.54e-143.12e-010.1327
79888LPCAT1P8T-EHumanEsophagusESCC1.99e-051.30e-010.0889
79888LPCAT1P9T-EHumanEsophagusESCC5.26e-071.85e-010.1131
79888LPCAT1P10T-EHumanEsophagusESCC1.29e-336.37e-010.116
79888LPCAT1P11T-EHumanEsophagusESCC1.57e-123.73e-010.1426
79888LPCAT1P12T-EHumanEsophagusESCC9.27e-122.82e-010.1122
79888LPCAT1P15T-EHumanEsophagusESCC4.00e-021.08e-010.1149
79888LPCAT1P16T-EHumanEsophagusESCC3.41e-071.56e-010.1153
79888LPCAT1P17T-EHumanEsophagusESCC3.87e-094.67e-010.1278
79888LPCAT1P19T-EHumanEsophagusESCC3.94e-023.20e-010.1662
79888LPCAT1P20T-EHumanEsophagusESCC2.85e-112.07e-010.1124
79888LPCAT1P21T-EHumanEsophagusESCC7.09e-204.69e-010.1617
79888LPCAT1P22T-EHumanEsophagusESCC5.45e-112.24e-010.1236
79888LPCAT1P24T-EHumanEsophagusESCC4.47e-041.20e-010.1287
79888LPCAT1P26T-EHumanEsophagusESCC6.28e-041.53e-010.1276
79888LPCAT1P27T-EHumanEsophagusESCC1.24e-037.83e-020.1055
79888LPCAT1P28T-EHumanEsophagusESCC4.94e-092.08e-010.1149
Page: 1 2 3 4 5 6 

check button Transcriptomic changes along malignancy continuum.
TissueExpression DynamicsAbbreviation
EsophagusThe image shows the transcriptomic changes along malignancy continuum.log2FC in expression of this searched gene in stem-like cells from each diseased tissue sample relative to stem-like cells in normal samples in each tissue plotted against the malignancy continuum. Samples are colored based on if they are from different disease stage.ESCC: Esophageal squamous cell carcinoma
HGIN: High-grade intraepithelial neoplasias
LGIN: Low-grade intraepithelial neoplasias
LiverThe image shows the transcriptomic changes along malignancy continuum.log2FC in expression of this searched gene in stem-like cells from each diseased tissue sample relative to stem-like cells in normal samples in each tissue plotted against the malignancy continuum. Samples are colored based on if they are from different disease stage.HCC: Hepatocellular carcinoma
NAFLD: Non-alcoholic fatty liver disease
LungThe image shows the transcriptomic changes along malignancy continuum.log2FC in expression of this searched gene in stem-like cells from each diseased tissue sample relative to stem-like cells in normal samples in each tissue plotted against the malignancy continuum. Samples are colored based on if they are from different disease stage.AAH: Atypical adenomatous hyperplasia
AIS: Adenocarcinoma in situ
IAC: Invasive lung adenocarcinoma
MIA: Minimally invasive adenocarcinoma
Oral CavityThe image shows the transcriptomic changes along malignancy continuum.log2FC in expression of this searched gene in stem-like cells from each diseased tissue sample relative to stem-like cells in normal samples in each tissue plotted against the malignancy continuum. Samples are colored based on if they are from different disease stage.
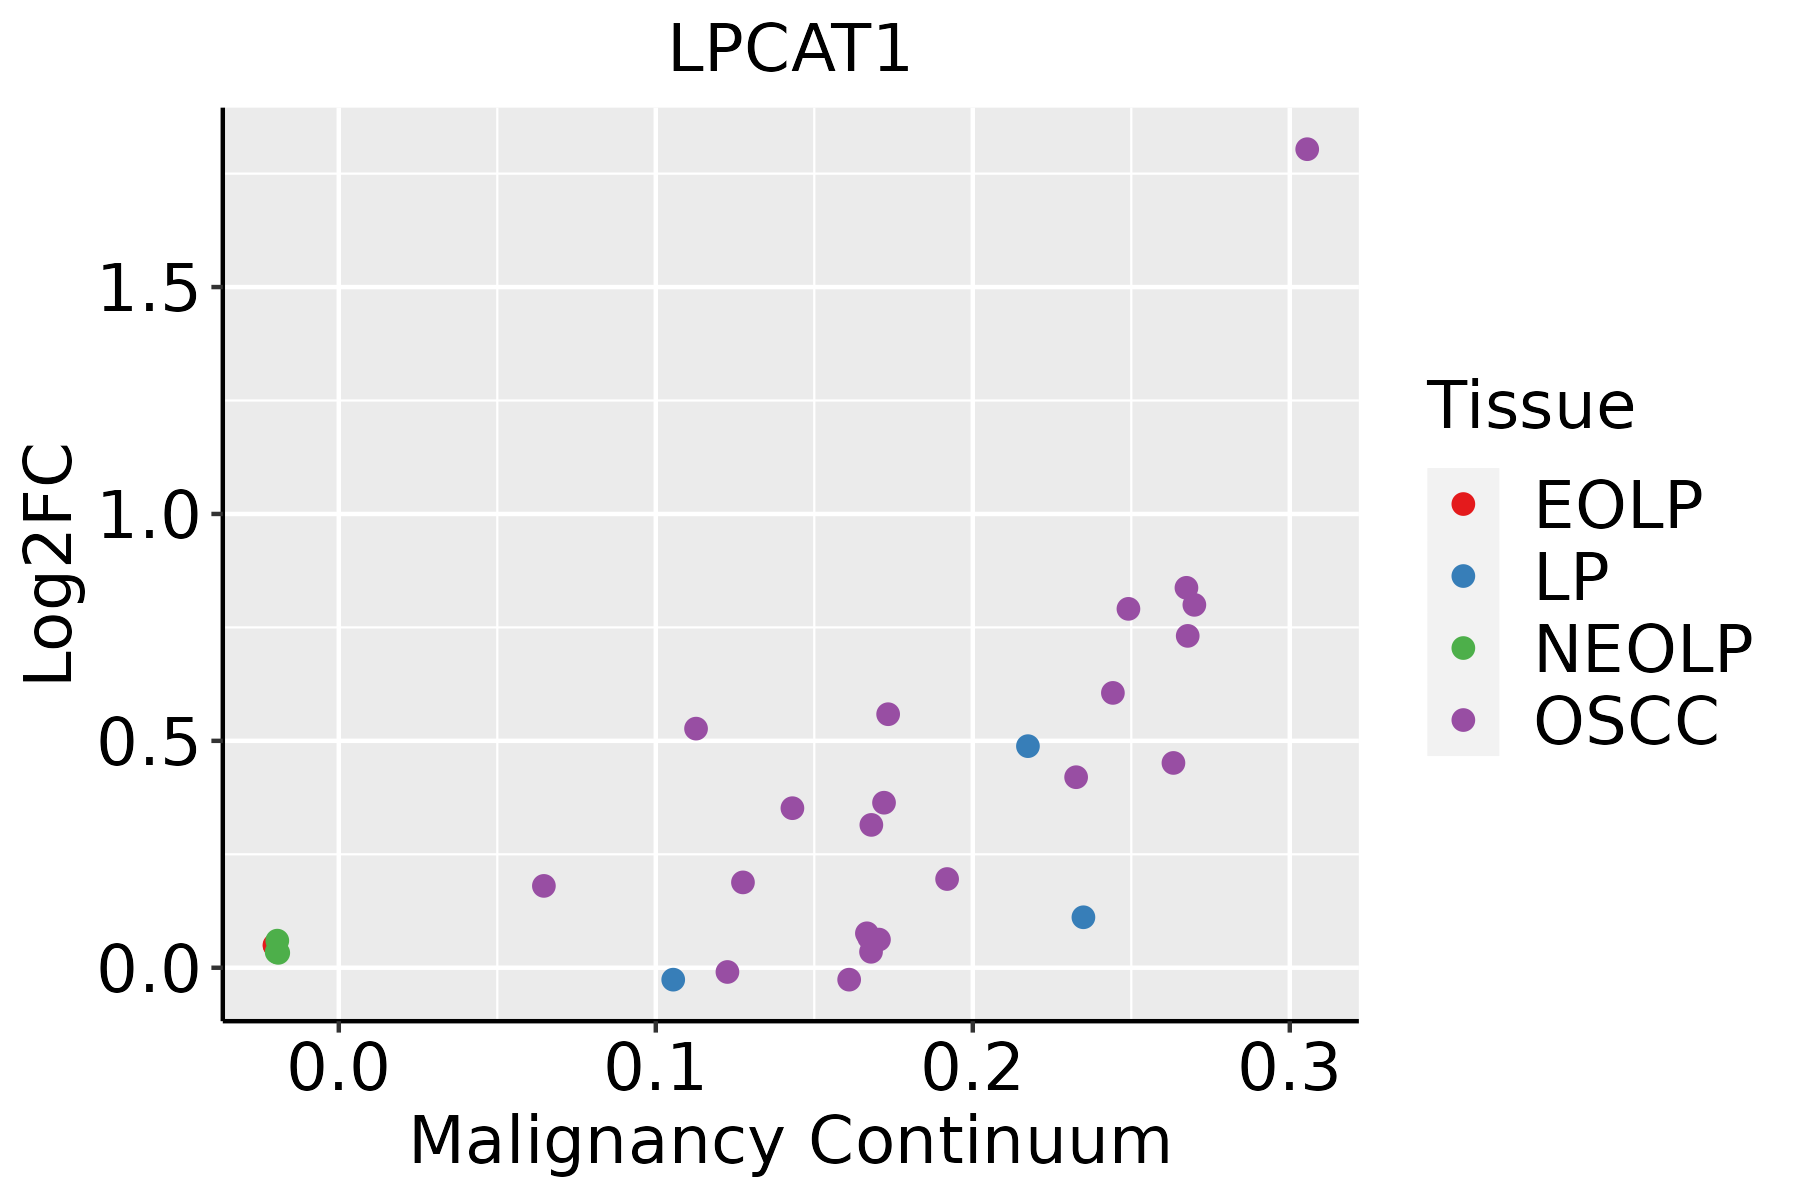
EOLP: Erosive Oral lichen planus
LP: leukoplakia
NEOLP: Non-erosive oral lichen planus
OSCC: Oral squamous cell carcinoma
ThyroidThe image shows the transcriptomic changes along malignancy continuum.log2FC in expression of this searched gene in stem-like cells from each diseased tissue sample relative to stem-like cells in normal samples in each tissue plotted against the malignancy continuum. Samples are colored based on if they are from different disease stage.ATC: Anaplastic thyroid cancer
HT: Hashimoto's thyroiditis
PTC: Papillary thyroid cancer
∗log2FC in expression of this searched gene in stem-like cells from each diseased tissue sample relative to stem-like cells in normal samples in each tissue plotted against the malignancy continuum. Samples are colored based on if they are from different disease stage.

Top

Malignant transformation related pathway analysis

check buttonFind out the enriched GO biological processes and KEGG pathways involved in transition from healthy to precancer to cancer
check button Figure of enriched GO biological processes.
TissueDisease StageEnriched GO biological Processes
ColorectumADGO analysis - Figure of enriched GO biological processes: Top 15 enriched GO BP terms are showed in the bar plot of each disease state in each tissue. Each row represents a significant GO biological process which is colored according to the -log10(p.adjust).
ColorectumSERGO analysis - Figure of enriched GO biological processes: Top 15 enriched GO BP terms are showed in the bar plot of each disease state in each tissue. Each row represents a significant GO biological process which is colored according to the -log10(p.adjust).
ColorectumMSSGO analysis - Figure of enriched GO biological processes: Top 15 enriched GO BP terms are showed in the bar plot of each disease state in each tissue. Each row represents a significant GO biological process which is colored according to the -log10(p.adjust).
ColorectumMSI-HGO analysis - Figure of enriched GO biological processes: Top 15 enriched GO BP terms are showed in the bar plot of each disease state in each tissue. Each row represents a significant GO biological process which is colored according to the -log10(p.adjust).
ColorectumFAPGO analysis - Figure of enriched GO biological processes: Top 15 enriched GO BP terms are showed in the bar plot of each disease state in each tissue. Each row represents a significant GO biological process which is colored according to the -log10(p.adjust).
∗Top 15 enriched GO BP terms are showed in the bar plot of each disease state in each tissue. Each row represents a significant GO biological process which is colored according to the -log10(p.adjust).
Page: 1 2 3 4 5 6 7 8 9 

check button Enriched GO biological processes.
GO IDTissueDisease StageDescriptionGene RatioBg Ratiopvaluep.adjustCount
GO:0042176111EsophagusESCCregulation of protein catabolic process280/8552391/187238.65e-262.39e-23280
GO:0009896111EsophagusESCCpositive regulation of catabolic process332/8552492/187234.36e-239.22e-21332
GO:0045732111EsophagusESCCpositive regulation of protein catabolic process167/8552231/187231.47e-161.14e-14167
GO:0010563111EsophagusESCCnegative regulation of phosphorus metabolic process274/8552442/187232.32e-129.41e-11274
GO:0045936111EsophagusESCCnegative regulation of phosphate metabolic process273/8552441/187233.18e-121.25e-10273
GO:00086544EsophagusESCCphospholipid biosynthetic process162/8552253/187232.59e-095.73e-08162
GO:00464744EsophagusESCCglycerophospholipid biosynthetic process135/8552211/187235.75e-081.02e-06135
GO:00450175EsophagusESCCglycerolipid biosynthetic process154/8552252/187235.20e-076.96e-06154
GO:00066446EsophagusESCCphospholipid metabolic process218/8552383/187235.37e-065.59e-05218
GO:00066561EsophagusESCCphosphatidylcholine biosynthetic process24/855229/187234.50e-053.55e-0424
GO:00066505EsophagusESCCglycerophospholipid metabolic process174/8552306/187234.92e-053.85e-04174
GO:00066541EsophagusESCCphosphatidic acid biosynthetic process26/855233/187231.06e-047.43e-0426
GO:00464733EsophagusESCCphosphatidic acid metabolic process28/855237/187232.00e-041.26e-0328
GO:00464864EsophagusESCCglycerolipid metabolic process211/8552392/187236.51e-043.46e-03211
GO:01501724EsophagusESCCregulation of phosphatidylcholine metabolic process9/855210/187235.09e-031.92e-029
GO:00192168EsophagusESCCregulation of lipid metabolic process172/8552331/187231.20e-024.02e-02172
GO:000989622LiverHCCpositive regulation of catabolic process335/7958492/187233.83e-311.87e-28335
GO:004217622LiverHCCregulation of protein catabolic process267/7958391/187232.45e-257.38e-23267
GO:004573222LiverHCCpositive regulation of protein catabolic process163/7958231/187234.00e-184.69e-16163
GO:001056322LiverHCCnegative regulation of phosphorus metabolic process259/7958442/187234.29e-121.92e-10259
Page: 1 2 3 4 5 

check button Enriched KEGG pathways.
Pathway IDTissueDisease StageDescriptionGene RatioBg Ratiopvaluep.adjustqvalueCount
Page: 1 

Top

Cell-cell communication analysis

check buttonIdentification of potential cell-cell interactions between two cell types and their ligand-receptor pairs for different disease states
LigandReceptorLRpairPathwayTissueDisease Stage
Page: 1 

Top

Single-cell gene regulatory network inference analysis

check buttonFind out the significant the regulons (TFs) and the target genes of each regulon across cell types for different disease states
TFCell TypeTissueDisease StageTarget GeneRSSRegulon Activity
∗The dot plots of a searched regulon are shown for all cell subpopulations in each disease state of each tissue based on the regulon specific score inferred using pySCENIC and by calculating the average expression.
Page: 1 

Top

Somatic mutation of malignant transformation related genes

check buttonAnnotation of somatic variants for genes involved in malignant transformation
Hugo SymbolVariant ClassVariant ClassificationdbSNP RSHGVScHGVSpHGVSp ShortSWISSPROTBIOTYPESIFTPolyPhenTumor Sample BarcodeTissueHistologySexAgeStageTherapy TypesDrugsOutcome
LPCAT1SNVMissense_Mutationnovelc.1351N>Tp.Val451Leup.V451LQ8NF37protein_codingtolerated(0.1)benign(0.031)TCGA-B6-A0I1-01Breastbreast invasive carcinomaFemale>=65I/IIUnknownUnknownPD
LPCAT1SNVMissense_Mutationc.1382N>Ap.Arg461Glnp.R461QQ8NF37protein_codingtolerated(0.52)benign(0.003)TCGA-B6-A0WY-01Breastbreast invasive carcinomaFemale<65III/IVUnknownUnknownPD
LPCAT1SNVMissense_Mutationc.1600N>Cp.Asp534Hisp.D534HQ8NF37protein_codingdeleterious_low_confidence(0)possibly_damaging(0.781)TCGA-BH-A0BP-01Breastbreast invasive carcinomaFemale>=65I/IIUnknownUnknownSD
LPCAT1SNVMissense_Mutationc.1588C>Tp.Arg530Cysp.R530CQ8NF37protein_codingtolerated_low_confidence(0.26)benign(0)TCGA-D8-A1XK-01Breastbreast invasive carcinomaFemale<65I/IIChemotherapydoxorubicine+cyclophosphamideSD
LPCAT1SNVMissense_Mutationnovelc.999A>Tp.Glu333Aspp.E333DQ8NF37protein_codingdeleterious(0)possibly_damaging(0.831)TCGA-2W-A8YY-01Cervixcervical & endocervical cancerFemale<65I/IIChemotherapycisplatinCR
LPCAT1SNVMissense_Mutationnovelc.559G>Tp.Val187Leup.V187LQ8NF37protein_codingdeleterious(0.04)possibly_damaging(0.771)TCGA-2W-A8YY-01Cervixcervical & endocervical cancerFemale<65I/IIChemotherapycisplatinCR
LPCAT1SNVMissense_Mutationc.814N>Cp.Glu272Glnp.E272QQ8NF37protein_codingdeleterious(0.02)probably_damaging(0.91)TCGA-LP-A4AV-01Cervixcervical & endocervical cancerFemale<65I/IIUnknownUnknownSD
LPCAT1SNVMissense_Mutationrs747860604c.358N>Tp.Arg120Trpp.R120WQ8NF37protein_codingdeleterious(0)probably_damaging(0.93)TCGA-4T-AA8H-01Colorectumcolon adenocarcinomaFemale<65I/IIUnknownUnknownSD
LPCAT1SNVMissense_Mutationnovelc.655A>Gp.Thr219Alap.T219AQ8NF37protein_codingdeleterious(0.02)benign(0.081)TCGA-5M-AAT6-01Colorectumcolon adenocarcinomaFemale<65III/IVUnknownUnknownPD
LPCAT1SNVMissense_Mutationc.392N>Tp.Thr131Metp.T131MQ8NF37protein_codingdeleterious(0.01)possibly_damaging(0.829)TCGA-AA-3819-01Colorectumcolon adenocarcinomaFemale<65I/IIUnknownUnknownSD
Page: 1 2 3 4 5 6 7 8 

Top

Related drugs of malignant transformation related genes

check buttonIdentification of chemicals and drugs interact with genes involved in malignant transfromation
(DGIdb 4.0)
Entrez IDSymbolCategoryInteraction TypesDrug Claim NameDrug NamePMIDs
Page: 1