
|
|||||
|
 | |
| |
| |
| |
| |
| |
|
Gene: LPAR6 |
Gene summary for LPAR6 |
| Gene information | Species | Human | Gene symbol | LPAR6 | Gene ID | 10161 |
| Gene name | lysophosphatidic acid receptor 6 | |
| Gene Alias | ARWH1 | |
| Cytomap | 13q14.2 | |
| Gene Type | protein-coding | GO ID | GO:0001701 | UniProtAcc | A0A024RDT2 |
Top |
Malignant transformation analysis |
| Identification of the aberrant gene expression in precancerous and cancerous lesions by comparing the gene expression of stem-like cells in diseased tissues with normal stem cells |
| Entrez ID | Symbol | Replicates | Species | Organ | Tissue | Adj P-value | Log2FC | Malignancy |
| 10161 | LPAR6 | LZE4T | Human | Esophagus | ESCC | 1.85e-06 | -2.21e-01 | 0.0811 |
| 10161 | LPAR6 | LZE7T | Human | Esophagus | ESCC | 4.46e-02 | -2.68e-01 | 0.0667 |
| 10161 | LPAR6 | LZE20T | Human | Esophagus | ESCC | 9.78e-05 | -1.31e-01 | 0.0662 |
| 10161 | LPAR6 | LZE22T | Human | Esophagus | ESCC | 1.85e-03 | -2.41e-01 | 0.068 |
| 10161 | LPAR6 | LZE6T | Human | Esophagus | ESCC | 7.91e-05 | -3.24e-01 | 0.0845 |
| 10161 | LPAR6 | P2T-E | Human | Esophagus | ESCC | 2.52e-15 | -1.85e-02 | 0.1177 |
| 10161 | LPAR6 | P4T-E | Human | Esophagus | ESCC | 3.46e-03 | -9.98e-02 | 0.1323 |
| 10161 | LPAR6 | P5T-E | Human | Esophagus | ESCC | 1.69e-11 | -3.56e-01 | 0.1327 |
| 10161 | LPAR6 | P8T-E | Human | Esophagus | ESCC | 2.61e-16 | 4.64e-01 | 0.0889 |
| 10161 | LPAR6 | P9T-E | Human | Esophagus | ESCC | 2.54e-07 | 8.39e-02 | 0.1131 |
| 10161 | LPAR6 | P10T-E | Human | Esophagus | ESCC | 8.34e-16 | 1.88e-01 | 0.116 |
| 10161 | LPAR6 | P11T-E | Human | Esophagus | ESCC | 4.24e-06 | -1.41e-01 | 0.1426 |
| 10161 | LPAR6 | P12T-E | Human | Esophagus | ESCC | 2.13e-21 | -2.28e-01 | 0.1122 |
| 10161 | LPAR6 | P16T-E | Human | Esophagus | ESCC | 3.44e-17 | -1.71e-01 | 0.1153 |
| 10161 | LPAR6 | P20T-E | Human | Esophagus | ESCC | 1.04e-25 | 9.74e-01 | 0.1124 |
| 10161 | LPAR6 | P21T-E | Human | Esophagus | ESCC | 7.91e-09 | -8.36e-02 | 0.1617 |
| 10161 | LPAR6 | P22T-E | Human | Esophagus | ESCC | 1.76e-03 | -2.41e-01 | 0.1236 |
| 10161 | LPAR6 | P23T-E | Human | Esophagus | ESCC | 9.75e-05 | 7.86e-01 | 0.108 |
| 10161 | LPAR6 | P26T-E | Human | Esophagus | ESCC | 1.01e-06 | -1.28e-01 | 0.1276 |
| 10161 | LPAR6 | P28T-E | Human | Esophagus | ESCC | 3.10e-13 | 1.81e-01 | 0.1149 |
| Page: 1 2 3 4 5 |
| Tissue | Expression Dynamics | Abbreviation |
| Esophagus | 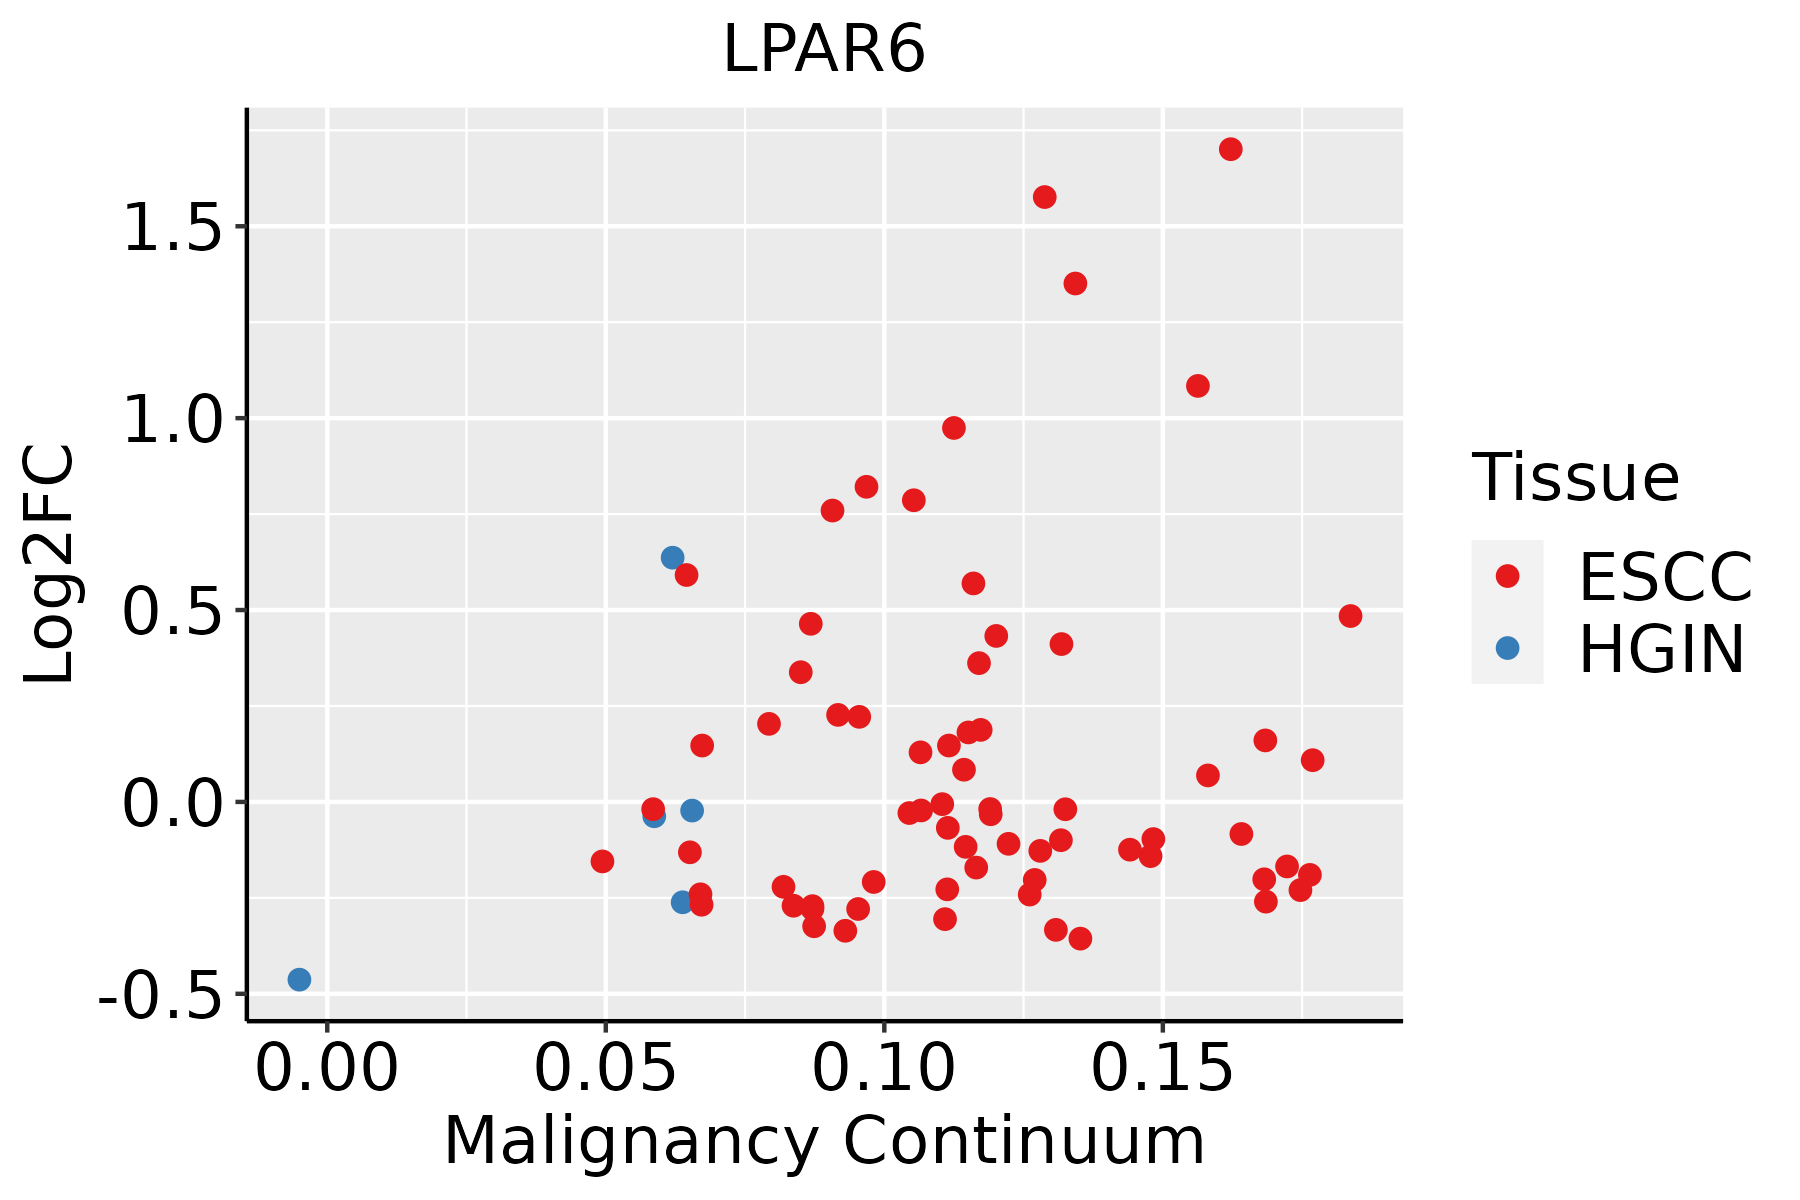 | ESCC: Esophageal squamous cell carcinoma |
| HGIN: High-grade intraepithelial neoplasias | ||
| LGIN: Low-grade intraepithelial neoplasias | ||
| Oral Cavity | 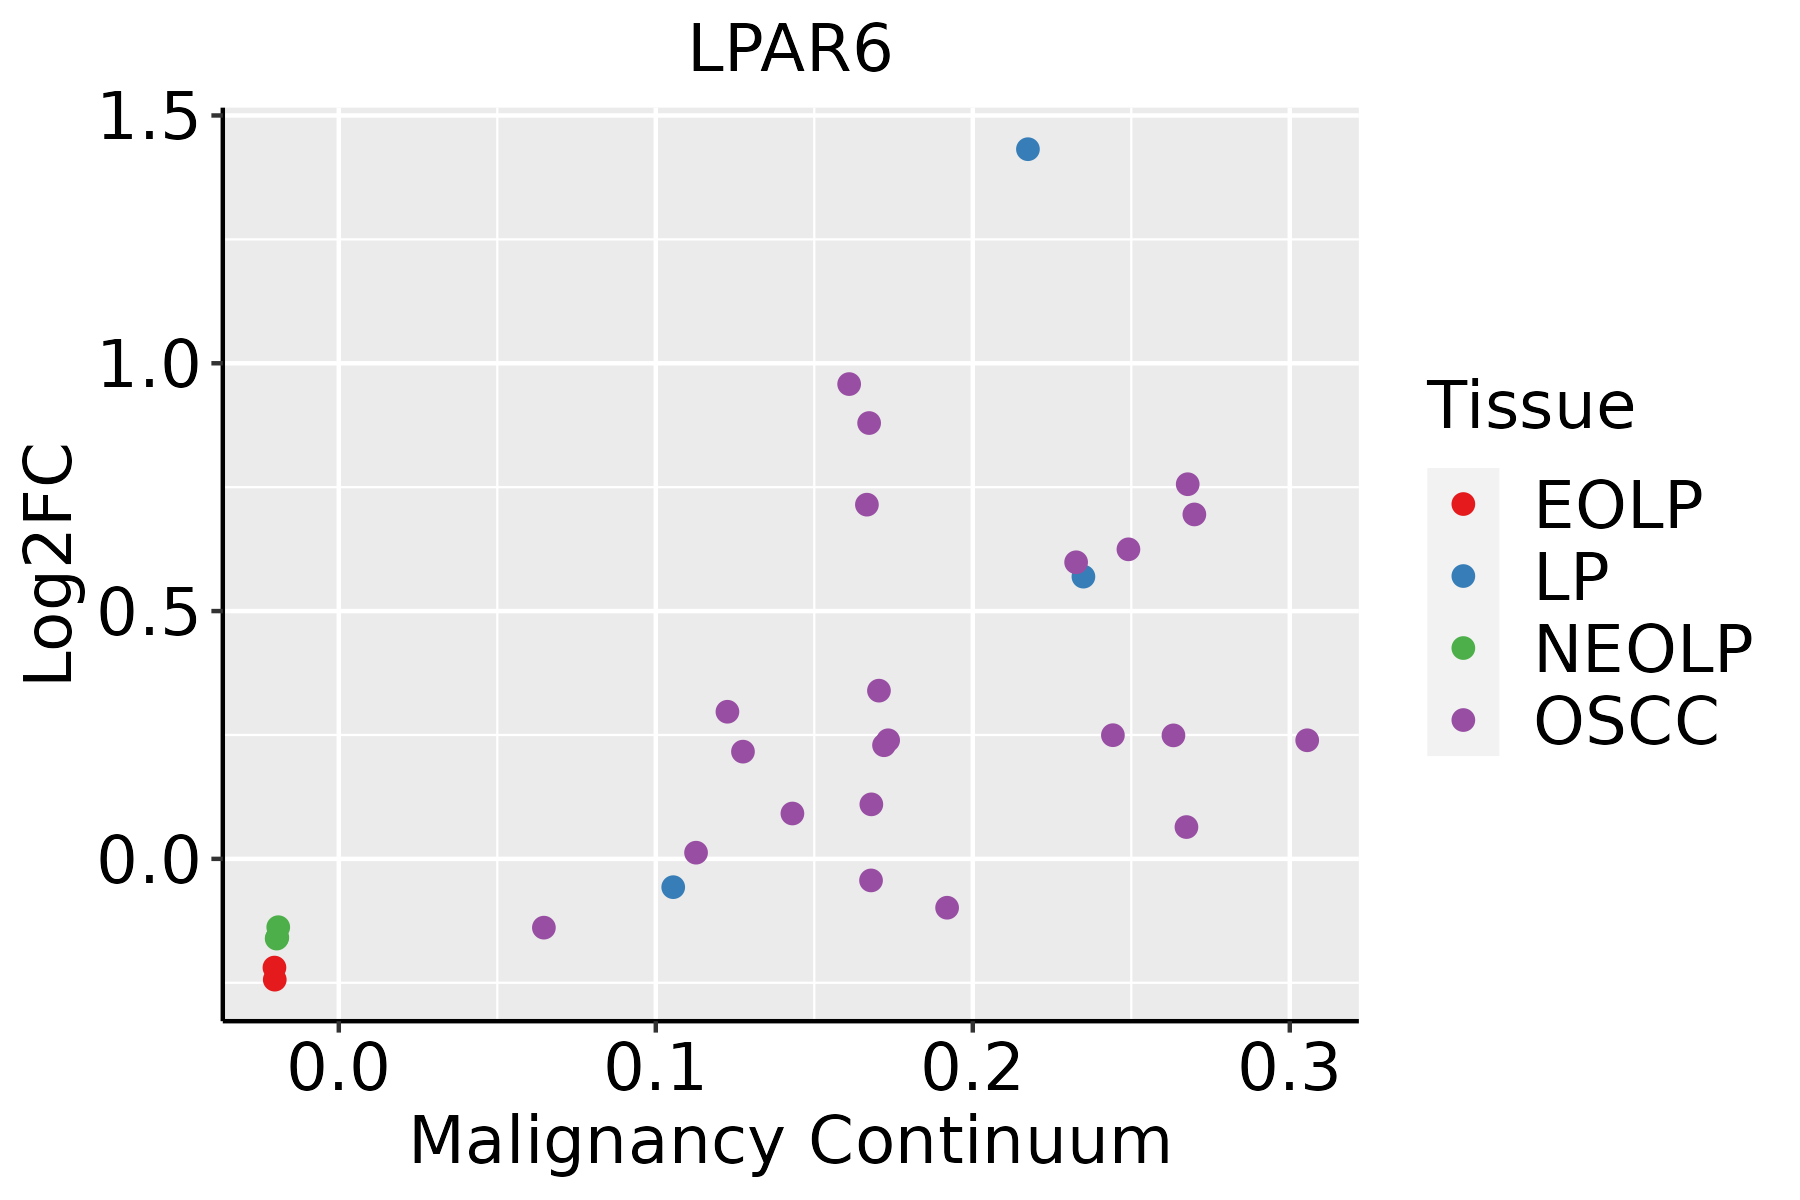 | EOLP: Erosive Oral lichen planus |
| LP: leukoplakia | ||
| NEOLP: Non-erosive oral lichen planus | ||
| OSCC: Oral squamous cell carcinoma | ||
| Prostate | 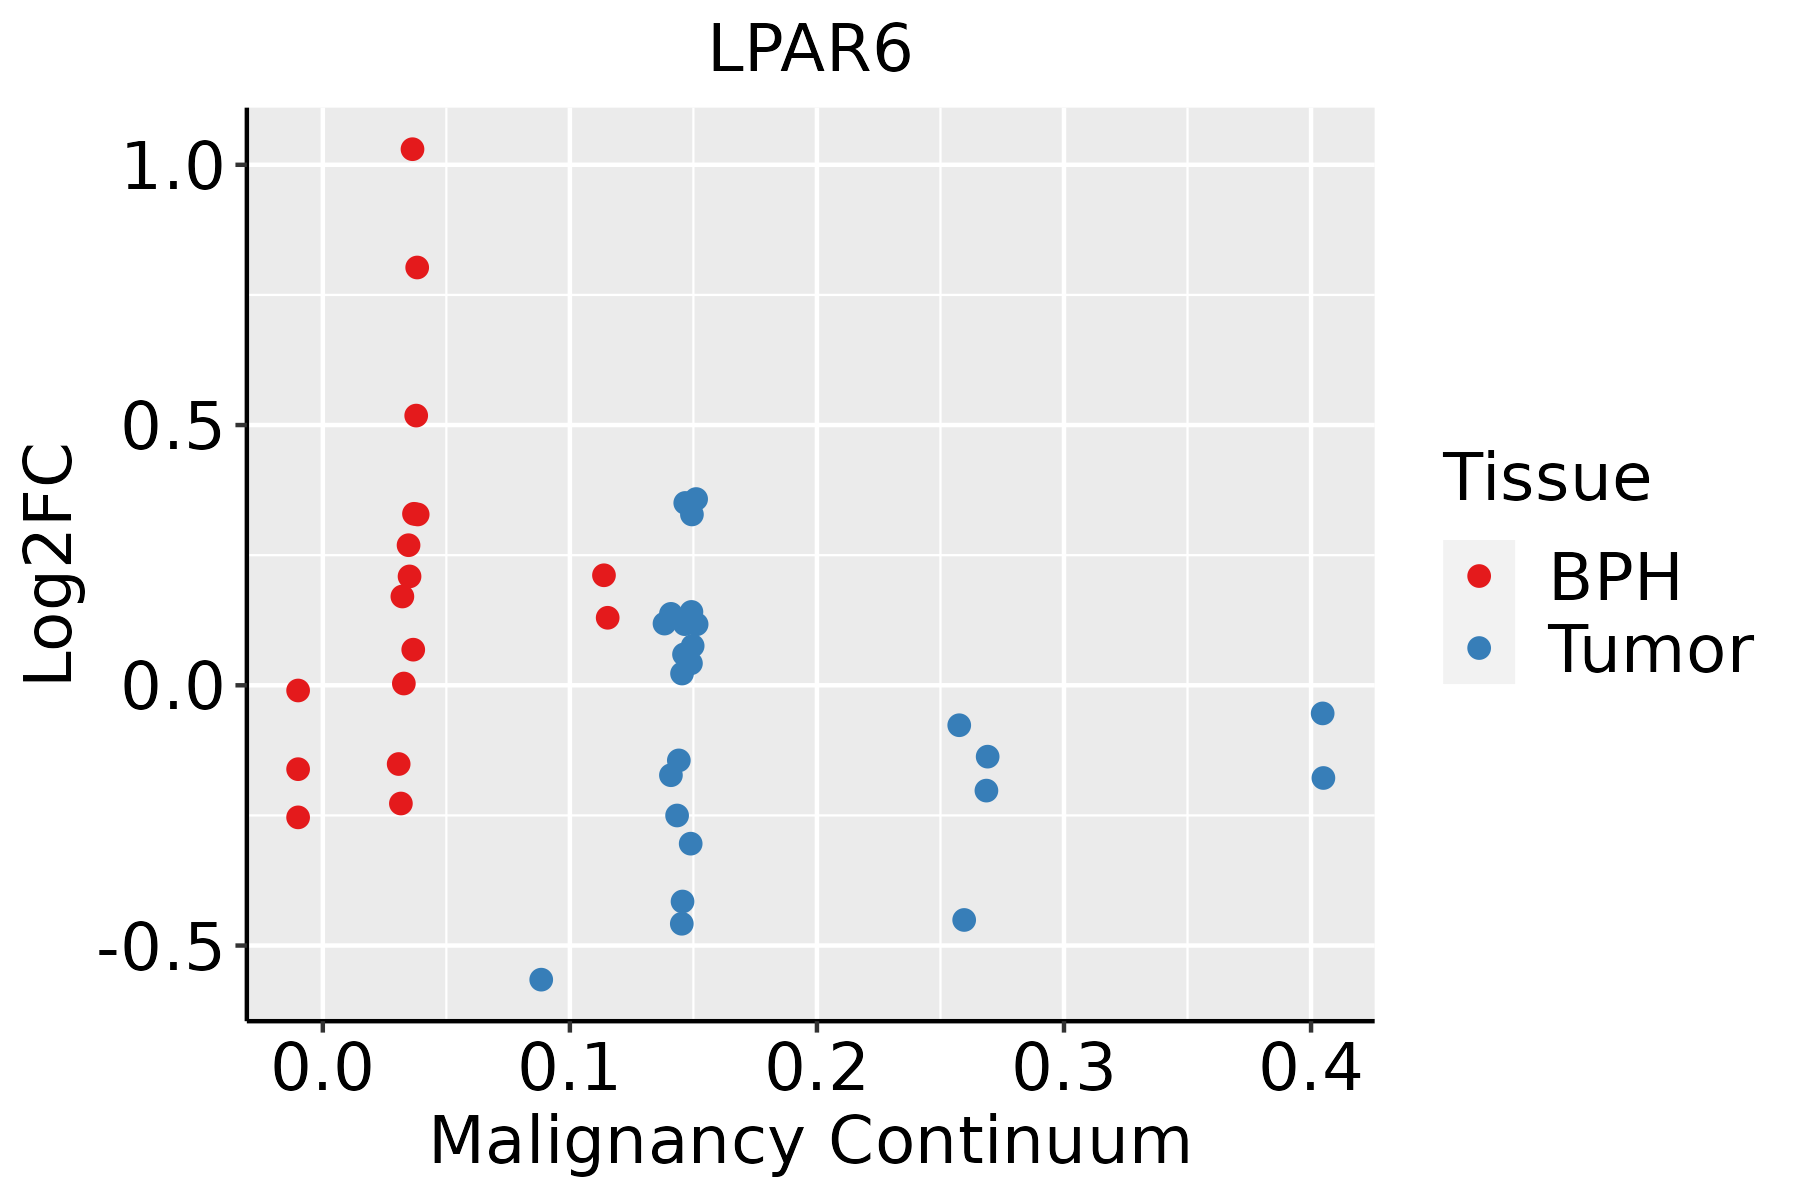 | BPH: Benign Prostatic Hyperplasia |
| Skin | 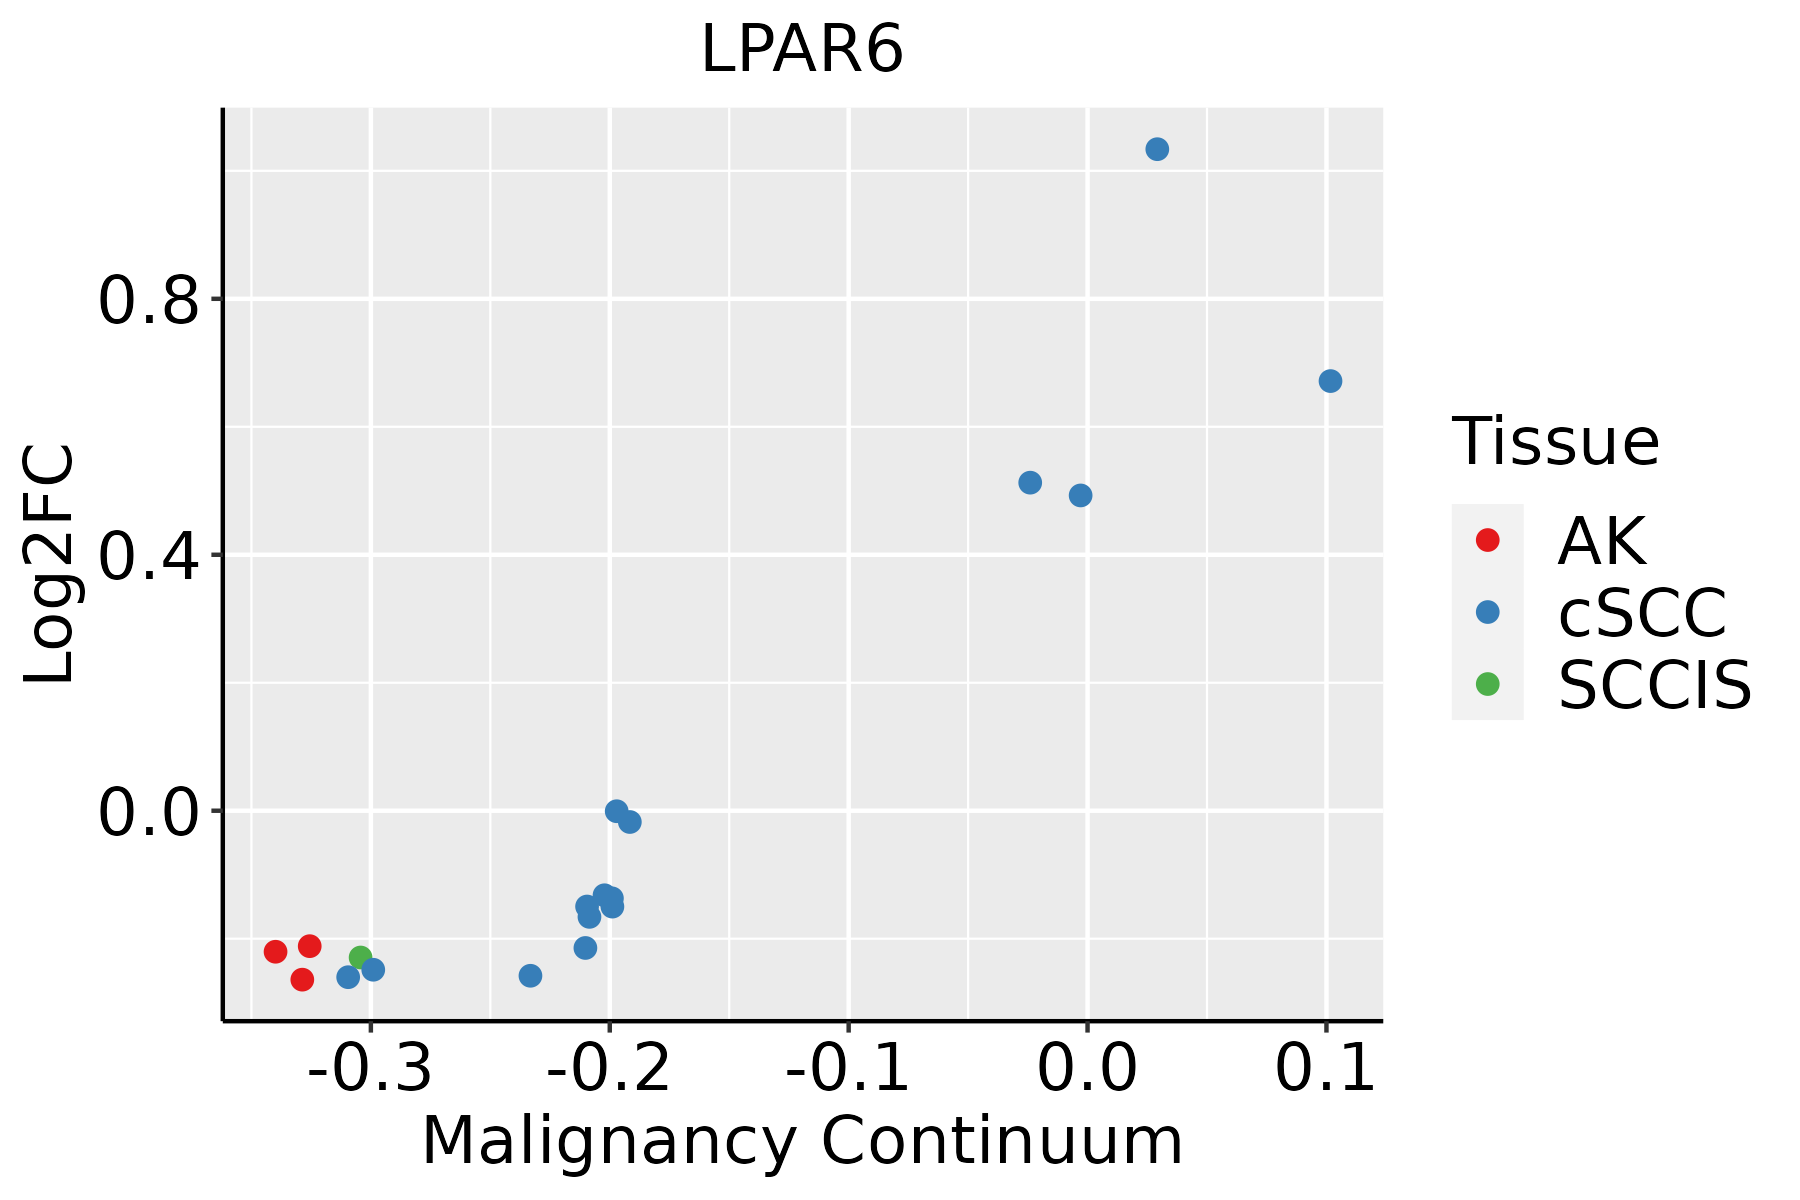 | AK: Actinic keratosis |
| cSCC: Cutaneous squamous cell carcinoma | ||
| SCCIS:squamous cell carcinoma in situ |
| ∗log2FC in expression of this searched gene in stem-like cells from each diseased tissue sample relative to stem-like cells in normal samples in each tissue plotted against the malignancy continuum. Samples are colored based on if they are from different disease stage. |
Top |
Malignant transformation related pathway analysis |
| Find out the enriched GO biological processes and KEGG pathways involved in transition from healthy to precancer to cancer |
| Tissue | Disease Stage | Enriched GO biological Processes |
| Colorectum | AD |  |
| Colorectum | SER |  |
| Colorectum | MSS |  |
| Colorectum | MSI-H |  |
| Colorectum | FAP |  |
| ∗Top 15 enriched GO BP terms are showed in the bar plot of each disease state in each tissue. Each row represents a significant GO biological process which is colored according to the -log10(p.adjust). |
| Page: 1 2 3 4 5 6 7 8 9 |
| GO ID | Tissue | Disease Stage | Description | Gene Ratio | Bg Ratio | pvalue | p.adjust | Count |
| GO:000170119 | Esophagus | ESCC | in utero embryonic development | 243/8552 | 367/18723 | 1.00e-15 | 6.86e-14 | 243 |
| GO:000726510 | Esophagus | ESCC | Ras protein signal transduction | 201/8552 | 337/18723 | 1.44e-07 | 2.30e-06 | 201 |
| GO:000182412 | Esophagus | ESCC | blastocyst development | 73/8552 | 106/18723 | 1.13e-06 | 1.40e-05 | 73 |
| GO:000726610 | Esophagus | ESCC | Rho protein signal transduction | 81/8552 | 137/18723 | 1.03e-03 | 5.20e-03 | 81 |
| GO:00465789 | Esophagus | ESCC | regulation of Ras protein signal transduction | 106/8552 | 189/18723 | 2.49e-03 | 1.08e-02 | 106 |
| GO:005105610 | Esophagus | ESCC | regulation of small GTPase mediated signal transduction | 157/8552 | 302/18723 | 1.55e-02 | 4.98e-02 | 157 |
| GO:000170116 | Oral cavity | OSCC | in utero embryonic development | 207/7305 | 367/18723 | 7.92e-12 | 2.95e-10 | 207 |
| GO:00072659 | Oral cavity | OSCC | Ras protein signal transduction | 185/7305 | 337/18723 | 1.95e-09 | 4.60e-08 | 185 |
| GO:00018243 | Oral cavity | OSCC | blastocyst development | 66/7305 | 106/18723 | 1.04e-06 | 1.40e-05 | 66 |
| GO:00072669 | Oral cavity | OSCC | Rho protein signal transduction | 76/7305 | 137/18723 | 6.64e-05 | 5.37e-04 | 76 |
| GO:00465788 | Oral cavity | OSCC | regulation of Ras protein signal transduction | 90/7305 | 189/18723 | 9.58e-03 | 3.40e-02 | 90 |
| GO:000170117 | Oral cavity | LP | in utero embryonic development | 142/4623 | 367/18723 | 1.48e-09 | 6.75e-08 | 142 |
| GO:000182411 | Oral cavity | LP | blastocyst development | 46/4623 | 106/18723 | 1.86e-05 | 3.15e-04 | 46 |
| GO:000726515 | Oral cavity | LP | Ras protein signal transduction | 109/4623 | 337/18723 | 8.44e-04 | 7.36e-03 | 109 |
| GO:00072658 | Prostate | BPH | Ras protein signal transduction | 101/3107 | 337/18723 | 5.64e-10 | 2.79e-08 | 101 |
| GO:000170110 | Prostate | BPH | in utero embryonic development | 104/3107 | 367/18723 | 9.17e-09 | 3.10e-07 | 104 |
| GO:00510568 | Prostate | BPH | regulation of small GTPase mediated signal transduction | 78/3107 | 302/18723 | 2.69e-05 | 3.16e-04 | 78 |
| GO:00465787 | Prostate | BPH | regulation of Ras protein signal transduction | 53/3107 | 189/18723 | 5.08e-05 | 5.24e-04 | 53 |
| GO:00072668 | Prostate | BPH | Rho protein signal transduction | 39/3107 | 137/18723 | 3.37e-04 | 2.53e-03 | 39 |
| GO:00350237 | Prostate | BPH | regulation of Rho protein signal transduction | 24/3107 | 86/18723 | 5.71e-03 | 2.65e-02 | 24 |
| Page: 1 2 |
| Pathway ID | Tissue | Disease Stage | Description | Gene Ratio | Bg Ratio | pvalue | p.adjust | qvalue | Count |
| hsa041517 | Esophagus | ESCC | PI3K-Akt signaling pathway | 197/4205 | 354/8465 | 1.24e-02 | 2.83e-02 | 1.45e-02 | 197 |
| hsa0415114 | Esophagus | ESCC | PI3K-Akt signaling pathway | 197/4205 | 354/8465 | 1.24e-02 | 2.83e-02 | 1.45e-02 | 197 |
| hsa041516 | Oral cavity | OSCC | PI3K-Akt signaling pathway | 185/3704 | 354/8465 | 6.26e-04 | 1.86e-03 | 9.49e-04 | 185 |
| hsa0415113 | Oral cavity | OSCC | PI3K-Akt signaling pathway | 185/3704 | 354/8465 | 6.26e-04 | 1.86e-03 | 9.49e-04 | 185 |
| hsa041515 | Prostate | BPH | PI3K-Akt signaling pathway | 104/1718 | 354/8465 | 2.07e-05 | 1.55e-04 | 9.61e-05 | 104 |
| hsa0415112 | Prostate | BPH | PI3K-Akt signaling pathway | 104/1718 | 354/8465 | 2.07e-05 | 1.55e-04 | 9.61e-05 | 104 |
| hsa0415122 | Prostate | Tumor | PI3K-Akt signaling pathway | 105/1791 | 354/8465 | 7.42e-05 | 5.30e-04 | 3.28e-04 | 105 |
| hsa0415132 | Prostate | Tumor | PI3K-Akt signaling pathway | 105/1791 | 354/8465 | 7.42e-05 | 5.30e-04 | 3.28e-04 | 105 |
| Page: 1 |
Top |
Cell-cell communication analysis |
| Identification of potential cell-cell interactions between two cell types and their ligand-receptor pairs for different disease states |
| Ligand | Receptor | LRpair | Pathway | Tissue | Disease Stage |
| Page: 1 |
Top |
Single-cell gene regulatory network inference analysis |
| Find out the significant the regulons (TFs) and the target genes of each regulon across cell types for different disease states |
| TF | Cell Type | Tissue | Disease Stage | Target Gene | RSS | Regulon Activity |
| ∗The dot plots of a searched regulon are shown for all cell subpopulations in each disease state of each tissue based on the regulon specific score inferred using pySCENIC and by calculating the average expression. |
| Page: 1 |
Top |
Somatic mutation of malignant transformation related genes |
| Annotation of somatic variants for genes involved in malignant transformation |
| Hugo Symbol | Variant Class | Variant Classification | dbSNP RS | HGVSc | HGVSp | HGVSp Short | SWISSPROT | BIOTYPE | SIFT | PolyPhen | Tumor Sample Barcode | Tissue | Histology | Sex | Age | Stage | Therapy Types | Drugs | Outcome |
| LPAR6 | SNV | Missense_Mutation | novel | c.641C>T | p.Pro214Leu | p.P214L | P43657 | protein_coding | deleterious(0) | probably_damaging(0.996) | TCGA-AC-A6IX-01 | Breast | breast invasive carcinoma | Female | <65 | III/IV | Unknown | Unknown | SD |
| LPAR6 | SNV | Missense_Mutation | c.380N>C | p.Leu127Pro | p.L127P | P43657 | protein_coding | deleterious(0) | probably_damaging(0.939) | TCGA-AN-A0XT-01 | Breast | breast invasive carcinoma | Female | <65 | III/IV | Unknown | Unknown | SD | |
| LPAR6 | SNV | Missense_Mutation | novel | c.454N>T | p.Val152Phe | p.V152F | P43657 | protein_coding | tolerated(0.38) | possibly_damaging(0.6) | TCGA-BI-A20A-01 | Cervix | cervical & endocervical cancer | Female | <65 | I/II | Unknown | Unknown | SD |
| LPAR6 | insertion | Frame_Shift_Ins | novel | c.455_456insAG | p.Phe153ValfsTer34 | p.F153Vfs*34 | P43657 | protein_coding | TCGA-BI-A20A-01 | Cervix | cervical & endocervical cancer | Female | <65 | I/II | Unknown | Unknown | SD | ||
| LPAR6 | deletion | Frame_Shift_Del | novel | c.582delN | p.Phe194LeufsTer4 | p.F194Lfs*4 | P43657 | protein_coding | TCGA-EA-A410-01 | Cervix | cervical & endocervical cancer | Female | <65 | I/II | Unknown | Unknown | SD | ||
| LPAR6 | deletion | In_Frame_Del | novel | c.359_379delNNNNNNNNNNNNNNNNNNNNN | p.Tyr120_Thr126del | p.Y120_T126del | P43657 | protein_coding | TCGA-IR-A3LK-01 | Cervix | cervical & endocervical cancer | Female | >=65 | I/II | Chemotherapy | cisplatin | PD | ||
| LPAR6 | SNV | Missense_Mutation | novel | c.235A>G | p.Thr79Ala | p.T79A | P43657 | protein_coding | tolerated(0.39) | benign(0.003) | TCGA-AA-3864-01 | Colorectum | colon adenocarcinoma | Male | >=65 | I/II | Unknown | Unknown | SD |
| LPAR6 | SNV | Missense_Mutation | c.274N>C | p.Ser92Pro | p.S92P | P43657 | protein_coding | deleterious(0) | probably_damaging(1) | TCGA-AA-A00N-01 | Colorectum | colon adenocarcinoma | Male | >=65 | I/II | Unknown | Unknown | PD | |
| LPAR6 | SNV | Missense_Mutation | c.605N>T | p.Thr202Ile | p.T202I | P43657 | protein_coding | tolerated(0.27) | benign(0.042) | TCGA-AD-6963-01 | Colorectum | colon adenocarcinoma | Male | <65 | I/II | Unknown | Unknown | SD | |
| LPAR6 | SNV | Missense_Mutation | c.714N>A | p.Phe238Leu | p.F238L | P43657 | protein_coding | deleterious(0) | probably_damaging(0.999) | TCGA-AZ-4315-01 | Colorectum | colon adenocarcinoma | Male | <65 | I/II | Unknown | Unknown | SD |
| Page: 1 2 3 4 |
Top |
Related drugs of malignant transformation related genes |
| Identification of chemicals and drugs interact with genes involved in malignant transfromation |
| (DGIdb 4.0) |
| Entrez ID | Symbol | Category | Interaction Types | Drug Claim Name | Drug Name | PMIDs |
| 10161 | LPAR6 | G PROTEIN COUPLED RECEPTOR, DRUGGABLE GENOME | MC-1 | |||
| 10161 | LPAR6 | G PROTEIN COUPLED RECEPTOR, DRUGGABLE GENOME | agonist | 135651509 |
| Page: 1 |

Copyright 2023-Present -The University of Texas Health Science Center at Houston |