
|
|||||
|
 | |
| |
| |
| |
| |
| |
|
Gene: LOXL4 |
Gene summary for LOXL4 |
| Gene information | Species | Human | Gene symbol | LOXL4 | Gene ID | 84171 |
| Gene name | lysyl oxidase like 4 | |
| Gene Alias | LOXC | |
| Cytomap | 10q24.2 | |
| Gene Type | protein-coding | GO ID | GO:0006464 | UniProtAcc | Q96JB6 |
Top |
Malignant transformation analysis |
| Identification of the aberrant gene expression in precancerous and cancerous lesions by comparing the gene expression of stem-like cells in diseased tissues with normal stem cells |
| Entrez ID | Symbol | Replicates | Species | Organ | Tissue | Adj P-value | Log2FC | Malignancy |
| 84171 | LOXL4 | LZE4T | Human | Esophagus | ESCC | 8.55e-04 | 7.04e-02 | 0.0811 |
| 84171 | LOXL4 | P8T-E | Human | Esophagus | ESCC | 2.30e-13 | 2.41e-01 | 0.0889 |
| 84171 | LOXL4 | P9T-E | Human | Esophagus | ESCC | 4.41e-03 | 7.97e-02 | 0.1131 |
| 84171 | LOXL4 | P10T-E | Human | Esophagus | ESCC | 4.86e-11 | 2.49e-01 | 0.116 |
| 84171 | LOXL4 | P12T-E | Human | Esophagus | ESCC | 6.68e-13 | 4.03e-01 | 0.1122 |
| 84171 | LOXL4 | P16T-E | Human | Esophagus | ESCC | 5.55e-22 | 4.98e-01 | 0.1153 |
| 84171 | LOXL4 | P30T-E | Human | Esophagus | ESCC | 1.51e-04 | 3.72e-01 | 0.137 |
| 84171 | LOXL4 | P31T-E | Human | Esophagus | ESCC | 3.80e-39 | 7.37e-01 | 0.1251 |
| 84171 | LOXL4 | P32T-E | Human | Esophagus | ESCC | 4.96e-02 | -1.90e-02 | 0.1666 |
| 84171 | LOXL4 | P42T-E | Human | Esophagus | ESCC | 6.06e-07 | 4.66e-02 | 0.1175 |
| 84171 | LOXL4 | P47T-E | Human | Esophagus | ESCC | 1.26e-06 | 2.83e-01 | 0.1067 |
| 84171 | LOXL4 | P57T-E | Human | Esophagus | ESCC | 3.69e-16 | 8.92e-01 | 0.0926 |
| 84171 | LOXL4 | P61T-E | Human | Esophagus | ESCC | 1.76e-02 | 2.78e-02 | 0.099 |
| 84171 | LOXL4 | P62T-E | Human | Esophagus | ESCC | 4.07e-05 | 5.34e-01 | 0.1302 |
| 84171 | LOXL4 | P76T-E | Human | Esophagus | ESCC | 1.95e-21 | 6.74e-01 | 0.1207 |
| 84171 | LOXL4 | C38 | Human | Oral cavity | OSCC | 2.88e-03 | 3.11e-01 | 0.172 |
| 84171 | LOXL4 | C06 | Human | Oral cavity | OSCC | 4.85e-06 | 1.24e+00 | 0.2699 |
| 84171 | LOXL4 | C08 | Human | Oral cavity | OSCC | 5.27e-33 | 1.13e+00 | 0.1919 |
| 84171 | LOXL4 | SYSMH1 | Human | Oral cavity | OSCC | 9.25e-09 | 2.03e-01 | 0.1127 |
| 84171 | LOXL4 | SYSMH6 | Human | Oral cavity | OSCC | 9.26e-07 | 1.62e-01 | 0.1275 |
| Page: 1 |
| Tissue | Expression Dynamics | Abbreviation |
| Esophagus | 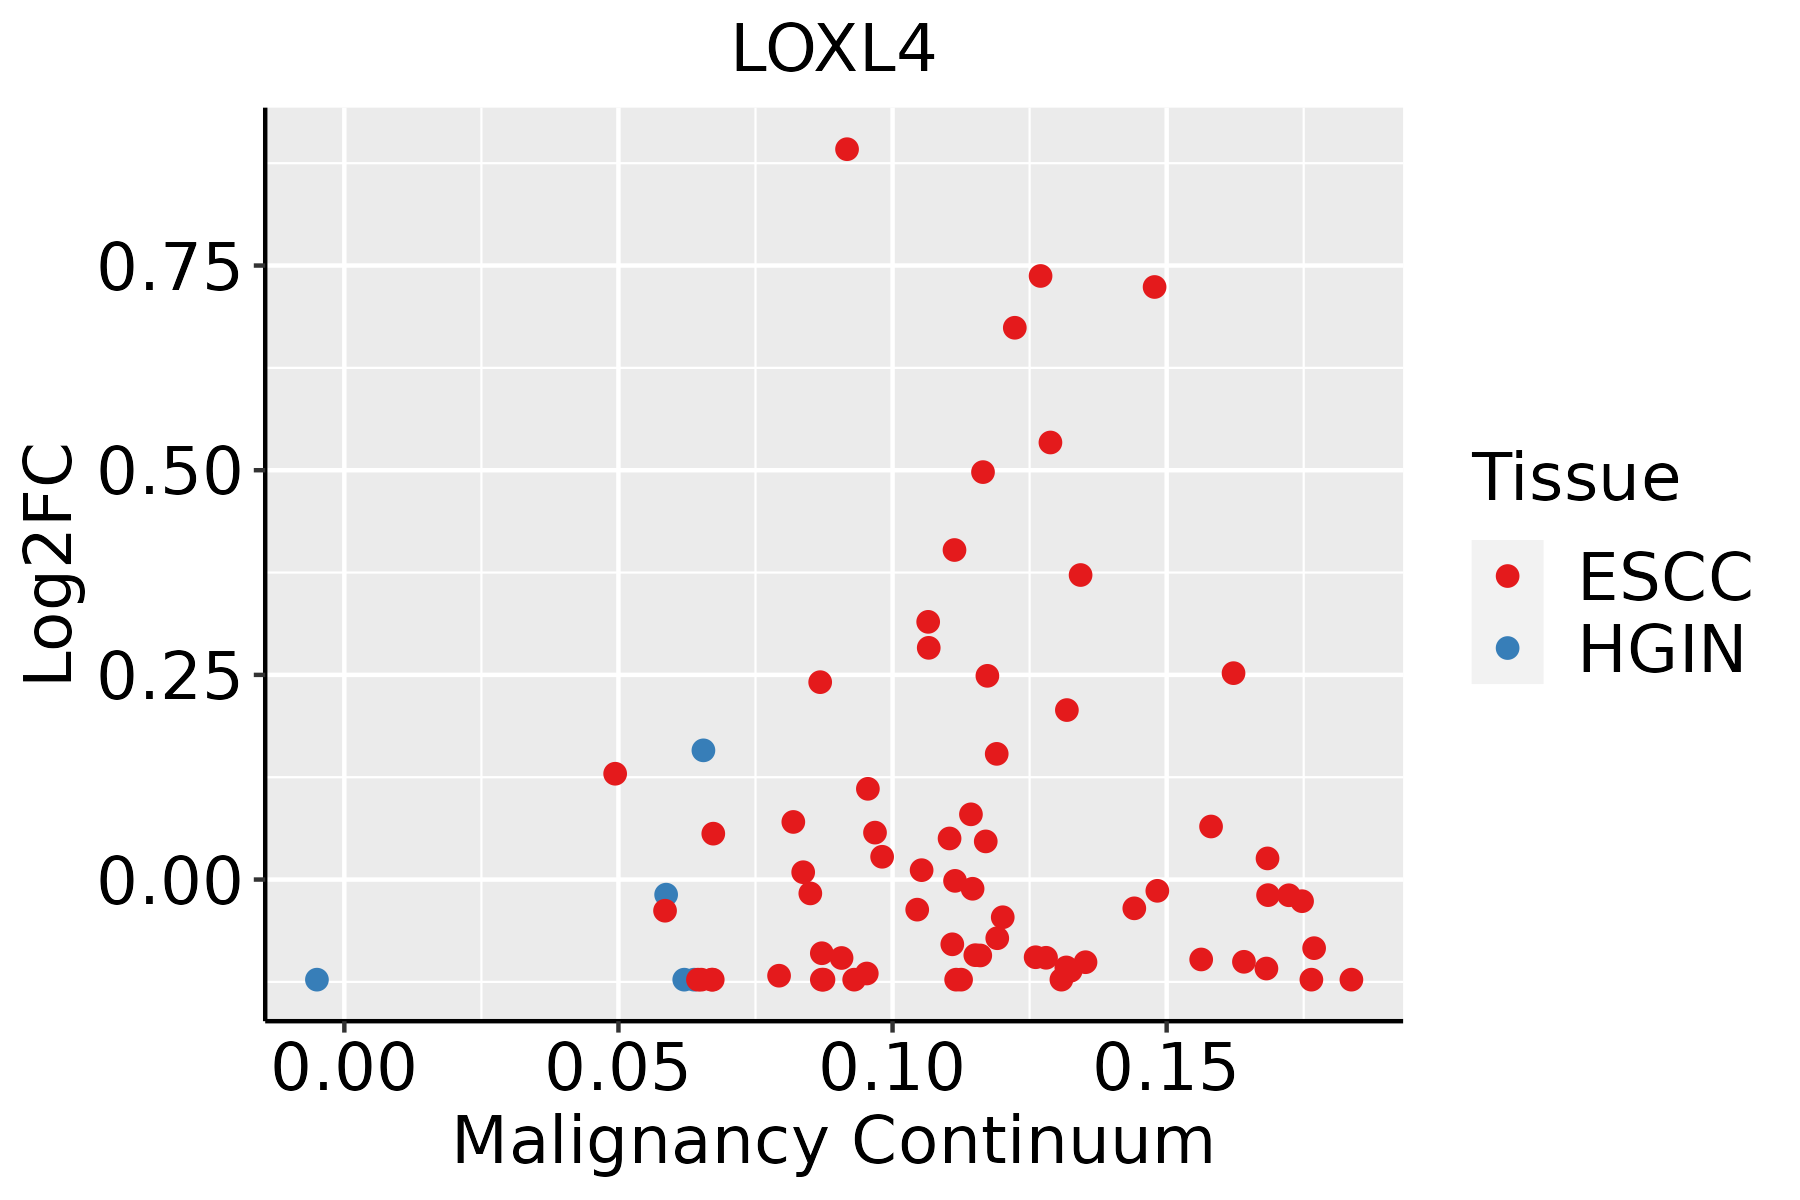 | ESCC: Esophageal squamous cell carcinoma |
| HGIN: High-grade intraepithelial neoplasias | ||
| LGIN: Low-grade intraepithelial neoplasias | ||
| Oral Cavity |  | EOLP: Erosive Oral lichen planus |
| LP: leukoplakia | ||
| NEOLP: Non-erosive oral lichen planus | ||
| OSCC: Oral squamous cell carcinoma |
| ∗log2FC in expression of this searched gene in stem-like cells from each diseased tissue sample relative to stem-like cells in normal samples in each tissue plotted against the malignancy continuum. Samples are colored based on if they are from different disease stage. |
Top |
Malignant transformation related pathway analysis |
| Find out the enriched GO biological processes and KEGG pathways involved in transition from healthy to precancer to cancer |
| Tissue | Disease Stage | Enriched GO biological Processes |
| Colorectum | AD |  |
| Colorectum | SER |  |
| Colorectum | MSS |  |
| Colorectum | MSI-H |  |
| Colorectum | FAP |  |
| ∗Top 15 enriched GO BP terms are showed in the bar plot of each disease state in each tissue. Each row represents a significant GO biological process which is colored according to the -log10(p.adjust). |
| Page: 1 2 3 4 5 6 7 8 9 |
| GO ID | Tissue | Disease Stage | Description | Gene Ratio | Bg Ratio | pvalue | p.adjust | Count |
| GO:001820514 | Esophagus | ESCC | peptidyl-lysine modification | 259/8552 | 376/18723 | 3.90e-20 | 5.26e-18 | 259 |
| GO:00301984 | Esophagus | ESCC | extracellular matrix organization | 171/8552 | 301/18723 | 6.08e-05 | 4.67e-04 | 171 |
| GO:00430624 | Esophagus | ESCC | extracellular structure organization | 171/8552 | 302/18723 | 7.73e-05 | 5.76e-04 | 171 |
| GO:00452294 | Esophagus | ESCC | external encapsulating structure organization | 172/8552 | 304/18723 | 7.80e-05 | 5.80e-04 | 172 |
| GO:00301993 | Esophagus | ESCC | collagen fibril organization | 40/8552 | 61/18723 | 1.35e-03 | 6.44e-03 | 40 |
| GO:00182056 | Oral cavity | OSCC | peptidyl-lysine modification | 216/7305 | 376/18723 | 2.32e-13 | 1.16e-11 | 216 |
| GO:00301983 | Oral cavity | OSCC | extracellular matrix organization | 146/7305 | 301/18723 | 4.67e-04 | 2.77e-03 | 146 |
| GO:00452293 | Oral cavity | OSCC | external encapsulating structure organization | 147/7305 | 304/18723 | 5.30e-04 | 3.08e-03 | 147 |
| GO:00430623 | Oral cavity | OSCC | extracellular structure organization | 146/7305 | 302/18723 | 5.59e-04 | 3.23e-03 | 146 |
| Page: 1 |
| Pathway ID | Tissue | Disease Stage | Description | Gene Ratio | Bg Ratio | pvalue | p.adjust | qvalue | Count |
| Page: 1 |
Top |
Cell-cell communication analysis |
| Identification of potential cell-cell interactions between two cell types and their ligand-receptor pairs for different disease states |
| Ligand | Receptor | LRpair | Pathway | Tissue | Disease Stage |
| Page: 1 |
Top |
Single-cell gene regulatory network inference analysis |
| Find out the significant the regulons (TFs) and the target genes of each regulon across cell types for different disease states |
| TF | Cell Type | Tissue | Disease Stage | Target Gene | RSS | Regulon Activity |
| ∗The dot plots of a searched regulon are shown for all cell subpopulations in each disease state of each tissue based on the regulon specific score inferred using pySCENIC and by calculating the average expression. |
| Page: 1 |
Top |
Somatic mutation of malignant transformation related genes |
| Annotation of somatic variants for genes involved in malignant transformation |
| Hugo Symbol | Variant Class | Variant Classification | dbSNP RS | HGVSc | HGVSp | HGVSp Short | SWISSPROT | BIOTYPE | SIFT | PolyPhen | Tumor Sample Barcode | Tissue | Histology | Sex | Age | Stage | Therapy Types | Drugs | Outcome |
| LOXL4 | SNV | Missense_Mutation | rs369951896 | c.288N>C | p.Trp96Cys | p.W96C | Q96JB6 | protein_coding | deleterious(0) | probably_damaging(0.999) | TCGA-A2-A25B-01 | Breast | breast invasive carcinoma | Female | <65 | I/II | Chemotherapy | taxotere | PD |
| LOXL4 | SNV | Missense_Mutation | c.1476N>T | p.Met492Ile | p.M492I | Q96JB6 | protein_coding | deleterious(0) | benign(0.11) | TCGA-A8-A09A-01 | Breast | breast invasive carcinoma | Female | <65 | I/II | Hormone Therapy | tamoxiphen | SD | |
| LOXL4 | SNV | Missense_Mutation | c.1226N>C | p.Arg409Thr | p.R409T | Q96JB6 | protein_coding | deleterious(0.01) | probably_damaging(0.984) | TCGA-C8-A27B-01 | Breast | breast invasive carcinoma | Female | <65 | I/II | Chemotherapy | 5-fluorouracil | CR | |
| LOXL4 | insertion | Frame_Shift_Ins | novel | c.93_94insAGCCAGCACCCAAAGGAGGTAGCAGGCAG | p.Leu32SerfsTer59 | p.L32Sfs*59 | Q96JB6 | protein_coding | TCGA-AR-A0TY-01 | Breast | breast invasive carcinoma | Female | <65 | I/II | Unspecific | Paclitaxel | PD | ||
| LOXL4 | insertion | Frame_Shift_Ins | novel | c.2018_2019insAGTCAAGCTGGGTCCAATGAACCTGTGTTTGAGTA | p.Tyr674ValfsTer36 | p.Y674Vfs*36 | Q96JB6 | protein_coding | TCGA-B6-A0IK-01 | Breast | breast invasive carcinoma | Female | <65 | III/IV | Unknown | Unknown | PD | ||
| LOXL4 | SNV | Missense_Mutation | novel | c.2090T>C | p.Val697Ala | p.V697A | Q96JB6 | protein_coding | deleterious(0.01) | benign(0.43) | TCGA-2W-A8YY-01 | Cervix | cervical & endocervical cancer | Female | <65 | I/II | Chemotherapy | cisplatin | CR |
| LOXL4 | SNV | Missense_Mutation | rs748722552 | c.1717G>A | p.Asp573Asn | p.D573N | Q96JB6 | protein_coding | tolerated(1) | benign(0.003) | TCGA-2W-A8YY-01 | Cervix | cervical & endocervical cancer | Female | <65 | I/II | Chemotherapy | cisplatin | CR |
| LOXL4 | SNV | Missense_Mutation | rs139735732 | c.337G>A | p.Gly113Arg | p.G113R | Q96JB6 | protein_coding | tolerated(0.63) | benign(0.001) | TCGA-2W-A8YY-01 | Cervix | cervical & endocervical cancer | Female | <65 | I/II | Chemotherapy | cisplatin | CR |
| LOXL4 | SNV | Missense_Mutation | c.487N>T | p.Pro163Ser | p.P163S | Q96JB6 | protein_coding | deleterious(0.03) | probably_damaging(1) | TCGA-A6-2672-01 | Colorectum | colon adenocarcinoma | Female | >=65 | III/IV | Unknown | Unknown | SD | |
| LOXL4 | SNV | Missense_Mutation | c.382N>A | p.Val128Ile | p.V128I | Q96JB6 | protein_coding | tolerated(0.08) | benign(0.01) | TCGA-A6-5656-01 | Colorectum | colon adenocarcinoma | Male | >=65 | I/II | Unknown | Unknown | SD |
| Page: 1 2 3 4 5 6 7 |
Top |
Related drugs of malignant transformation related genes |
| Identification of chemicals and drugs interact with genes involved in malignant transfromation |
| (DGIdb 4.0) |
| Entrez ID | Symbol | Category | Interaction Types | Drug Claim Name | Drug Name | PMIDs |
| Page: 1 |

Copyright 2023-Present -The University of Texas Health Science Center at Houston |