| Tissue | Expression Dynamics | Abbreviation |
| Esophagus |  | ESCC: Esophageal squamous cell carcinoma |
| HGIN: High-grade intraepithelial neoplasias |
| LGIN: Low-grade intraepithelial neoplasias |
| Oral Cavity | 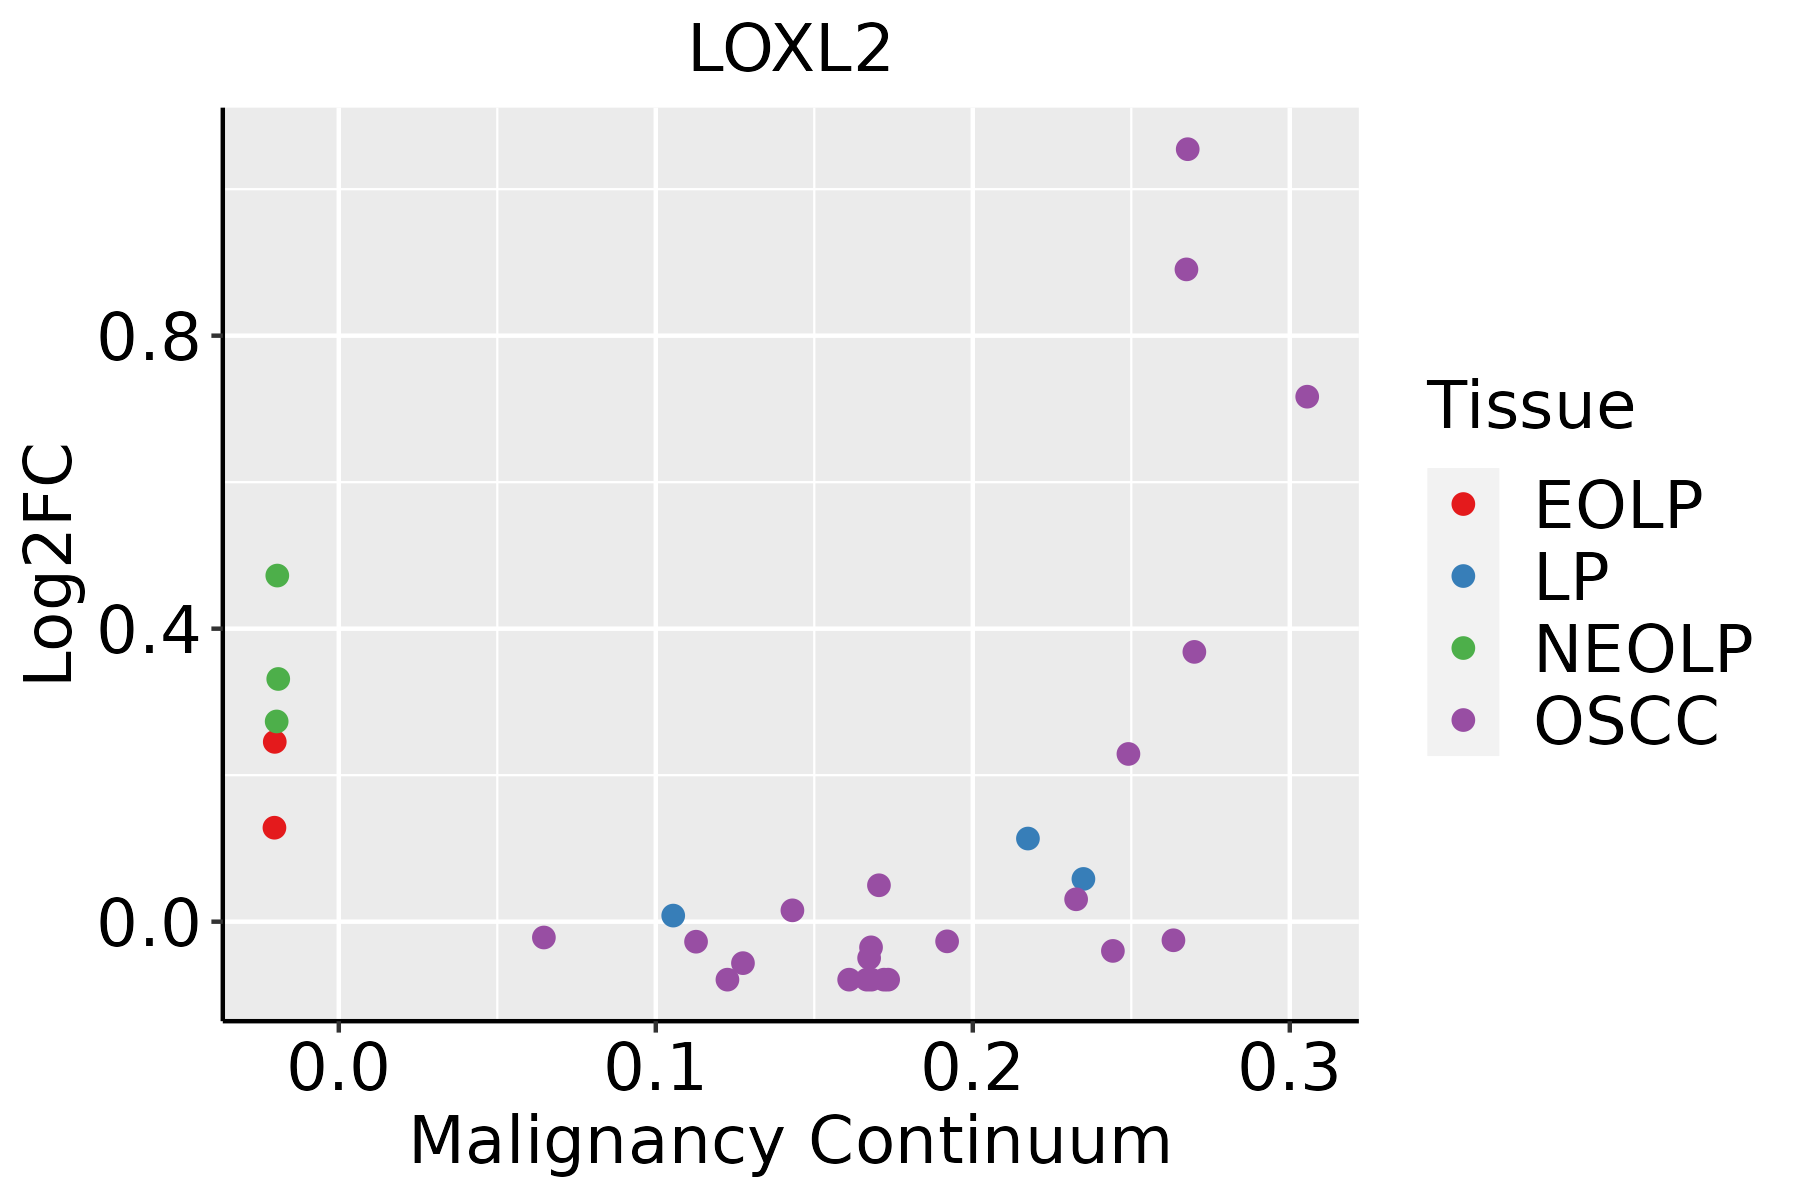 | EOLP: Erosive Oral lichen planus |
| LP: leukoplakia |
| NEOLP: Non-erosive oral lichen planus |
| OSCC: Oral squamous cell carcinoma |
| Thyroid | 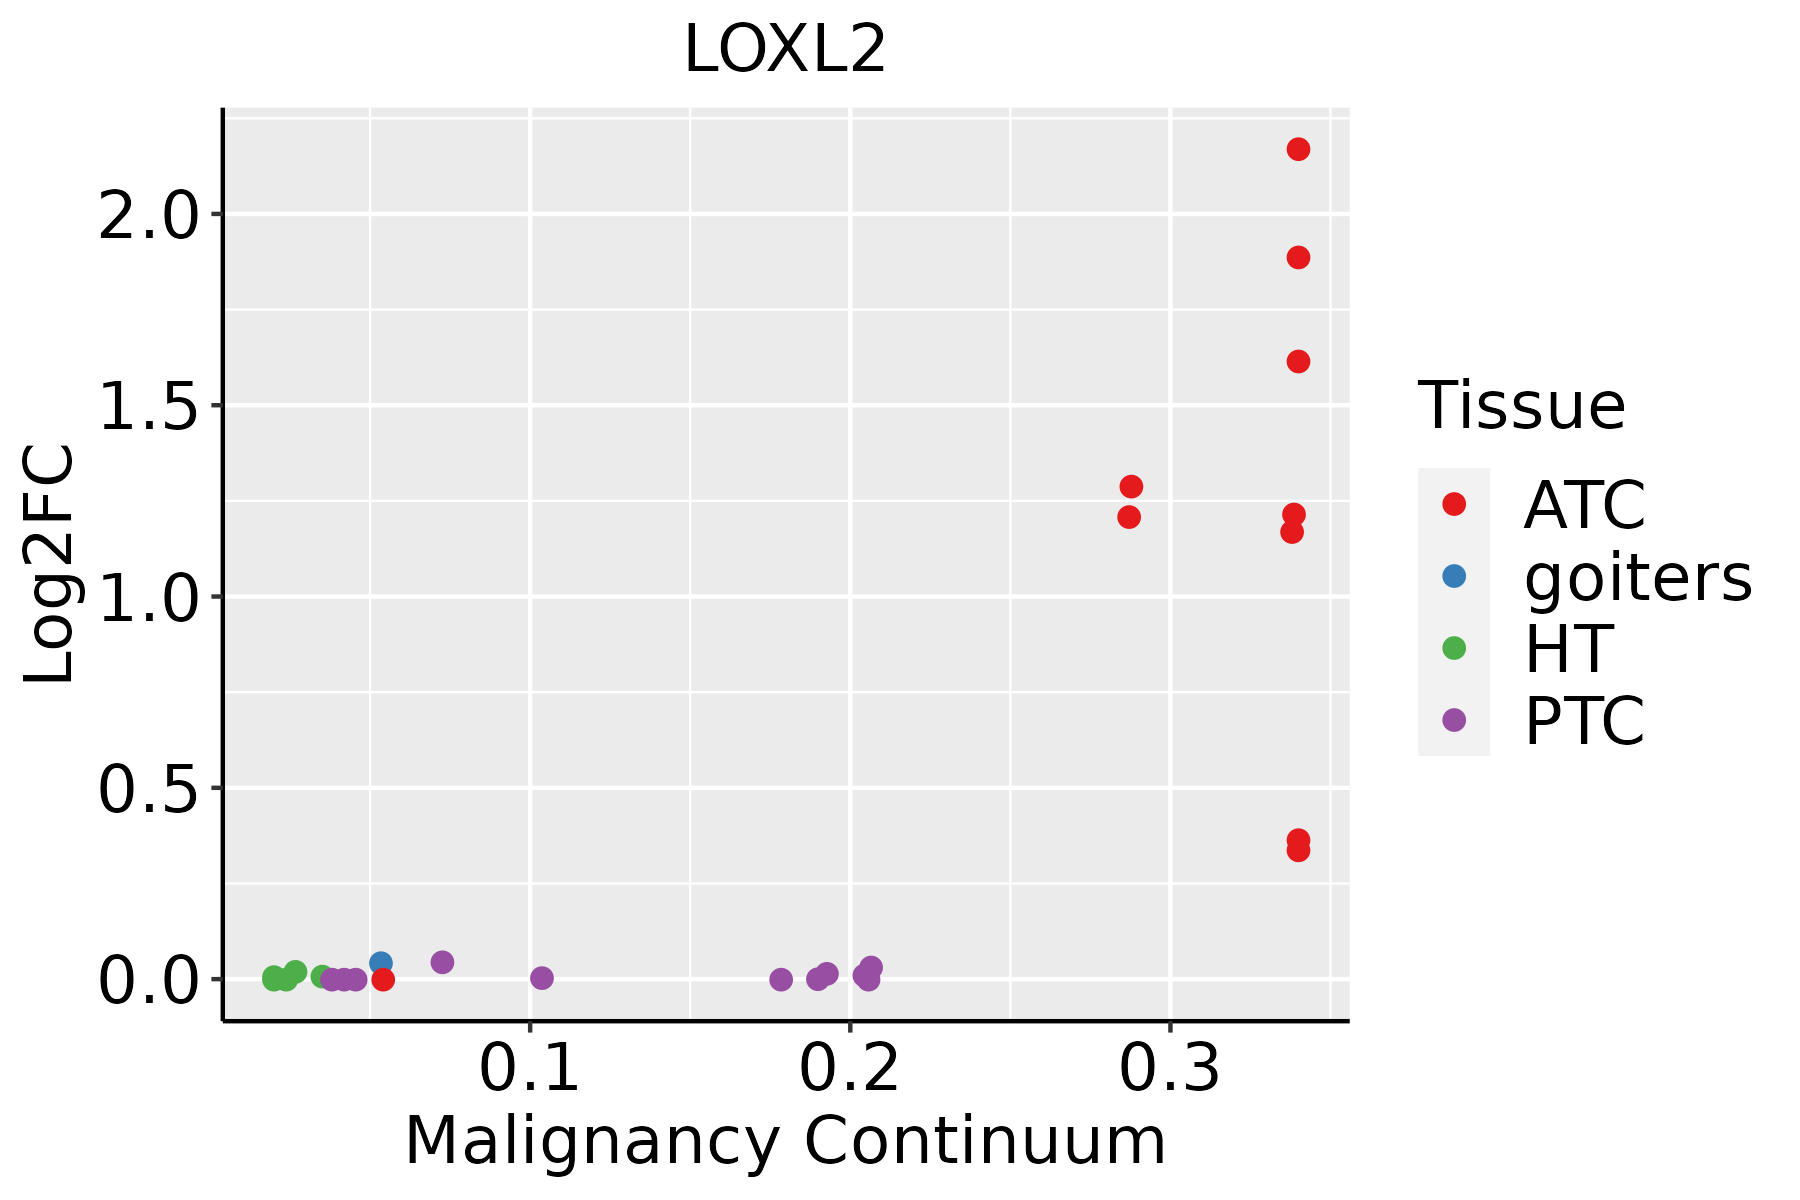 | ATC: Anaplastic thyroid cancer |
| HT: Hashimoto's thyroiditis |
| PTC: Papillary thyroid cancer |
| GO ID | Tissue | Disease Stage | Description | Gene Ratio | Bg Ratio | pvalue | p.adjust | Count |
| GO:0006091110 | Esophagus | ESCC | generation of precursor metabolites and energy | 331/8552 | 490/18723 | 3.86e-23 | 8.45e-21 | 331 |
| GO:001820514 | Esophagus | ESCC | peptidyl-lysine modification | 259/8552 | 376/18723 | 3.90e-20 | 5.26e-18 | 259 |
| GO:0022900110 | Esophagus | ESCC | electron transport chain | 133/8552 | 175/18723 | 2.18e-16 | 1.67e-14 | 133 |
| GO:0070482111 | Esophagus | ESCC | response to oxygen levels | 218/8552 | 347/18723 | 6.91e-11 | 2.17e-09 | 218 |
| GO:0036293111 | Esophagus | ESCC | response to decreased oxygen levels | 201/8552 | 322/18723 | 8.37e-10 | 2.04e-08 | 201 |
| GO:0001666111 | Esophagus | ESCC | response to hypoxia | 192/8552 | 307/18723 | 1.59e-09 | 3.69e-08 | 192 |
| GO:000632517 | Esophagus | ESCC | chromatin organization | 240/8552 | 409/18723 | 6.52e-08 | 1.14e-06 | 240 |
| GO:000756820 | Esophagus | ESCC | aging | 201/8552 | 339/18723 | 2.64e-07 | 3.94e-06 | 201 |
| GO:009872714 | Esophagus | ESCC | maintenance of cell number | 90/8552 | 134/18723 | 3.94e-07 | 5.43e-06 | 90 |
| GO:001982714 | Esophagus | ESCC | stem cell population maintenance | 88/8552 | 131/18723 | 5.23e-07 | 6.97e-06 | 88 |
| GO:00107184 | Esophagus | ESCC | positive regulation of epithelial to mesenchymal transition | 40/8552 | 52/18723 | 4.25e-06 | 4.56e-05 | 40 |
| GO:001003827 | Esophagus | ESCC | response to metal ion | 208/8552 | 373/18723 | 5.02e-05 | 3.90e-04 | 208 |
| GO:00301984 | Esophagus | ESCC | extracellular matrix organization | 171/8552 | 301/18723 | 6.08e-05 | 4.67e-04 | 171 |
| GO:00430624 | Esophagus | ESCC | extracellular structure organization | 171/8552 | 302/18723 | 7.73e-05 | 5.76e-04 | 171 |
| GO:00452294 | Esophagus | ESCC | external encapsulating structure organization | 172/8552 | 304/18723 | 7.80e-05 | 5.80e-04 | 172 |
| GO:005067318 | Esophagus | ESCC | epithelial cell proliferation | 238/8552 | 437/18723 | 1.19e-04 | 8.20e-04 | 238 |
| GO:00018378 | Esophagus | ESCC | epithelial to mesenchymal transition | 95/8552 | 157/18723 | 1.25e-04 | 8.56e-04 | 95 |
| GO:00487628 | Esophagus | ESCC | mesenchymal cell differentiation | 133/8552 | 236/18723 | 5.94e-04 | 3.22e-03 | 133 |
| GO:00107174 | Esophagus | ESCC | regulation of epithelial to mesenchymal transition | 61/8552 | 99/18723 | 1.01e-03 | 5.09e-03 | 61 |
| GO:000166720 | Esophagus | ESCC | ameboidal-type cell migration | 250/8552 | 475/18723 | 1.22e-03 | 5.97e-03 | 250 |
| Hugo Symbol | Variant Class | Variant Classification | dbSNP RS | HGVSc | HGVSp | HGVSp Short | SWISSPROT | BIOTYPE | SIFT | PolyPhen | Tumor Sample Barcode | Tissue | Histology | Sex | Age | Stage | Therapy Types | Drugs | Outcome |
| LOXL2 | SNV | Missense_Mutation | novel | c.199N>A | p.His67Asn | p.H67N | Q9Y4K0 | protein_coding | tolerated(0.24) | benign(0.087) | TCGA-5T-A9QA-01 | Breast | breast invasive carcinoma | Female | <65 | I/II | Chemotherapy | taxol | SD |
| LOXL2 | SNV | Missense_Mutation | | c.447N>C | p.Lys149Asn | p.K149N | Q9Y4K0 | protein_coding | tolerated(0.12) | benign(0.093) | TCGA-AQ-A0Y5-01 | Breast | breast invasive carcinoma | Female | >=65 | III/IV | Chemotherapy | cytoxan | SD |
| LOXL2 | insertion | In_Frame_Ins | novel | c.1901_1902insAAATGTGTGTTTAATTTGTTATTC | p.Val634_Phe635insAsnValCysLeuIleCysTyrSer | p.V634_F635insNVCLICYS | Q9Y4K0 | protein_coding | | | TCGA-A2-A0CT-01 | Breast | breast invasive carcinoma | Female | >=65 | I/II | Chemotherapy | cytoxan | SD |
| LOXL2 | deletion | Frame_Shift_Del | novel | c.1615delN | p.Ala539ProfsTer103 | p.A539Pfs*103 | Q9Y4K0 | protein_coding | | | TCGA-D8-A27V-01 | Breast | breast invasive carcinoma | Female | <65 | I/II | Hormone Therapy | tamoxiphen | SD |
| LOXL2 | SNV | Missense_Mutation | rs768171524 | c.2212N>A | p.Gly738Ser | p.G738S | Q9Y4K0 | protein_coding | deleterious(0.01) | probably_damaging(0.993) | TCGA-2W-A8YY-01 | Cervix | cervical & endocervical cancer | Female | <65 | I/II | Chemotherapy | cisplatin | CR |
| LOXL2 | SNV | Missense_Mutation | novel | c.877N>C | p.Asn293His | p.N293H | Q9Y4K0 | protein_coding | tolerated(0.32) | benign(0.007) | TCGA-2W-A8YY-01 | Cervix | cervical & endocervical cancer | Female | <65 | I/II | Chemotherapy | cisplatin | CR |
| LOXL2 | SNV | Missense_Mutation | novel | c.1295N>G | p.Gln432Arg | p.Q432R | Q9Y4K0 | protein_coding | deleterious(0.03) | benign(0.009) | TCGA-C5-A2LZ-01 | Cervix | cervical & endocervical cancer | Female | >=65 | III/IV | Unknown | Unknown | PD |
| LOXL2 | SNV | Missense_Mutation | novel | c.96N>A | p.His32Gln | p.H32Q | Q9Y4K0 | protein_coding | tolerated_low_confidence(0.12) | benign(0) | TCGA-VS-A953-01 | Cervix | cervical & endocervical cancer | Female | <65 | I/II | Unknown | Unknown | PD |
| LOXL2 | SNV | Missense_Mutation | rs748831417 | c.1322N>A | p.Arg441His | p.R441H | Q9Y4K0 | protein_coding | deleterious(0) | probably_damaging(1) | TCGA-VS-A9UJ-01 | Cervix | cervical & endocervical cancer | Female | <65 | I/II | Unknown | Unknown | PD |
| LOXL2 | SNV | Missense_Mutation | rs755780161 | c.2068C>T | p.Arg690Cys | p.R690C | Q9Y4K0 | protein_coding | deleterious(0) | probably_damaging(1) | TCGA-A6-6653-01 | Colorectum | colon adenocarcinoma | Male | >=65 | I/II | Unknown | Unknown | SD |
| Entrez ID | Symbol | Category | Interaction Types | Drug Claim Name | Drug Name | PMIDs |
| 4017 | LOXL2 | DRUGGABLE GENOME, TRANSCRIPTION FACTOR, ENZYME | | GS-6624 | SIMTUZUMAB | |
| 4017 | LOXL2 | DRUGGABLE GENOME, TRANSCRIPTION FACTOR, ENZYME | inhibitor | 385612245 | | |
| 4017 | LOXL2 | DRUGGABLE GENOME, TRANSCRIPTION FACTOR, ENZYME | inhibitor | CHEMBL2109667 | SIMTUZUMAB | |
| 4017 | LOXL2 | DRUGGABLE GENOME, TRANSCRIPTION FACTOR, ENZYME | inhibitor | 385612244 | | |
| 4017 | LOXL2 | DRUGGABLE GENOME, TRANSCRIPTION FACTOR, ENZYME | inhibitor | 252166622 | SIMTUZUMAB | |


