
|
|||||
|
 | |
| |
| |
| |
| |
| |
|
Gene: LOXL1 |
Gene summary for LOXL1 |
| Gene information | Species | Human | Gene symbol | LOXL1 | Gene ID | 4016 |
| Gene name | lysyl oxidase like 1 | |
| Gene Alias | LOL | |
| Cytomap | 15q24.1 | |
| Gene Type | protein-coding | GO ID | GO:0001568 | UniProtAcc | Q08397 |
Top |
Malignant transformation analysis |
| Identification of the aberrant gene expression in precancerous and cancerous lesions by comparing the gene expression of stem-like cells in diseased tissues with normal stem cells |
| Entrez ID | Symbol | Replicates | Species | Organ | Tissue | Adj P-value | Log2FC | Malignancy |
| 4016 | LOXL1 | P2T-E | Human | Esophagus | ESCC | 2.13e-27 | 3.66e-01 | 0.1177 |
| 4016 | LOXL1 | P4T-E | Human | Esophagus | ESCC | 2.22e-16 | 4.36e-01 | 0.1323 |
| 4016 | LOXL1 | P5T-E | Human | Esophagus | ESCC | 1.39e-02 | 1.73e-01 | 0.1327 |
| 4016 | LOXL1 | P8T-E | Human | Esophagus | ESCC | 2.93e-15 | 2.83e-01 | 0.0889 |
| 4016 | LOXL1 | P9T-E | Human | Esophagus | ESCC | 5.59e-03 | 1.97e-01 | 0.1131 |
| 4016 | LOXL1 | P10T-E | Human | Esophagus | ESCC | 1.80e-47 | 8.10e-01 | 0.116 |
| 4016 | LOXL1 | P11T-E | Human | Esophagus | ESCC | 4.94e-06 | 3.58e-01 | 0.1426 |
| 4016 | LOXL1 | P12T-E | Human | Esophagus | ESCC | 2.62e-08 | 2.41e-01 | 0.1122 |
| 4016 | LOXL1 | P16T-E | Human | Esophagus | ESCC | 6.08e-14 | 2.56e-01 | 0.1153 |
| 4016 | LOXL1 | P19T-E | Human | Esophagus | ESCC | 1.41e-09 | 4.73e-01 | 0.1662 |
| 4016 | LOXL1 | P21T-E | Human | Esophagus | ESCC | 2.28e-06 | 2.17e-01 | 0.1617 |
| 4016 | LOXL1 | P22T-E | Human | Esophagus | ESCC | 5.79e-16 | 2.77e-01 | 0.1236 |
| 4016 | LOXL1 | P24T-E | Human | Esophagus | ESCC | 4.30e-10 | 2.18e-01 | 0.1287 |
| 4016 | LOXL1 | P26T-E | Human | Esophagus | ESCC | 8.12e-22 | 4.40e-01 | 0.1276 |
| 4016 | LOXL1 | P27T-E | Human | Esophagus | ESCC | 3.69e-11 | 2.40e-01 | 0.1055 |
| 4016 | LOXL1 | P28T-E | Human | Esophagus | ESCC | 9.96e-03 | 9.80e-02 | 0.1149 |
| 4016 | LOXL1 | P30T-E | Human | Esophagus | ESCC | 9.28e-08 | 3.62e-01 | 0.137 |
| 4016 | LOXL1 | P32T-E | Human | Esophagus | ESCC | 6.98e-03 | 1.66e-01 | 0.1666 |
| 4016 | LOXL1 | P36T-E | Human | Esophagus | ESCC | 7.16e-03 | 2.47e-01 | 0.1187 |
| 4016 | LOXL1 | P37T-E | Human | Esophagus | ESCC | 1.84e-22 | 5.54e-01 | 0.1371 |
| Page: 1 2 3 |
| Tissue | Expression Dynamics | Abbreviation |
| Esophagus | 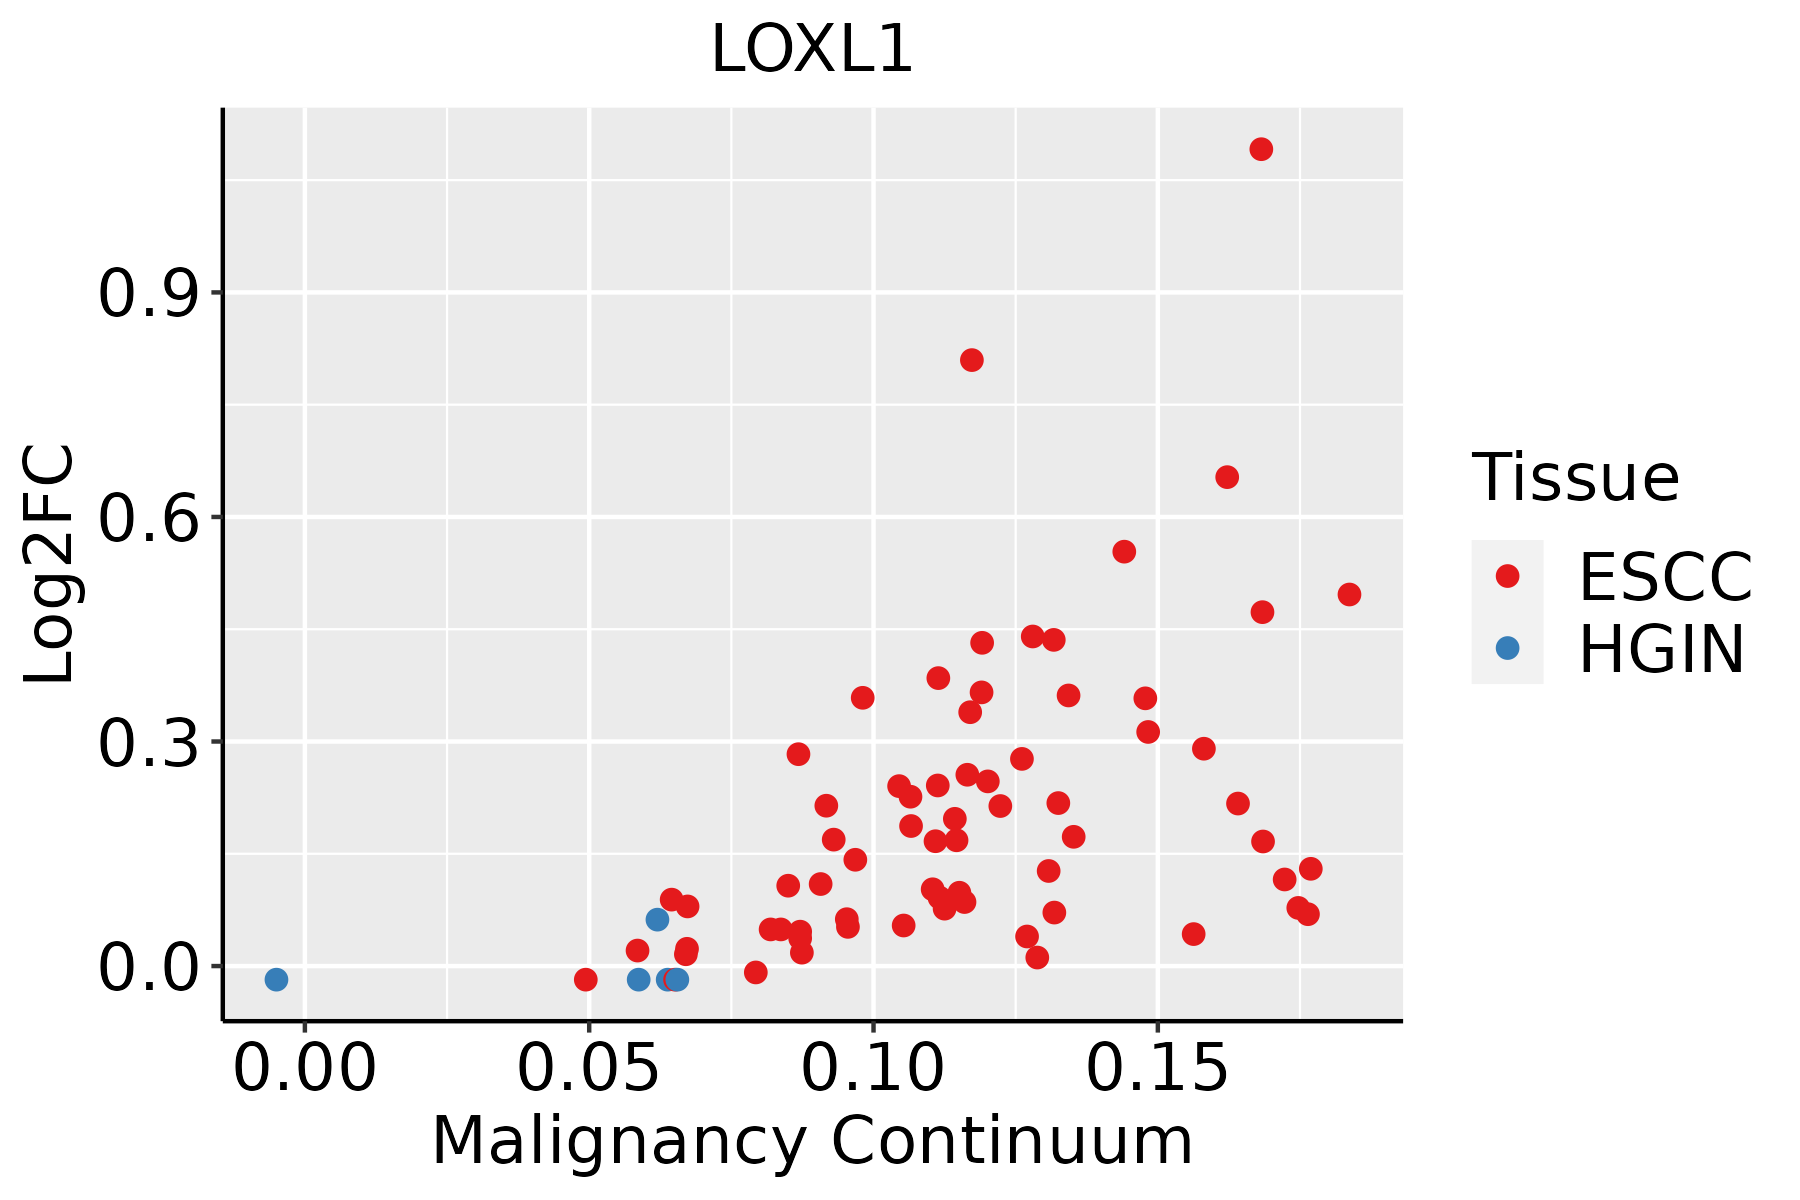 | ESCC: Esophageal squamous cell carcinoma |
| HGIN: High-grade intraepithelial neoplasias | ||
| LGIN: Low-grade intraepithelial neoplasias | ||
| Oral Cavity |  | EOLP: Erosive Oral lichen planus |
| LP: leukoplakia | ||
| NEOLP: Non-erosive oral lichen planus | ||
| OSCC: Oral squamous cell carcinoma | ||
| Thyroid | 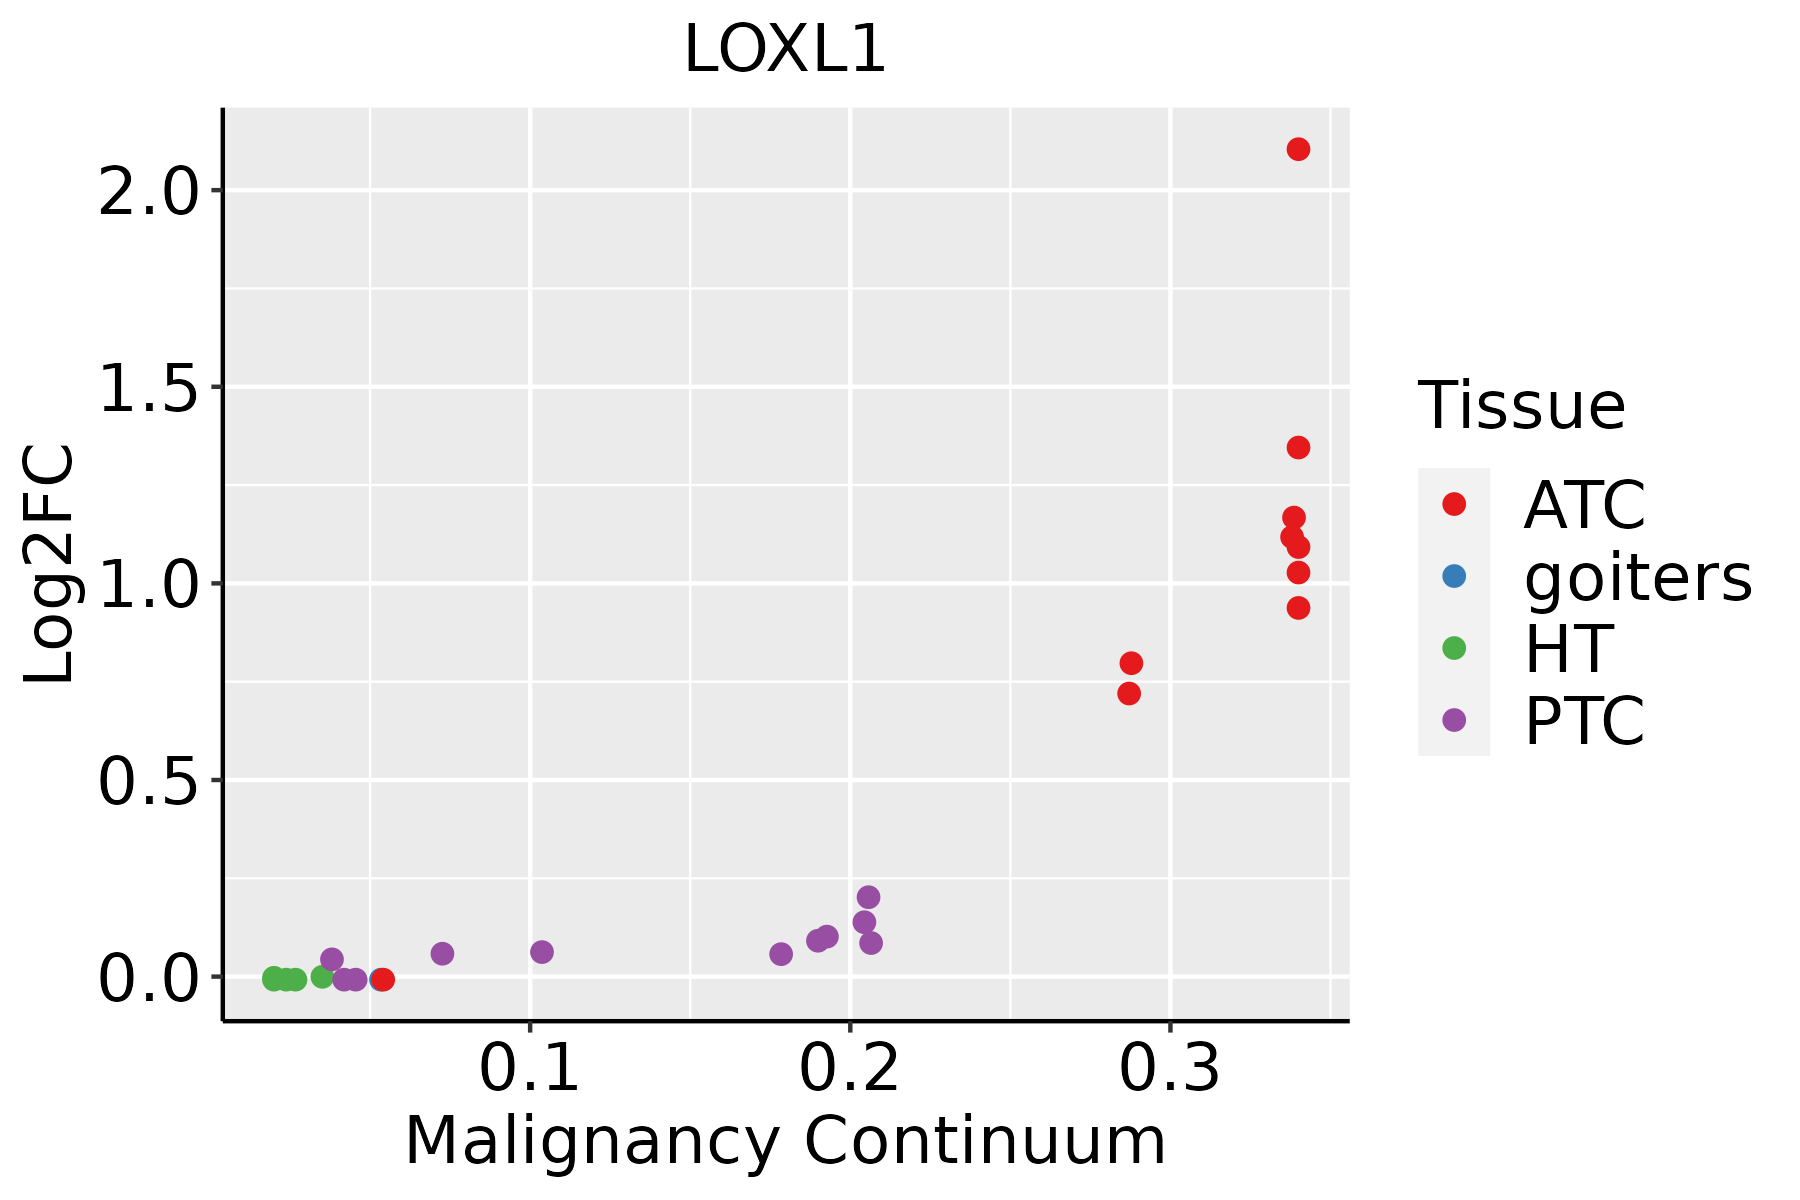 | ATC: Anaplastic thyroid cancer |
| HT: Hashimoto's thyroiditis | ||
| PTC: Papillary thyroid cancer |
| ∗log2FC in expression of this searched gene in stem-like cells from each diseased tissue sample relative to stem-like cells in normal samples in each tissue plotted against the malignancy continuum. Samples are colored based on if they are from different disease stage. |
Top |
Malignant transformation related pathway analysis |
| Find out the enriched GO biological processes and KEGG pathways involved in transition from healthy to precancer to cancer |
| Tissue | Disease Stage | Enriched GO biological Processes |
| Colorectum | AD |  |
| Colorectum | SER |  |
| Colorectum | MSS |  |
| Colorectum | MSI-H |  |
| Colorectum | FAP |  |
| ∗Top 15 enriched GO BP terms are showed in the bar plot of each disease state in each tissue. Each row represents a significant GO biological process which is colored according to the -log10(p.adjust). |
| Page: 1 2 3 4 5 6 7 8 9 |
| GO ID | Tissue | Disease Stage | Description | Gene Ratio | Bg Ratio | pvalue | p.adjust | Count |
| GO:001820514 | Esophagus | ESCC | peptidyl-lysine modification | 259/8552 | 376/18723 | 3.90e-20 | 5.26e-18 | 259 |
| GO:00301984 | Esophagus | ESCC | extracellular matrix organization | 171/8552 | 301/18723 | 6.08e-05 | 4.67e-04 | 171 |
| GO:00430624 | Esophagus | ESCC | extracellular structure organization | 171/8552 | 302/18723 | 7.73e-05 | 5.76e-04 | 171 |
| GO:00452294 | Esophagus | ESCC | external encapsulating structure organization | 172/8552 | 304/18723 | 7.80e-05 | 5.80e-04 | 172 |
| GO:003249619 | Esophagus | ESCC | response to lipopolysaccharide | 191/8552 | 343/18723 | 1.11e-04 | 7.73e-04 | 191 |
| GO:00301993 | Esophagus | ESCC | collagen fibril organization | 40/8552 | 61/18723 | 1.35e-03 | 6.44e-03 | 40 |
| GO:000223719 | Esophagus | ESCC | response to molecule of bacterial origin | 194/8552 | 363/18723 | 1.64e-03 | 7.61e-03 | 194 |
| GO:00182056 | Oral cavity | OSCC | peptidyl-lysine modification | 216/7305 | 376/18723 | 2.32e-13 | 1.16e-11 | 216 |
| GO:003249617 | Oral cavity | OSCC | response to lipopolysaccharide | 178/7305 | 343/18723 | 7.27e-07 | 1.03e-05 | 178 |
| GO:000223717 | Oral cavity | OSCC | response to molecule of bacterial origin | 181/7305 | 363/18723 | 1.48e-05 | 1.49e-04 | 181 |
| GO:00301983 | Oral cavity | OSCC | extracellular matrix organization | 146/7305 | 301/18723 | 4.67e-04 | 2.77e-03 | 146 |
| GO:00452293 | Oral cavity | OSCC | external encapsulating structure organization | 147/7305 | 304/18723 | 5.30e-04 | 3.08e-03 | 147 |
| GO:00430623 | Oral cavity | OSCC | extracellular structure organization | 146/7305 | 302/18723 | 5.59e-04 | 3.23e-03 | 146 |
| GO:001820513 | Oral cavity | LP | peptidyl-lysine modification | 136/4623 | 376/18723 | 3.64e-07 | 1.06e-05 | 136 |
| GO:003249618 | Oral cavity | LP | response to lipopolysaccharide | 112/4623 | 343/18723 | 4.90e-04 | 4.60e-03 | 112 |
| GO:000223718 | Oral cavity | LP | response to molecule of bacterial origin | 115/4623 | 363/18723 | 1.42e-03 | 1.13e-02 | 115 |
| GO:00182059 | Thyroid | PTC | peptidyl-lysine modification | 188/5968 | 376/18723 | 1.34e-13 | 7.09e-12 | 188 |
| GO:00301986 | Thyroid | PTC | extracellular matrix organization | 124/5968 | 301/18723 | 3.75e-04 | 2.53e-03 | 124 |
| GO:00430626 | Thyroid | PTC | extracellular structure organization | 124/5968 | 302/18723 | 4.38e-04 | 2.92e-03 | 124 |
| GO:00452296 | Thyroid | PTC | external encapsulating structure organization | 124/5968 | 304/18723 | 5.96e-04 | 3.79e-03 | 124 |
| Page: 1 2 |
| Pathway ID | Tissue | Disease Stage | Description | Gene Ratio | Bg Ratio | pvalue | p.adjust | qvalue | Count |
| Page: 1 |
Top |
Cell-cell communication analysis |
| Identification of potential cell-cell interactions between two cell types and their ligand-receptor pairs for different disease states |
| Ligand | Receptor | LRpair | Pathway | Tissue | Disease Stage |
| Page: 1 |
Top |
Single-cell gene regulatory network inference analysis |
| Find out the significant the regulons (TFs) and the target genes of each regulon across cell types for different disease states |
| TF | Cell Type | Tissue | Disease Stage | Target Gene | RSS | Regulon Activity |
| ∗The dot plots of a searched regulon are shown for all cell subpopulations in each disease state of each tissue based on the regulon specific score inferred using pySCENIC and by calculating the average expression. |
| Page: 1 |
Top |
Somatic mutation of malignant transformation related genes |
| Annotation of somatic variants for genes involved in malignant transformation |
| Hugo Symbol | Variant Class | Variant Classification | dbSNP RS | HGVSc | HGVSp | HGVSp Short | SWISSPROT | BIOTYPE | SIFT | PolyPhen | Tumor Sample Barcode | Tissue | Histology | Sex | Age | Stage | Therapy Types | Drugs | Outcome |
| LOXL1 | SNV | Missense_Mutation | c.1388T>C | p.Leu463Pro | p.L463P | Q08397 | protein_coding | deleterious(0) | probably_damaging(0.999) | TCGA-C8-A12V-01 | Breast | breast invasive carcinoma | Female | <65 | I/II | Unknown | Unknown | SD | |
| LOXL1 | SNV | Missense_Mutation | c.1684N>T | p.Arg562Cys | p.R562C | Q08397 | protein_coding | deleterious(0) | probably_damaging(0.998) | TCGA-A6-6141-01 | Colorectum | colon adenocarcinoma | Male | <65 | I/II | Chemotherapy | 5-fu | SD | |
| LOXL1 | SNV | Missense_Mutation | rs199938623 | c.1190N>T | p.Ala397Val | p.A397V | Q08397 | protein_coding | deleterious(0) | probably_damaging(0.996) | TCGA-AZ-6603-01 | Colorectum | colon adenocarcinoma | Female | >=65 | I/II | Unknown | Unknown | SD |
| LOXL1 | SNV | Missense_Mutation | c.1711A>C | p.Ile571Leu | p.I571L | Q08397 | protein_coding | tolerated(0.12) | benign(0.191) | TCGA-DM-A1DA-01 | Colorectum | colon adenocarcinoma | Female | >=65 | III/IV | Unknown | Unknown | SD | |
| LOXL1 | SNV | Missense_Mutation | c.1288N>T | p.Gly430Cys | p.G430C | Q08397 | protein_coding | deleterious(0) | probably_damaging(1) | TCGA-DM-A1HB-01 | Colorectum | colon adenocarcinoma | Male | >=65 | III/IV | Unknown | Unknown | SD | |
| LOXL1 | SNV | Missense_Mutation | rs772638560 | c.1573N>A | p.Asp525Asn | p.D525N | Q08397 | protein_coding | deleterious(0) | probably_damaging(0.968) | TCGA-A5-A0G2-01 | Endometrium | uterine corpus endometrioid carcinoma | Female | <65 | III/IV | Unknown | Unknown | SD |
| LOXL1 | SNV | Missense_Mutation | novel | c.1450N>A | p.Asp484Asn | p.D484N | Q08397 | protein_coding | deleterious(0) | probably_damaging(0.997) | TCGA-AJ-A2QN-01 | Endometrium | uterine corpus endometrioid carcinoma | Female | <65 | I/II | Unknown | Unknown | SD |
| LOXL1 | SNV | Missense_Mutation | novel | c.1271A>G | p.Gln424Arg | p.Q424R | Q08397 | protein_coding | deleterious(0.02) | benign(0.022) | TCGA-AP-A1DM-01 | Endometrium | uterine corpus endometrioid carcinoma | Female | <65 | I/II | Unknown | Unknown | SD |
| LOXL1 | SNV | Missense_Mutation | rs371856329 | c.1243G>A | p.Asp415Asn | p.D415N | Q08397 | protein_coding | deleterious(0.01) | possibly_damaging(0.454) | TCGA-AX-A0J0-01 | Endometrium | uterine corpus endometrioid carcinoma | Female | <65 | I/II | Unknown | Unknown | SD |
| LOXL1 | SNV | Missense_Mutation | rs767663121 | c.1261C>T | p.Arg421Cys | p.R421C | Q08397 | protein_coding | deleterious(0) | probably_damaging(0.998) | TCGA-AX-A2HC-01 | Endometrium | uterine corpus endometrioid carcinoma | Female | <65 | III/IV | Chemotherapy | paclitaxel | PD |
| Page: 1 2 3 4 |
Top |
Related drugs of malignant transformation related genes |
| Identification of chemicals and drugs interact with genes involved in malignant transfromation |
| (DGIdb 4.0) |
| Entrez ID | Symbol | Category | Interaction Types | Drug Claim Name | Drug Name | PMIDs |
| Page: 1 |

Copyright 2023-Present -The University of Texas Health Science Center at Houston |