
|
|||||
|
 | |
| |
| |
| |
| |
| |
|
Gene: LONRF2 |
Gene summary for LONRF2 |
| Gene information | Species | Human | Gene symbol | LONRF2 | Gene ID | 164832 |
| Gene name | LON peptidase N-terminal domain and ring finger 2 | |
| Gene Alias | RNF192 | |
| Cytomap | 2q11.2 | |
| Gene Type | protein-coding | GO ID | GO:0003674 | UniProtAcc | Q1L5Z9 |
Top |
Malignant transformation analysis |
| Identification of the aberrant gene expression in precancerous and cancerous lesions by comparing the gene expression of stem-like cells in diseased tissues with normal stem cells |
| Entrez ID | Symbol | Replicates | Species | Organ | Tissue | Adj P-value | Log2FC | Malignancy |
| 164832 | LONRF2 | HTA12-15-2 | Human | Pancreas | PDAC | 5.50e-06 | 5.71e-01 | 0.2315 |
| 164832 | LONRF2 | HTA12-23-1 | Human | Pancreas | PDAC | 1.72e-06 | 8.41e-01 | 0.3405 |
| 164832 | LONRF2 | HTA12-25-1 | Human | Pancreas | PDAC | 3.32e-03 | 5.46e-01 | 0.313 |
| 164832 | LONRF2 | HTA12-26-1 | Human | Pancreas | PDAC | 4.09e-29 | 1.19e+00 | 0.3728 |
| 164832 | LONRF2 | HTA12-29-1 | Human | Pancreas | PDAC | 5.66e-47 | 1.04e+00 | 0.3722 |
| 164832 | LONRF2 | PTCwithHT_8 | Human | Thyroid | HT | 1.09e-02 | -1.33e-01 | 0.0351 |
| 164832 | LONRF2 | male-WTA | Human | Thyroid | PTC | 9.44e-39 | 4.65e-01 | 0.1037 |
| 164832 | LONRF2 | PTC01 | Human | Thyroid | PTC | 1.29e-31 | 1.15e+00 | 0.1899 |
| 164832 | LONRF2 | PTC03 | Human | Thyroid | PTC | 3.69e-06 | 5.88e-01 | 0.1784 |
| 164832 | LONRF2 | PTC04 | Human | Thyroid | PTC | 4.52e-38 | 1.10e+00 | 0.1927 |
| 164832 | LONRF2 | PTC05 | Human | Thyroid | PTC | 1.17e-33 | 1.83e+00 | 0.2065 |
| 164832 | LONRF2 | PTC06 | Human | Thyroid | PTC | 1.34e-82 | 2.56e+00 | 0.2057 |
| 164832 | LONRF2 | PTC07 | Human | Thyroid | PTC | 1.24e-85 | 2.02e+00 | 0.2044 |
| 164832 | LONRF2 | ATC12 | Human | Thyroid | ATC | 1.09e-02 | -1.39e-01 | 0.34 |
| 164832 | LONRF2 | ATC13 | Human | Thyroid | ATC | 6.23e-21 | 1.54e-01 | 0.34 |
| 164832 | LONRF2 | ATC5 | Human | Thyroid | ATC | 6.69e-15 | 1.67e-01 | 0.34 |
| Page: 1 |
| Tissue | Expression Dynamics | Abbreviation |
| Thyroid | 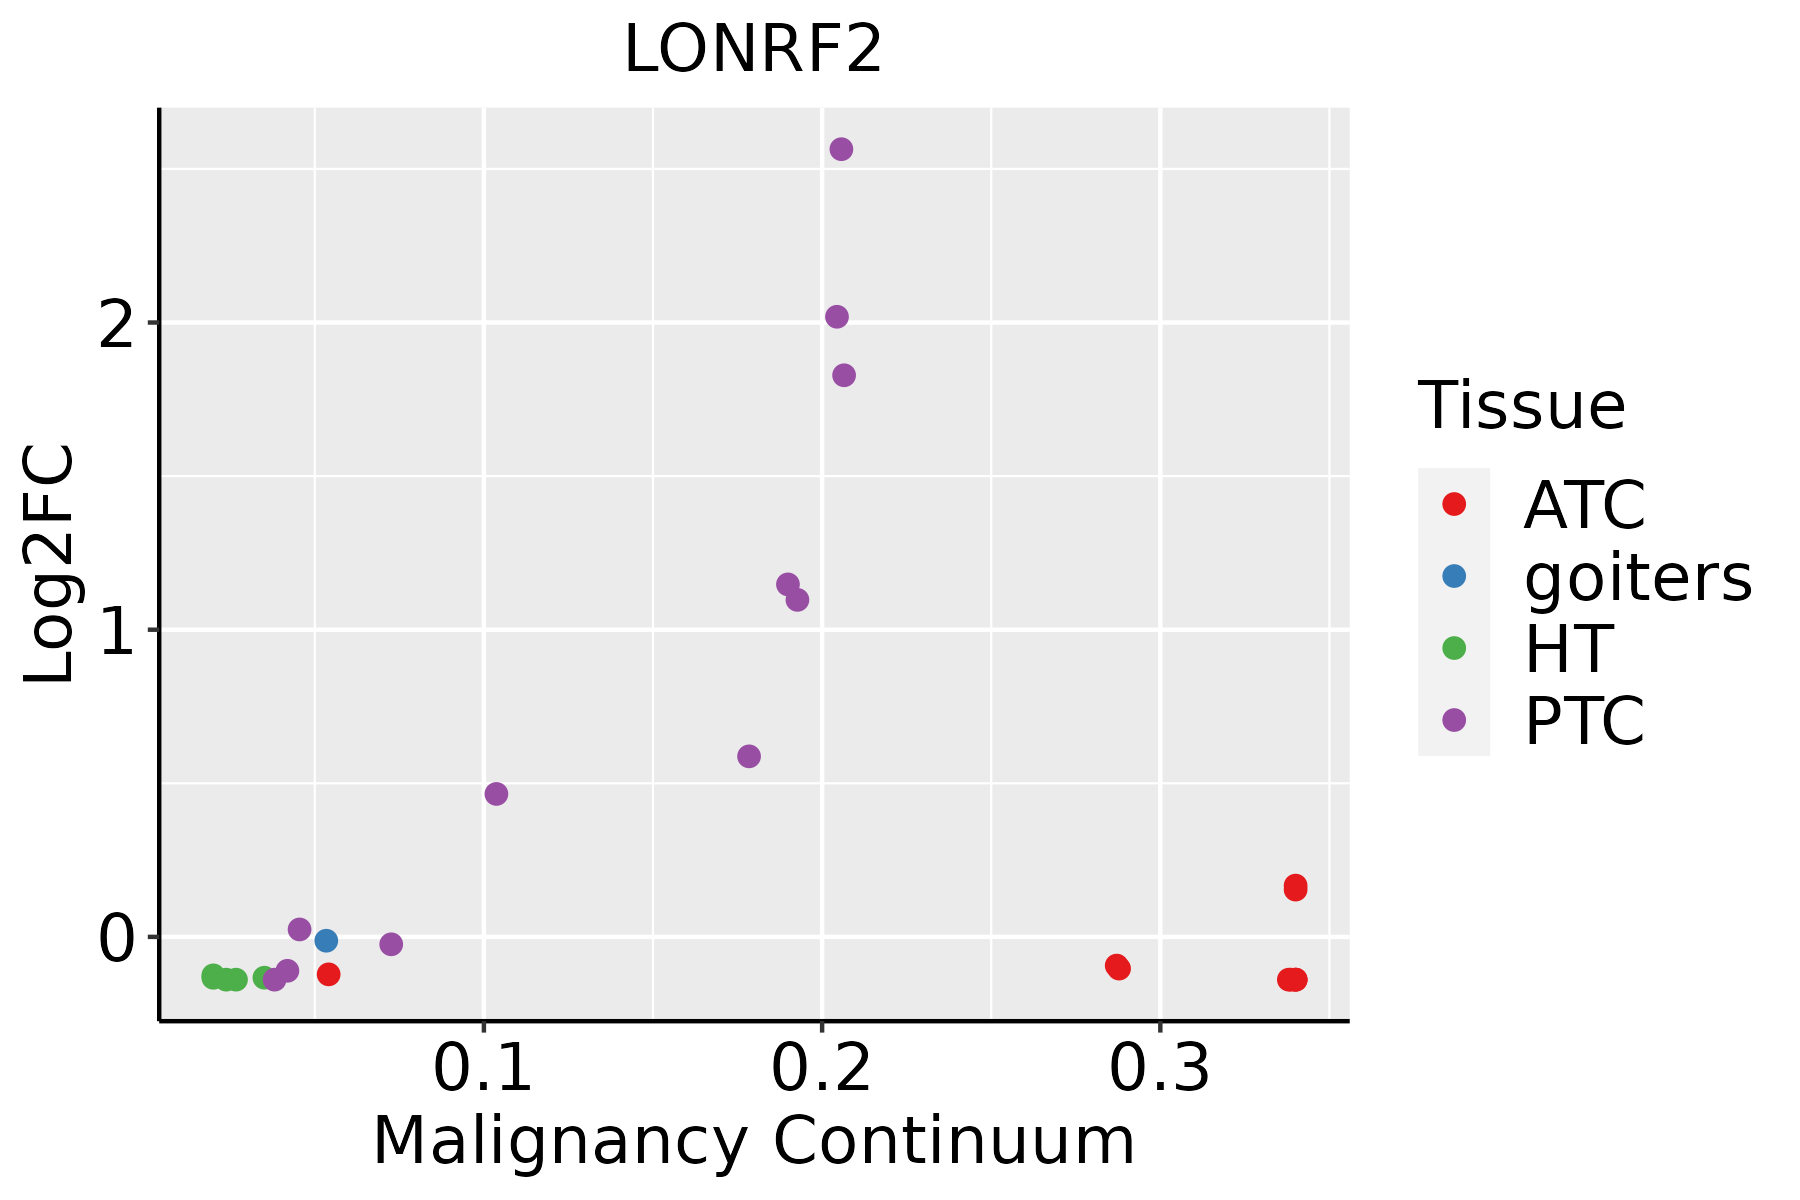 | ATC: Anaplastic thyroid cancer |
| HT: Hashimoto's thyroiditis | ||
| PTC: Papillary thyroid cancer |
| ∗log2FC in expression of this searched gene in stem-like cells from each diseased tissue sample relative to stem-like cells in normal samples in each tissue plotted against the malignancy continuum. Samples are colored based on if they are from different disease stage. |
Top |
Malignant transformation related pathway analysis |
| Find out the enriched GO biological processes and KEGG pathways involved in transition from healthy to precancer to cancer |
| Tissue | Disease Stage | Enriched GO biological Processes |
| Colorectum | AD |  |
| Colorectum | SER |  |
| Colorectum | MSS |  |
| Colorectum | MSI-H |  |
| Colorectum | FAP |  |
| ∗Top 15 enriched GO BP terms are showed in the bar plot of each disease state in each tissue. Each row represents a significant GO biological process which is colored according to the -log10(p.adjust). |
| Page: 1 2 3 4 5 6 7 8 9 |
| GO ID | Tissue | Disease Stage | Description | Gene Ratio | Bg Ratio | pvalue | p.adjust | Count |
| Page: 1 |
| Pathway ID | Tissue | Disease Stage | Description | Gene Ratio | Bg Ratio | pvalue | p.adjust | qvalue | Count |
| Page: 1 |
Top |
Cell-cell communication analysis |
| Identification of potential cell-cell interactions between two cell types and their ligand-receptor pairs for different disease states |
| Ligand | Receptor | LRpair | Pathway | Tissue | Disease Stage |
| Page: 1 |
Top |
Single-cell gene regulatory network inference analysis |
| Find out the significant the regulons (TFs) and the target genes of each regulon across cell types for different disease states |
| TF | Cell Type | Tissue | Disease Stage | Target Gene | RSS | Regulon Activity |
| ∗The dot plots of a searched regulon are shown for all cell subpopulations in each disease state of each tissue based on the regulon specific score inferred using pySCENIC and by calculating the average expression. |
| Page: 1 |
Top |
Somatic mutation of malignant transformation related genes |
| Annotation of somatic variants for genes involved in malignant transformation |
| Hugo Symbol | Variant Class | Variant Classification | dbSNP RS | HGVSc | HGVSp | HGVSp Short | SWISSPROT | BIOTYPE | SIFT | PolyPhen | Tumor Sample Barcode | Tissue | Histology | Sex | Age | Stage | Therapy Types | Drugs | Outcome |
| LONRF2 | SNV | Missense_Mutation | c.1604C>A | p.Thr535Asn | p.T535N | Q1L5Z9 | protein_coding | tolerated(1) | benign(0.084) | TCGA-AR-A0U0-01 | Breast | breast invasive carcinoma | Female | >=65 | I/II | Unknown | Unknown | SD | |
| LONRF2 | SNV | Missense_Mutation | c.2038N>T | p.Gly680Trp | p.G680W | Q1L5Z9 | protein_coding | deleterious(0) | probably_damaging(1) | TCGA-BH-A0DK-01 | Breast | breast invasive carcinoma | Female | <65 | I/II | Hormone Therapy | tamoxiphen | SD | |
| LONRF2 | SNV | Missense_Mutation | c.775N>G | p.Gln259Glu | p.Q259E | Q1L5Z9 | protein_coding | deleterious(0.02) | benign(0.407) | TCGA-D8-A1XQ-01 | Breast | breast invasive carcinoma | Female | >=65 | I/II | Unknown | Unknown | SD | |
| LONRF2 | SNV | Missense_Mutation | c.1563G>C | p.Lys521Asn | p.K521N | Q1L5Z9 | protein_coding | deleterious(0) | possibly_damaging(0.596) | TCGA-D8-A27G-01 | Breast | breast invasive carcinoma | Female | >=65 | I/II | Unknown | Unknown | SD | |
| LONRF2 | SNV | Missense_Mutation | c.1994C>G | p.Ala665Gly | p.A665G | Q1L5Z9 | protein_coding | tolerated(0.33) | benign(0.378) | TCGA-OL-A66I-01 | Breast | breast invasive carcinoma | Female | <65 | I/II | Chemotherapy | adriamycin | CR | |
| LONRF2 | deletion | Frame_Shift_Del | c.1764_1807delAGAGTATGGATGCATGCTGGAGATTAAGGACGTGAGAACGTTTC | p.Glu589Ter | p.E589* | Q1L5Z9 | protein_coding | TCGA-A2-A04T-01 | Breast | breast invasive carcinoma | Female | <65 | I/II | Chemotherapy | cyclophosphamide | SD | |||
| LONRF2 | SNV | Missense_Mutation | rs760683755 | c.1993N>A | p.Ala665Thr | p.A665T | Q1L5Z9 | protein_coding | tolerated(1) | benign(0.01) | TCGA-C5-A1MK-01 | Cervix | cervical & endocervical cancer | Female | >=65 | III/IV | Chemotherapy | carboplatin | PD |
| LONRF2 | SNV | Missense_Mutation | c.713C>T | p.Ala238Val | p.A238V | Q1L5Z9 | protein_coding | tolerated(0.08) | possibly_damaging(0.826) | TCGA-EK-A2PG-01 | Cervix | cervical & endocervical cancer | Female | >=65 | I/II | Unknown | Unknown | SD | |
| LONRF2 | SNV | Missense_Mutation | rs143848902 | c.1795N>A | p.Val599Met | p.V599M | Q1L5Z9 | protein_coding | deleterious(0) | probably_damaging(0.997) | TCGA-EK-A2PL-01 | Cervix | cervical & endocervical cancer | Female | <65 | III/IV | Unknown | Unknown | SD |
| LONRF2 | SNV | Missense_Mutation | c.1303N>A | p.Glu435Lys | p.E435K | Q1L5Z9 | protein_coding | tolerated(0.85) | benign(0.001) | TCGA-IR-A3LK-01 | Cervix | cervical & endocervical cancer | Female | >=65 | I/II | Chemotherapy | cisplatin | PD |
| Page: 1 2 3 4 5 6 7 |
Top |
Related drugs of malignant transformation related genes |
| Identification of chemicals and drugs interact with genes involved in malignant transfromation |
| (DGIdb 4.0) |
| Entrez ID | Symbol | Category | Interaction Types | Drug Claim Name | Drug Name | PMIDs |
| Page: 1 |

Copyright 2023-Present -The University of Texas Health Science Center at Houston |