Schematic overview of the cellular and molecular mechanisms involved in the cancer progression, including the proposed cellular and molecular mechanisms in cancer cells trajectory. AT1: alveolar type 1 cells; AT2: alveolar type 2 cells; AAH: atypical adenomatous hyperplasia; AIS: adenocarcinoma in situ; MIA: minimally invasive adenocarcinoma; IA: invasive adenocarcinoma; EMT: epithelial-mesenchymal transition

Home

Download

Statistics

Help

Contact

Center for Computational Systems Medicine
leaf

Gene summary

leaf

Malignant transformation analysis

leaf

Malignant transformation related pathway analysis

leaf

Cell-cell communication analysis

leaf

Single-cell gene regulatory network inference analysis

leaf

Somatic mutation of malignant transformation related genes

leaf

Related drugs of malignant transformation related genes

Gene: LONP2

Gene summary for LONP2

check button Gene summary.

Gene informationSpeciesHuman
Gene symbol

LONP2

Gene ID

83752

Gene namelon peptidase 2, peroxisomal
Gene AliasLONP
Cytomap16q12.1
Gene Typeprotein-coding
GO ID

GO:0006082

UniProtAcc

Q86WA8


Top

Malignant transformation analysis

check button Identification of the aberrant gene expression in precancerous and cancerous lesions by comparing the gene expression of stem-like cells in diseased tissues with normal stem cells
check button Malignant transformation involving gene list.
Entrez IDSymbolReplicatesSpeciesOrganTissueAdj P-valueLog2FCMalignancy
83752LONP2GSM4909289HumanBreastIDC3.07e-025.74e-010.1064
83752LONP2GSM4909297HumanBreastIDC2.81e-021.08e-010.1517
83752LONP2GSM4909304HumanBreastIDC8.33e-042.99e-010.1636
83752LONP2GSM4909311HumanBreastIDC5.60e-11-1.18e-010.1534
83752LONP2GSM4909312HumanBreastIDC8.60e-041.11e-010.1552
83752LONP2GSM4909319HumanBreastIDC3.24e-12-1.63e-010.1563
83752LONP2GSM4909321HumanBreastIDC1.00e-04-4.28e-020.1559
83752LONP2NCCBC6HumanBreastDCIS2.58e-036.34e-010.2095
83752LONP2P1HumanBreastIDC2.62e-045.55e-020.1527
83752LONP2DCIS2HumanBreastDCIS5.18e-543.37e-010.0085
83752LONP2HTA11_3410_2000001011HumanColorectumAD5.13e-16-4.92e-010.0155
83752LONP2HTA11_7862_2000001011HumanColorectumAD6.64e-03-3.55e-01-0.0179
83752LONP2HTA11_99999974143_84620HumanColorectumMSS1.28e-08-4.74e-010.3005
83752LONP2A001-C-207HumanColorectumFAP3.23e-05-3.17e-010.1278
83752LONP2A015-C-203HumanColorectumFAP2.37e-28-5.37e-01-0.1294
83752LONP2A015-C-204HumanColorectumFAP6.10e-10-4.14e-01-0.0228
83752LONP2A014-C-040HumanColorectumFAP3.28e-03-2.58e-01-0.1184
83752LONP2A002-C-201HumanColorectumFAP2.21e-17-4.41e-010.0324
83752LONP2A002-C-203HumanColorectumFAP1.09e-02-2.09e-010.2786
83752LONP2A001-C-119HumanColorectumFAP1.47e-07-4.02e-01-0.1557
Page: 1 2 3 4 5 6 7 8 9 10 

check button Transcriptomic changes along malignancy continuum.
TissueExpression DynamicsAbbreviation
BreastThe image shows the transcriptomic changes along malignancy continuum.log2FC in expression of this searched gene in stem-like cells from each diseased tissue sample relative to stem-like cells in normal samples in each tissue plotted against the malignancy continuum. Samples are colored based on if they are from different disease stage.IDC: Invasive ductal carcinoma
DCIS: Ductal carcinoma in situ
Precancer(BRCA1-mut): Precancerous lesion from BRCA1 mutation carriers
Colorectum (GSE201348)The image shows the transcriptomic changes along malignancy continuum.log2FC in expression of this searched gene in stem-like cells from each diseased tissue sample relative to stem-like cells in normal samples in each tissue plotted against the malignancy continuum. Samples are colored based on if they are from different disease stage.FAP: Familial adenomatous polyposis
CRC: Colorectal cancer
Colorectum (HTA11)The image shows the transcriptomic changes along malignancy continuum.log2FC in expression of this searched gene in stem-like cells from each diseased tissue sample relative to stem-like cells in normal samples in each tissue plotted against the malignancy continuum. Samples are colored based on if they are from different disease stage.AD: Adenomas
SER: Sessile serrated lesions
MSI-H: Microsatellite-high colorectal cancer
MSS: Microsatellite stable colorectal cancer
EsophagusThe image shows the transcriptomic changes along malignancy continuum.log2FC in expression of this searched gene in stem-like cells from each diseased tissue sample relative to stem-like cells in normal samples in each tissue plotted against the malignancy continuum. Samples are colored based on if they are from different disease stage.ESCC: Esophageal squamous cell carcinoma
HGIN: High-grade intraepithelial neoplasias
LGIN: Low-grade intraepithelial neoplasias
LiverThe image shows the transcriptomic changes along malignancy continuum.log2FC in expression of this searched gene in stem-like cells from each diseased tissue sample relative to stem-like cells in normal samples in each tissue plotted against the malignancy continuum. Samples are colored based on if they are from different disease stage.
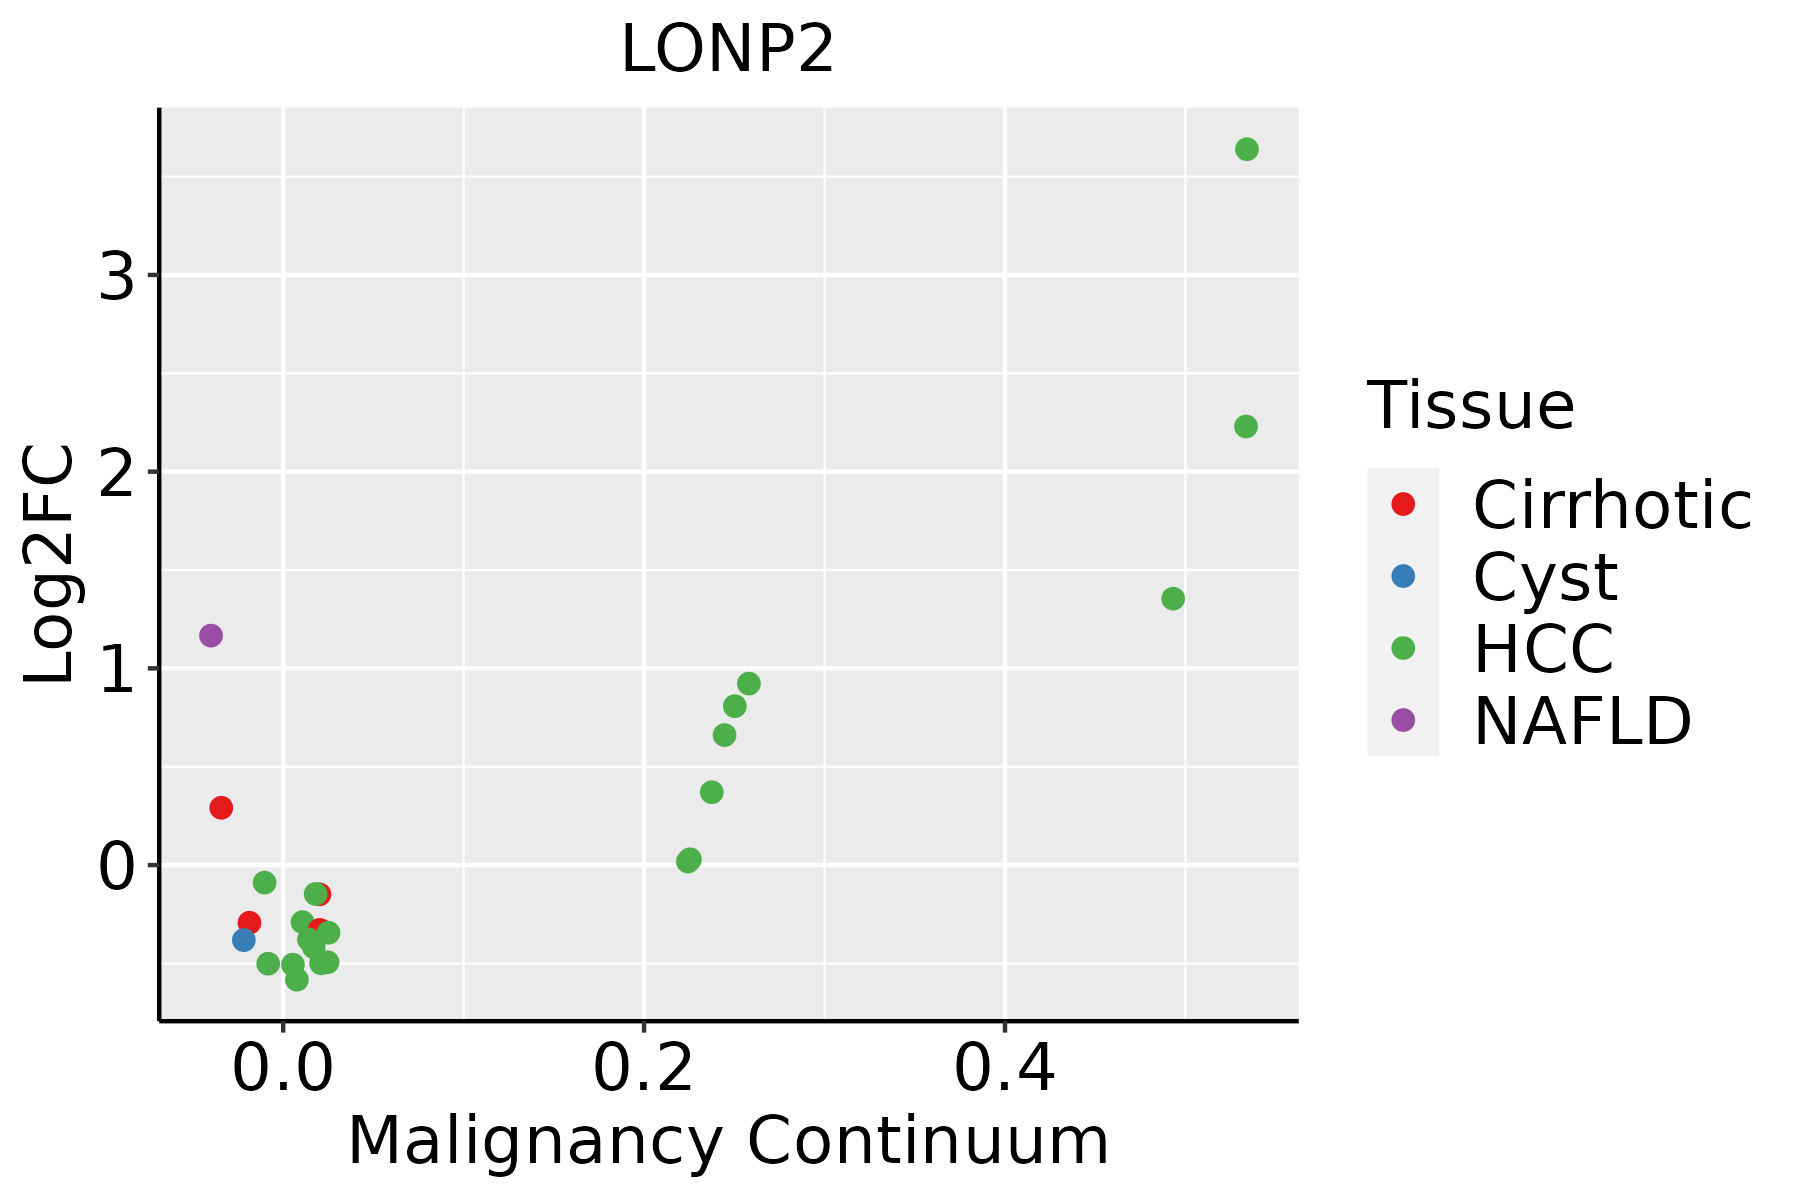
HCC: Hepatocellular carcinoma
NAFLD: Non-alcoholic fatty liver disease
LungThe image shows the transcriptomic changes along malignancy continuum.log2FC in expression of this searched gene in stem-like cells from each diseased tissue sample relative to stem-like cells in normal samples in each tissue plotted against the malignancy continuum. Samples are colored based on if they are from different disease stage.
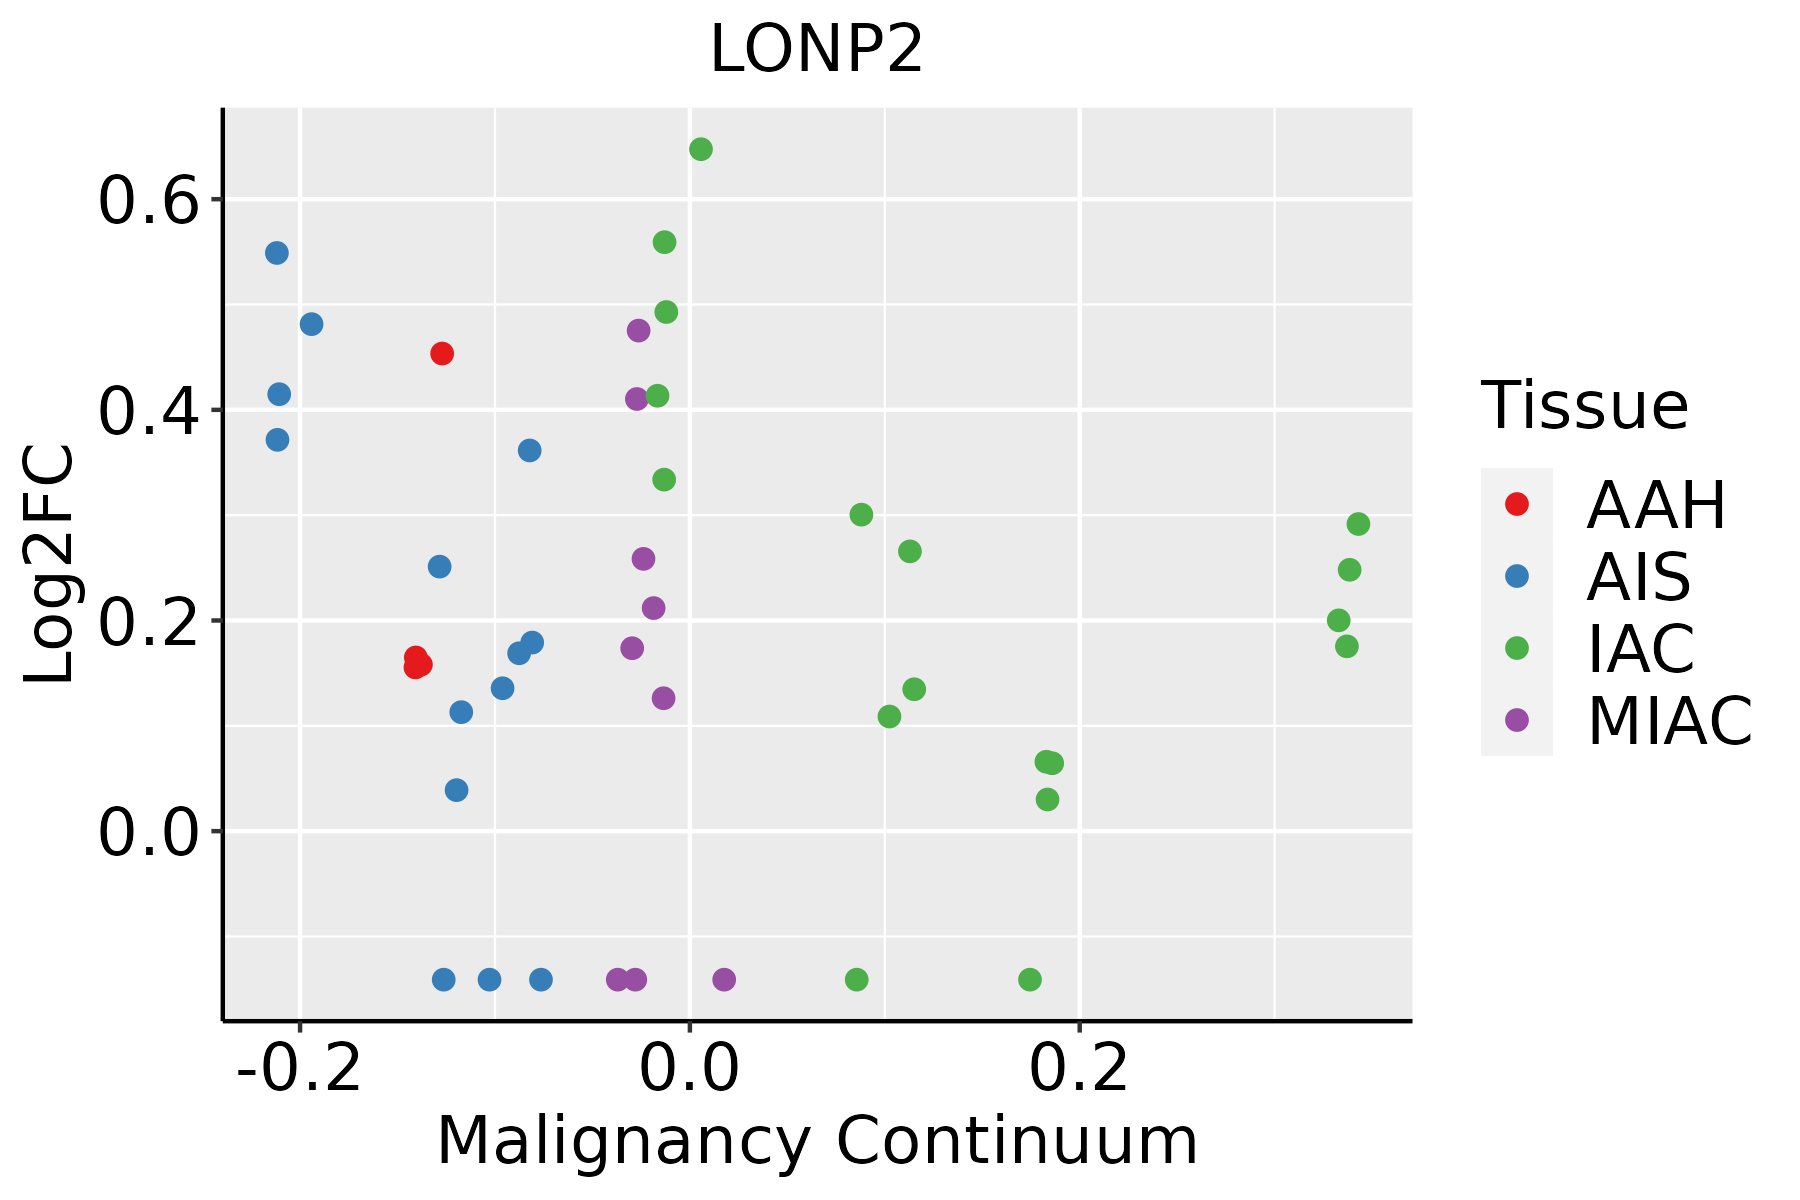
AAH: Atypical adenomatous hyperplasia
AIS: Adenocarcinoma in situ
IAC: Invasive lung adenocarcinoma
MIA: Minimally invasive adenocarcinoma
Oral CavityThe image shows the transcriptomic changes along malignancy continuum.log2FC in expression of this searched gene in stem-like cells from each diseased tissue sample relative to stem-like cells in normal samples in each tissue plotted against the malignancy continuum. Samples are colored based on if they are from different disease stage.
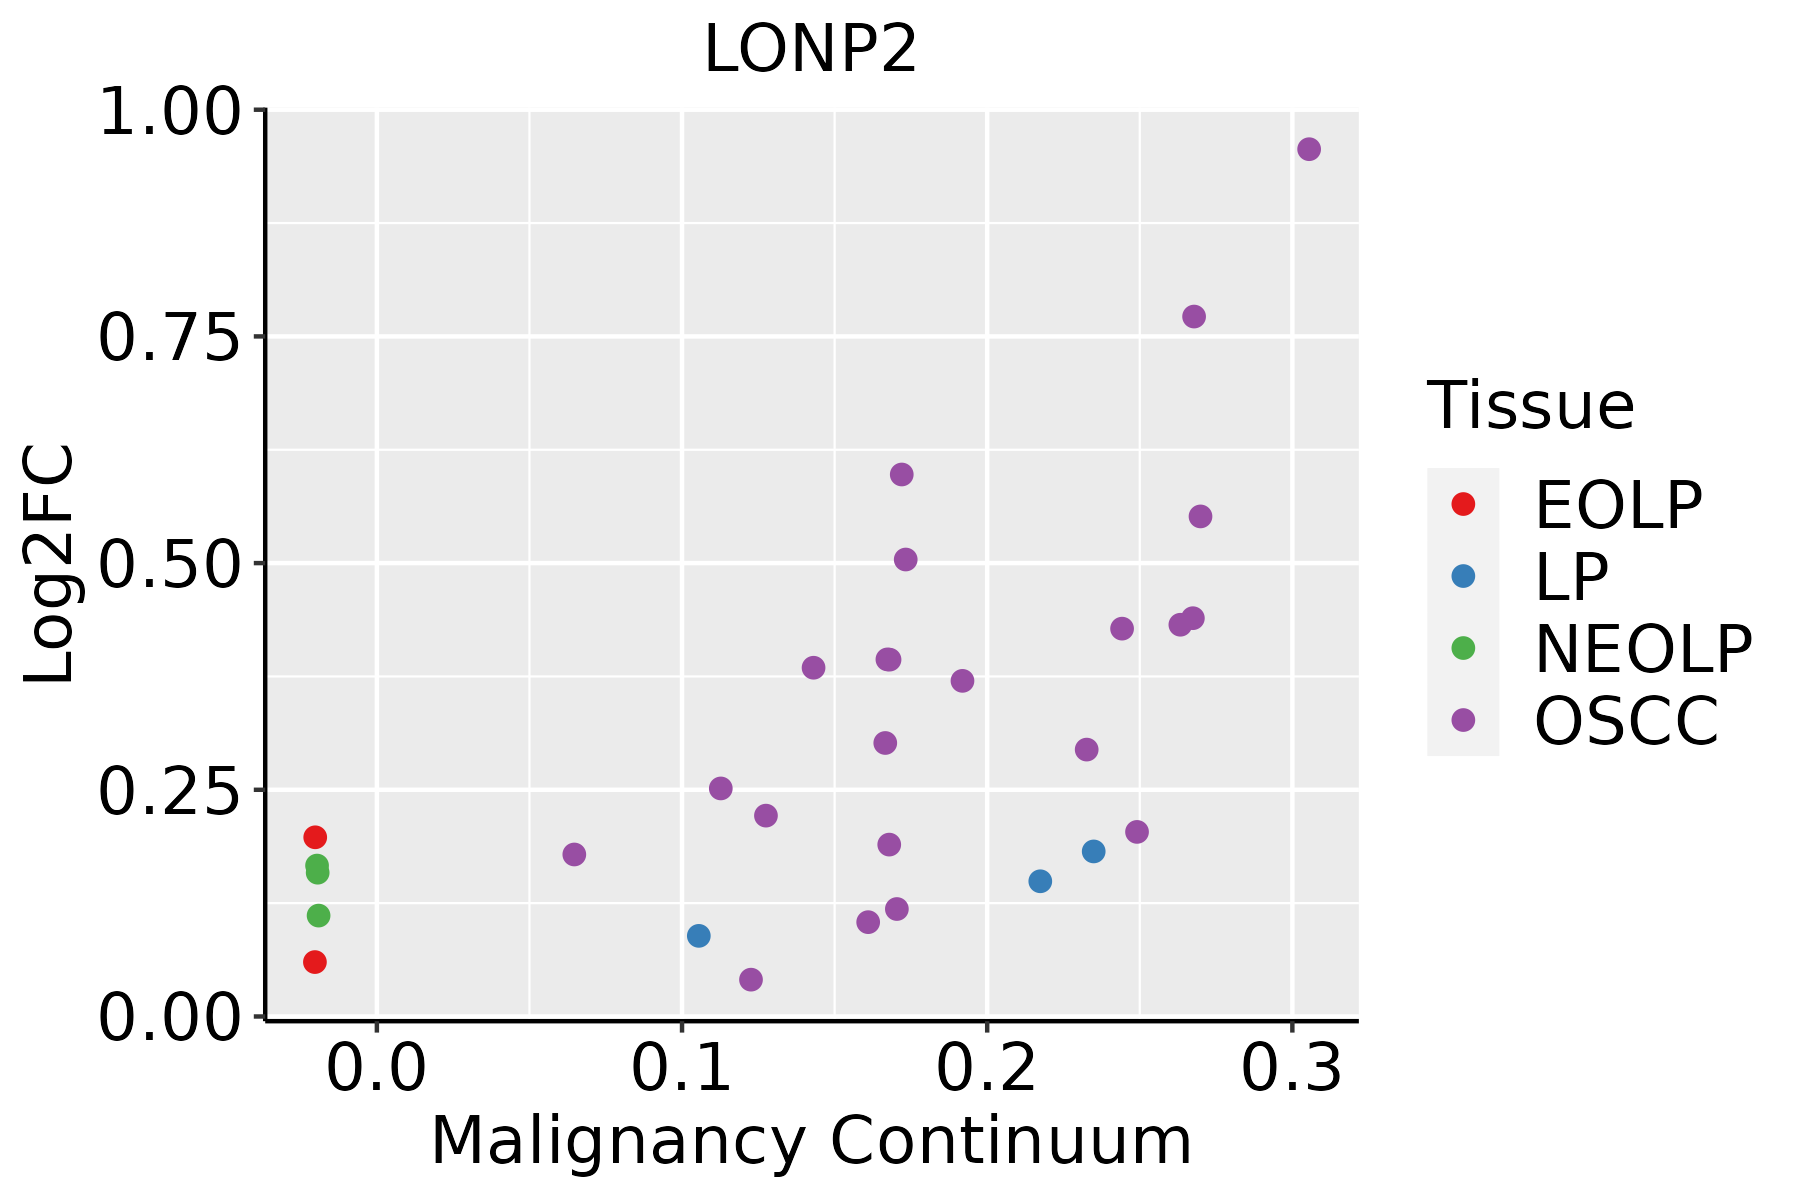
EOLP: Erosive Oral lichen planus
LP: leukoplakia
NEOLP: Non-erosive oral lichen planus
OSCC: Oral squamous cell carcinoma
ProstateThe image shows the transcriptomic changes along malignancy continuum.log2FC in expression of this searched gene in stem-like cells from each diseased tissue sample relative to stem-like cells in normal samples in each tissue plotted against the malignancy continuum. Samples are colored based on if they are from different disease stage.BPH: Benign Prostatic Hyperplasia
SkinThe image shows the transcriptomic changes along malignancy continuum.log2FC in expression of this searched gene in stem-like cells from each diseased tissue sample relative to stem-like cells in normal samples in each tissue plotted against the malignancy continuum. Samples are colored based on if they are from different disease stage.AK: Actinic keratosis
cSCC: Cutaneous squamous cell carcinoma
SCCIS:squamous cell carcinoma in situ
ThyroidThe image shows the transcriptomic changes along malignancy continuum.log2FC in expression of this searched gene in stem-like cells from each diseased tissue sample relative to stem-like cells in normal samples in each tissue plotted against the malignancy continuum. Samples are colored based on if they are from different disease stage.
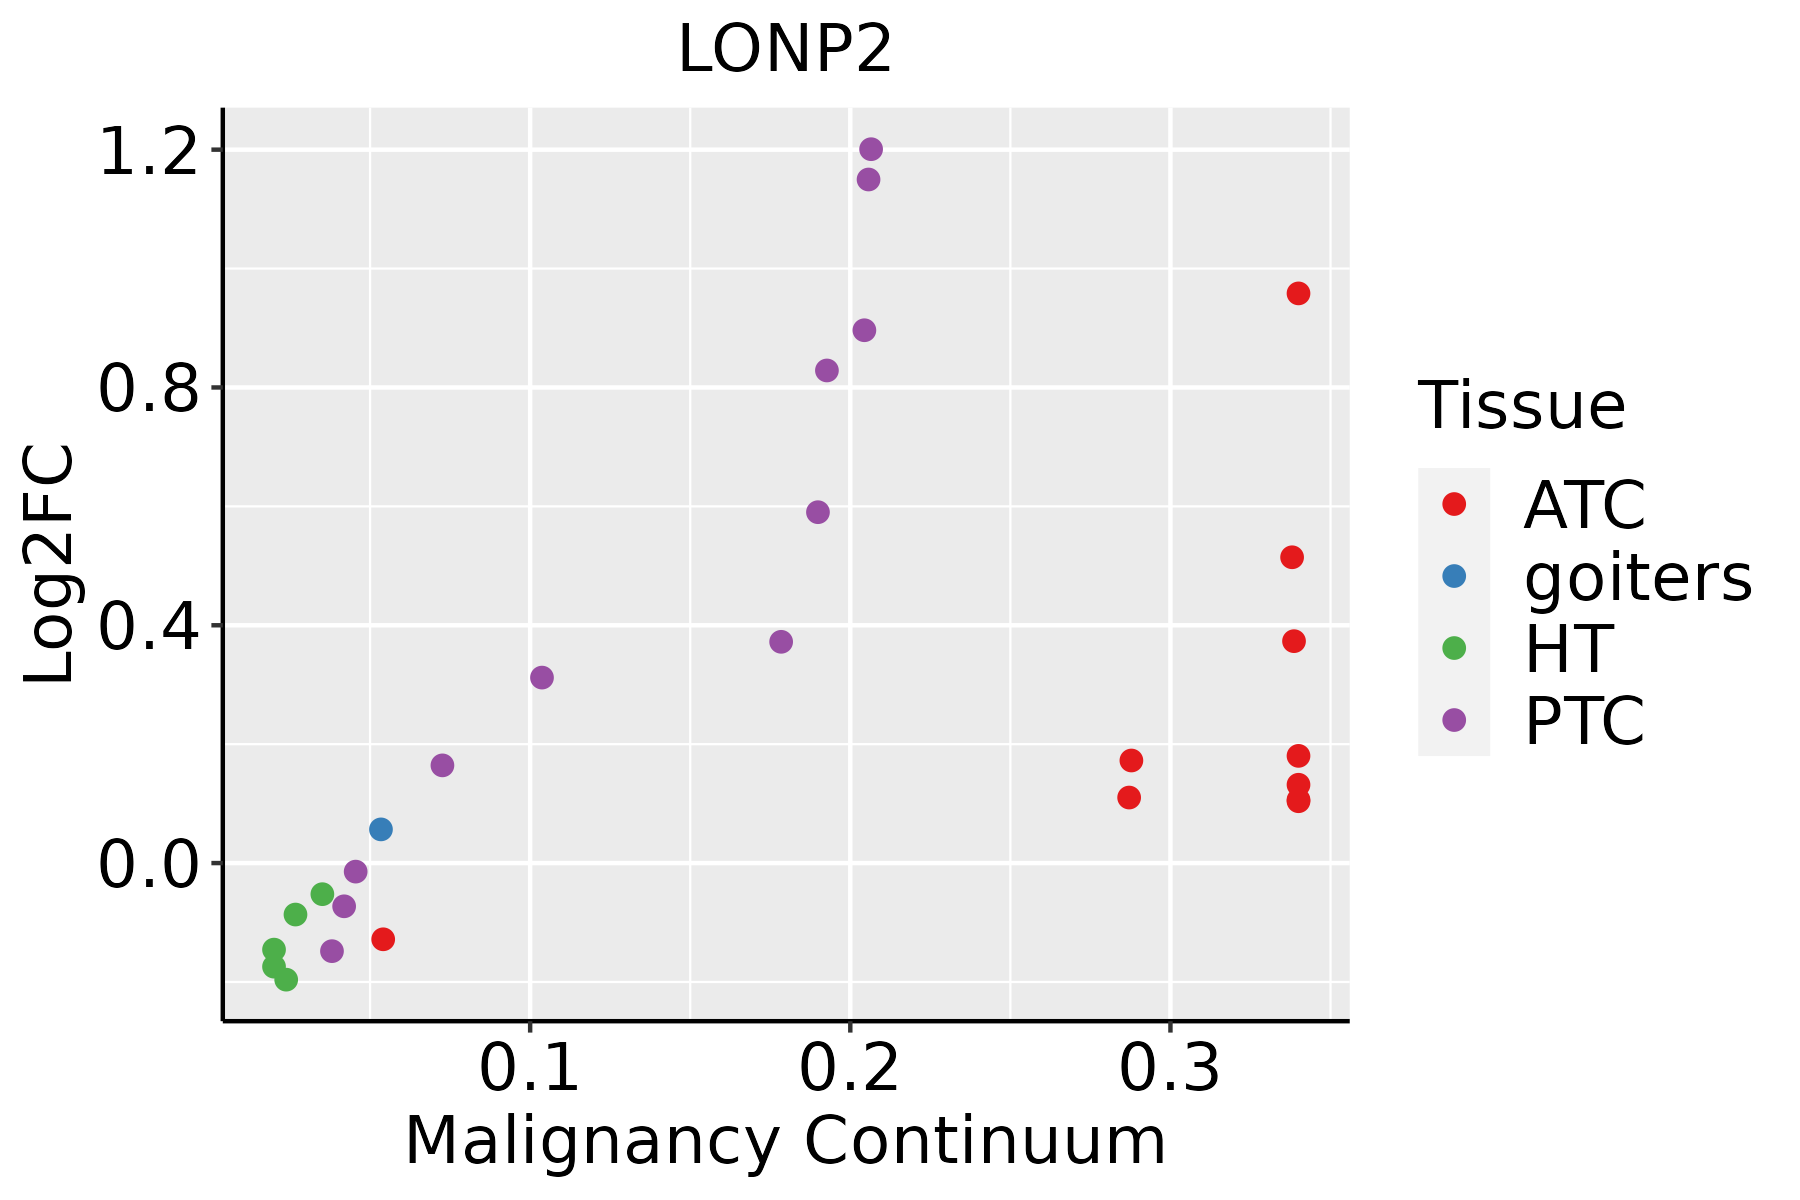
ATC: Anaplastic thyroid cancer
HT: Hashimoto's thyroiditis
PTC: Papillary thyroid cancer
∗log2FC in expression of this searched gene in stem-like cells from each diseased tissue sample relative to stem-like cells in normal samples in each tissue plotted against the malignancy continuum. Samples are colored based on if they are from different disease stage.

Top

Malignant transformation related pathway analysis

check buttonFind out the enriched GO biological processes and KEGG pathways involved in transition from healthy to precancer to cancer
check button Figure of enriched GO biological processes.
TissueDisease StageEnriched GO biological Processes
ColorectumADGO analysis - Figure of enriched GO biological processes: Top 15 enriched GO BP terms are showed in the bar plot of each disease state in each tissue. Each row represents a significant GO biological process which is colored according to the -log10(p.adjust).
ColorectumSERGO analysis - Figure of enriched GO biological processes: Top 15 enriched GO BP terms are showed in the bar plot of each disease state in each tissue. Each row represents a significant GO biological process which is colored according to the -log10(p.adjust).
ColorectumMSSGO analysis - Figure of enriched GO biological processes: Top 15 enriched GO BP terms are showed in the bar plot of each disease state in each tissue. Each row represents a significant GO biological process which is colored according to the -log10(p.adjust).
ColorectumMSI-HGO analysis - Figure of enriched GO biological processes: Top 15 enriched GO BP terms are showed in the bar plot of each disease state in each tissue. Each row represents a significant GO biological process which is colored according to the -log10(p.adjust).
ColorectumFAPGO analysis - Figure of enriched GO biological processes: Top 15 enriched GO BP terms are showed in the bar plot of each disease state in each tissue. Each row represents a significant GO biological process which is colored according to the -log10(p.adjust).
∗Top 15 enriched GO BP terms are showed in the bar plot of each disease state in each tissue. Each row represents a significant GO biological process which is colored according to the -log10(p.adjust).
Page: 1 2 3 4 5 6 7 8 9 

check button Enriched GO biological processes.
GO IDTissueDisease StageDescriptionGene RatioBg Ratiopvaluep.adjustCount
GO:001921612BreastIDCregulation of lipid metabolic process45/1434331/187231.21e-042.24e-0345
GO:000660514BreastIDCprotein targeting43/1434314/187231.44e-042.53e-0343
GO:007259413BreastIDCestablishment of protein localization to organelle51/1434422/187237.94e-049.55e-0351
GO:007180612BreastIDCprotein transmembrane transport12/143459/187231.49e-031.50e-0212
GO:005160413BreastIDCprotein maturation35/1434294/187236.18e-034.40e-0235
GO:000660523BreastDCISprotein targeting43/1390314/187237.17e-051.41e-0343
GO:001921621BreastDCISregulation of lipid metabolic process43/1390331/187232.37e-043.71e-0343
GO:007259423BreastDCISestablishment of protein localization to organelle51/1390422/187233.91e-045.40e-0351
GO:007180621BreastDCISprotein transmembrane transport12/139059/187231.14e-031.22e-0212
GO:006201213BreastDCISregulation of small molecule metabolic process38/1390334/187235.69e-034.10e-0238
GO:005160422BreastDCISprotein maturation34/1390294/187236.72e-034.66e-0234
GO:0072594ColorectumADestablishment of protein localization to organelle148/3918422/187237.95e-121.04e-09148
GO:0006605ColorectumADprotein targeting105/3918314/187231.39e-076.44e-06105
GO:0044282ColorectumADsmall molecule catabolic process118/3918376/187231.05e-063.55e-05118
GO:0006635ColorectumADfatty acid beta-oxidation33/391874/187233.98e-061.09e-0433
GO:0009062ColorectumADfatty acid catabolic process41/3918100/187234.02e-061.09e-0441
GO:0019395ColorectumADfatty acid oxidation40/3918103/187232.43e-054.69e-0440
GO:0016042ColorectumADlipid catabolic process97/3918320/187234.31e-057.56e-0497
GO:0006631ColorectumADfatty acid metabolic process114/3918390/187235.58e-059.44e-04114
GO:0017038ColorectumADprotein import67/3918206/187236.34e-051.05e-0367
Page: 1 2 3 4 5 6 7 8 9 10 11 12 13 

check button Enriched KEGG pathways.
Pathway IDTissueDisease StageDescriptionGene RatioBg Ratiopvaluep.adjustqvalueCount
Page: 1 

Top

Cell-cell communication analysis

check buttonIdentification of potential cell-cell interactions between two cell types and their ligand-receptor pairs for different disease states
LigandReceptorLRpairPathwayTissueDisease Stage
Page: 1 

Top

Single-cell gene regulatory network inference analysis

check buttonFind out the significant the regulons (TFs) and the target genes of each regulon across cell types for different disease states
TFCell TypeTissueDisease StageTarget GeneRSSRegulon Activity
∗The dot plots of a searched regulon are shown for all cell subpopulations in each disease state of each tissue based on the regulon specific score inferred using pySCENIC and by calculating the average expression.
Page: 1 

Top

Somatic mutation of malignant transformation related genes

check buttonAnnotation of somatic variants for genes involved in malignant transformation
Hugo SymbolVariant ClassVariant ClassificationdbSNP RSHGVScHGVSpHGVSp ShortSWISSPROTBIOTYPESIFTPolyPhenTumor Sample BarcodeTissueHistologySexAgeStageTherapy TypesDrugsOutcome
LONP2SNVMissense_Mutationnovelc.709G>Cp.Asp237Hisp.D237HQ86WA8protein_codingtolerated(0.08)possibly_damaging(0.459)TCGA-3C-AALI-01Breastbreast invasive carcinomaFemale<65I/IIUnspecificPoly EComplete Response
LONP2SNVMissense_Mutationnovelc.1205N>Tp.Gly402Valp.G402VQ86WA8protein_codingdeleterious(0)probably_damaging(1)TCGA-5L-AAT1-01Breastbreast invasive carcinomaFemale<65III/IVHormone TherapyletrozolSD
LONP2SNVMissense_Mutationc.1043N>Tp.Lys348Ilep.K348IQ86WA8protein_codingdeleterious(0)possibly_damaging(0.581)TCGA-A8-A090-01Breastbreast invasive carcinomaFemale>=65I/IIUnknownUnknownSD
LONP2SNVMissense_Mutationc.787N>Ap.Glu263Lysp.E263KQ86WA8protein_codingtolerated(0.25)benign(0.036)TCGA-AC-A23H-01Breastbreast invasive carcinomaFemale>=65I/IIUnknownUnknownPD
LONP2SNVMissense_Mutationnovelc.346N>Cp.Glu116Glnp.E116QQ86WA8protein_codingtolerated(0.13)benign(0.051)TCGA-AC-A5XS-01Breastbreast invasive carcinomaFemale>=65I/IIHormone TherapyfemaraSD
LONP2SNVMissense_Mutationc.872N>Gp.Val291Glyp.V291GQ86WA8protein_codingtolerated(0.35)benign(0.031)TCGA-B6-A0I8-01Breastbreast invasive carcinomaFemale<65I/IIUnknownUnknownPD
LONP2SNVMissense_Mutationc.1087N>Gp.Lys363Glup.K363EQ86WA8protein_codingdeleterious(0)probably_damaging(0.931)TCGA-E9-A1ND-01Breastbreast invasive carcinomaFemale>=65I/IIHormone TherapyaromasinSD
LONP2SNVMissense_Mutationnovelc.1705G>Ap.Gly569Argp.G569RQ86WA8protein_codingdeleterious(0)probably_damaging(0.96)TCGA-E9-A3X8-01Breastbreast invasive carcinomaFemale<65I/IIChemotherapycyclophosphaneCR
LONP2insertionNonsense_Mutationnovelc.466_467insGGTAGp.Gln156ArgfsTer2p.Q156Rfs*2Q86WA8protein_codingTCGA-A7-A26I-01Breastbreast invasive carcinomaFemale>=65I/IIChemotherapycytoxanSD
LONP2insertionNonsense_Mutationnovelc.2107_2108insTAACTTCTATTGGATAGGAAATTTTGAAGCTCAAAp.Trp703LeufsTer6p.W703Lfs*6Q86WA8protein_codingTCGA-A8-A079-01Breastbreast invasive carcinomaFemale>=65III/IVChemotherapy5-fluorouracilSD
Page: 1 2 3 4 5 6 7 8 9 10 

Top

Related drugs of malignant transformation related genes

check buttonIdentification of chemicals and drugs interact with genes involved in malignant transfromation
(DGIdb 4.0)
Entrez IDSymbolCategoryInteraction TypesDrug Claim NameDrug NamePMIDs
Page: 1