
|
|||||
|
 | |
| |
| |
| |
| |
| |
|
Gene: LONP1 |
Gene summary for LONP1 |
| Gene information | Species | Human | Gene symbol | LONP1 | Gene ID | 9361 |
| Gene name | lon peptidase 1, mitochondrial | |
| Gene Alias | CODASS | |
| Cytomap | 19p13.3 | |
| Gene Type | protein-coding | GO ID | GO:0000002 | UniProtAcc | P36776 |
Top |
Malignant transformation analysis |
| Identification of the aberrant gene expression in precancerous and cancerous lesions by comparing the gene expression of stem-like cells in diseased tissues with normal stem cells |
| Entrez ID | Symbol | Replicates | Species | Organ | Tissue | Adj P-value | Log2FC | Malignancy |
| 9361 | LONP1 | LZE7T | Human | Esophagus | ESCC | 1.79e-05 | 4.70e-01 | 0.0667 |
| 9361 | LONP1 | LZE8T | Human | Esophagus | ESCC | 1.26e-03 | 8.18e-02 | 0.067 |
| 9361 | LONP1 | LZE24T | Human | Esophagus | ESCC | 7.77e-10 | 1.61e-01 | 0.0596 |
| 9361 | LONP1 | P1T-E | Human | Esophagus | ESCC | 2.40e-08 | 3.80e-01 | 0.0875 |
| 9361 | LONP1 | P2T-E | Human | Esophagus | ESCC | 2.39e-09 | 1.37e-01 | 0.1177 |
| 9361 | LONP1 | P4T-E | Human | Esophagus | ESCC | 3.67e-13 | 2.71e-01 | 0.1323 |
| 9361 | LONP1 | P5T-E | Human | Esophagus | ESCC | 8.44e-16 | 2.10e-01 | 0.1327 |
| 9361 | LONP1 | P8T-E | Human | Esophagus | ESCC | 4.96e-15 | 2.50e-01 | 0.0889 |
| 9361 | LONP1 | P9T-E | Human | Esophagus | ESCC | 3.80e-12 | 1.38e-01 | 0.1131 |
| 9361 | LONP1 | P10T-E | Human | Esophagus | ESCC | 2.89e-16 | 2.80e-01 | 0.116 |
| 9361 | LONP1 | P12T-E | Human | Esophagus | ESCC | 4.30e-10 | 1.82e-01 | 0.1122 |
| 9361 | LONP1 | P15T-E | Human | Esophagus | ESCC | 3.92e-10 | 2.44e-01 | 0.1149 |
| 9361 | LONP1 | P16T-E | Human | Esophagus | ESCC | 7.71e-07 | 8.86e-02 | 0.1153 |
| 9361 | LONP1 | P17T-E | Human | Esophagus | ESCC | 9.56e-05 | 2.78e-01 | 0.1278 |
| 9361 | LONP1 | P21T-E | Human | Esophagus | ESCC | 3.40e-07 | 1.15e-01 | 0.1617 |
| 9361 | LONP1 | P22T-E | Human | Esophagus | ESCC | 3.25e-10 | 1.90e-01 | 0.1236 |
| 9361 | LONP1 | P23T-E | Human | Esophagus | ESCC | 2.58e-16 | 3.43e-01 | 0.108 |
| 9361 | LONP1 | P24T-E | Human | Esophagus | ESCC | 1.09e-09 | 1.94e-01 | 0.1287 |
| 9361 | LONP1 | P26T-E | Human | Esophagus | ESCC | 7.48e-17 | 2.68e-01 | 0.1276 |
| 9361 | LONP1 | P27T-E | Human | Esophagus | ESCC | 6.50e-10 | 2.01e-01 | 0.1055 |
| Page: 1 2 3 4 5 |
| Tissue | Expression Dynamics | Abbreviation |
| Esophagus |  | ESCC: Esophageal squamous cell carcinoma |
| HGIN: High-grade intraepithelial neoplasias | ||
| LGIN: Low-grade intraepithelial neoplasias | ||
| Liver | 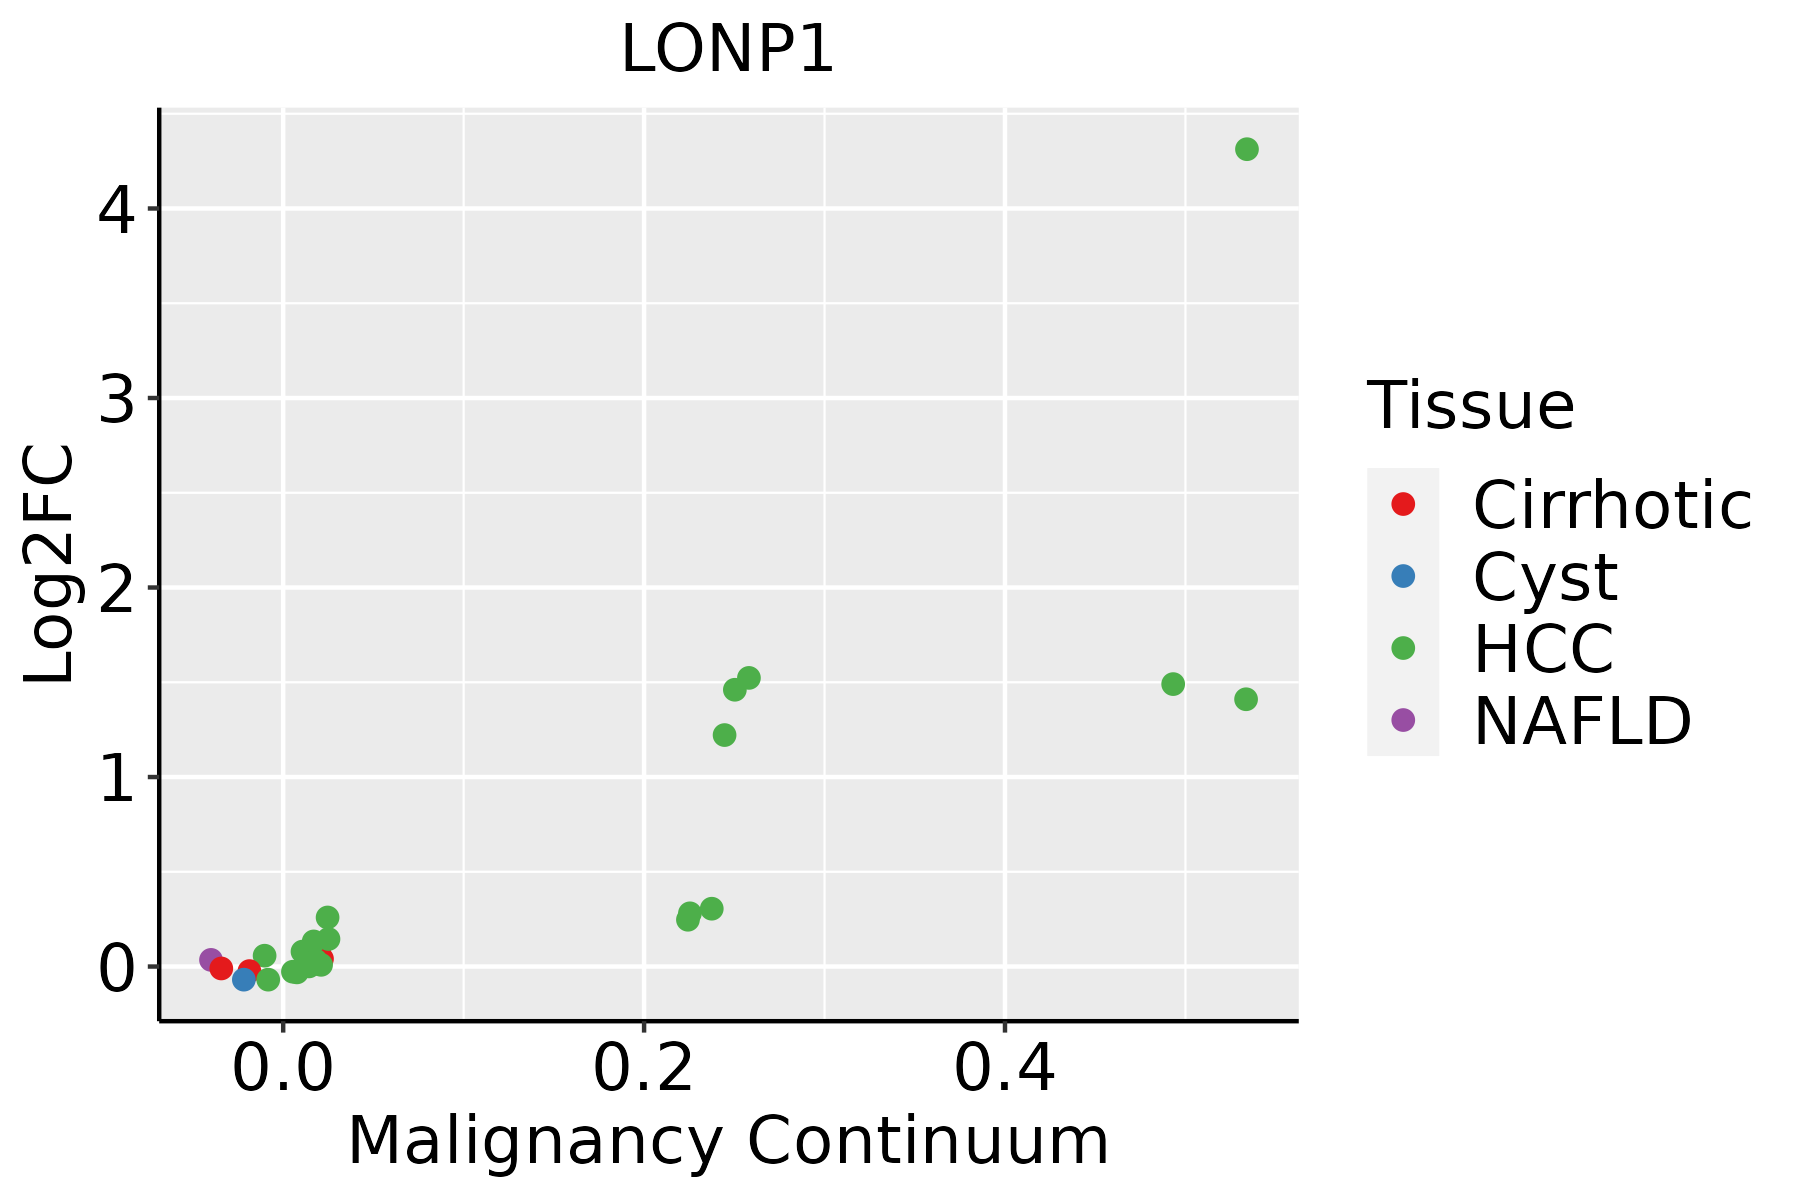 | HCC: Hepatocellular carcinoma |
| NAFLD: Non-alcoholic fatty liver disease | ||
| Oral Cavity | 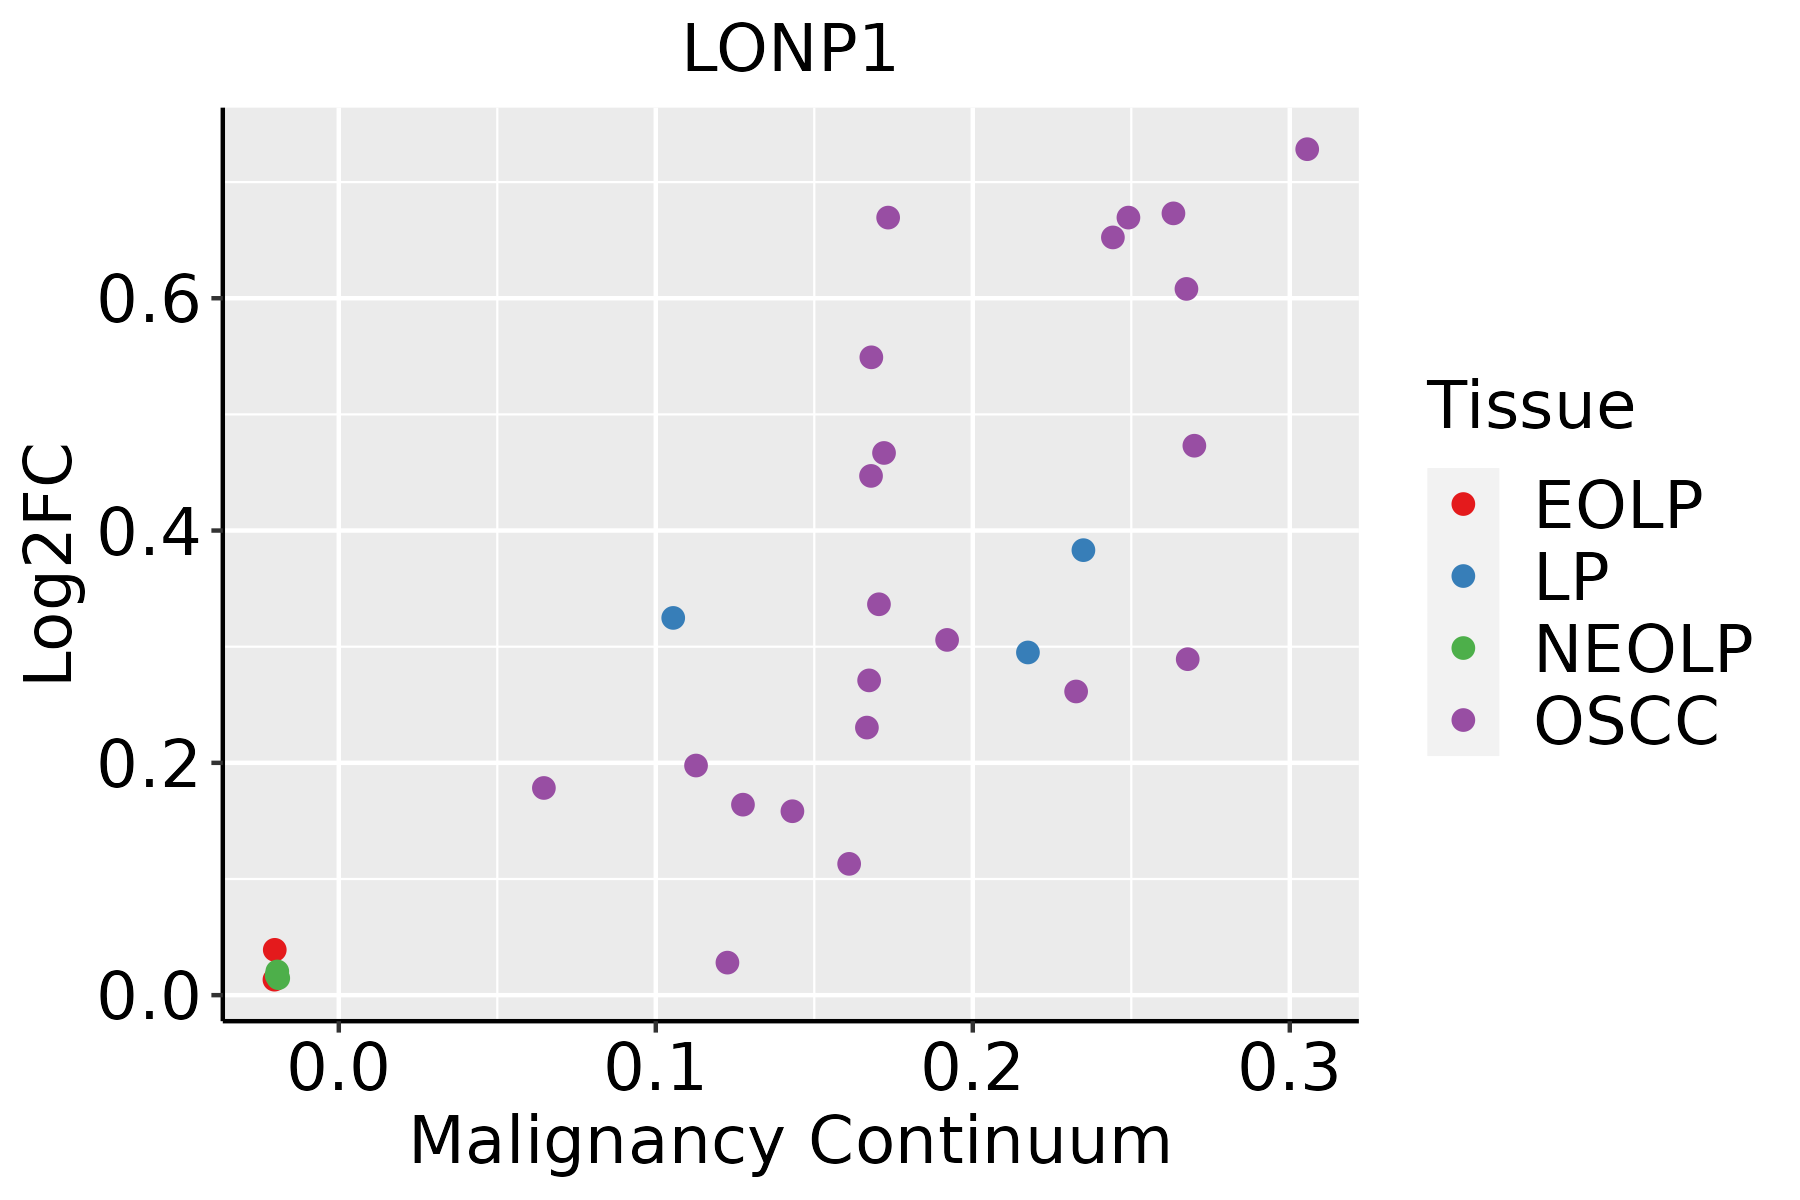 | EOLP: Erosive Oral lichen planus |
| LP: leukoplakia | ||
| NEOLP: Non-erosive oral lichen planus | ||
| OSCC: Oral squamous cell carcinoma | ||
| Thyroid | 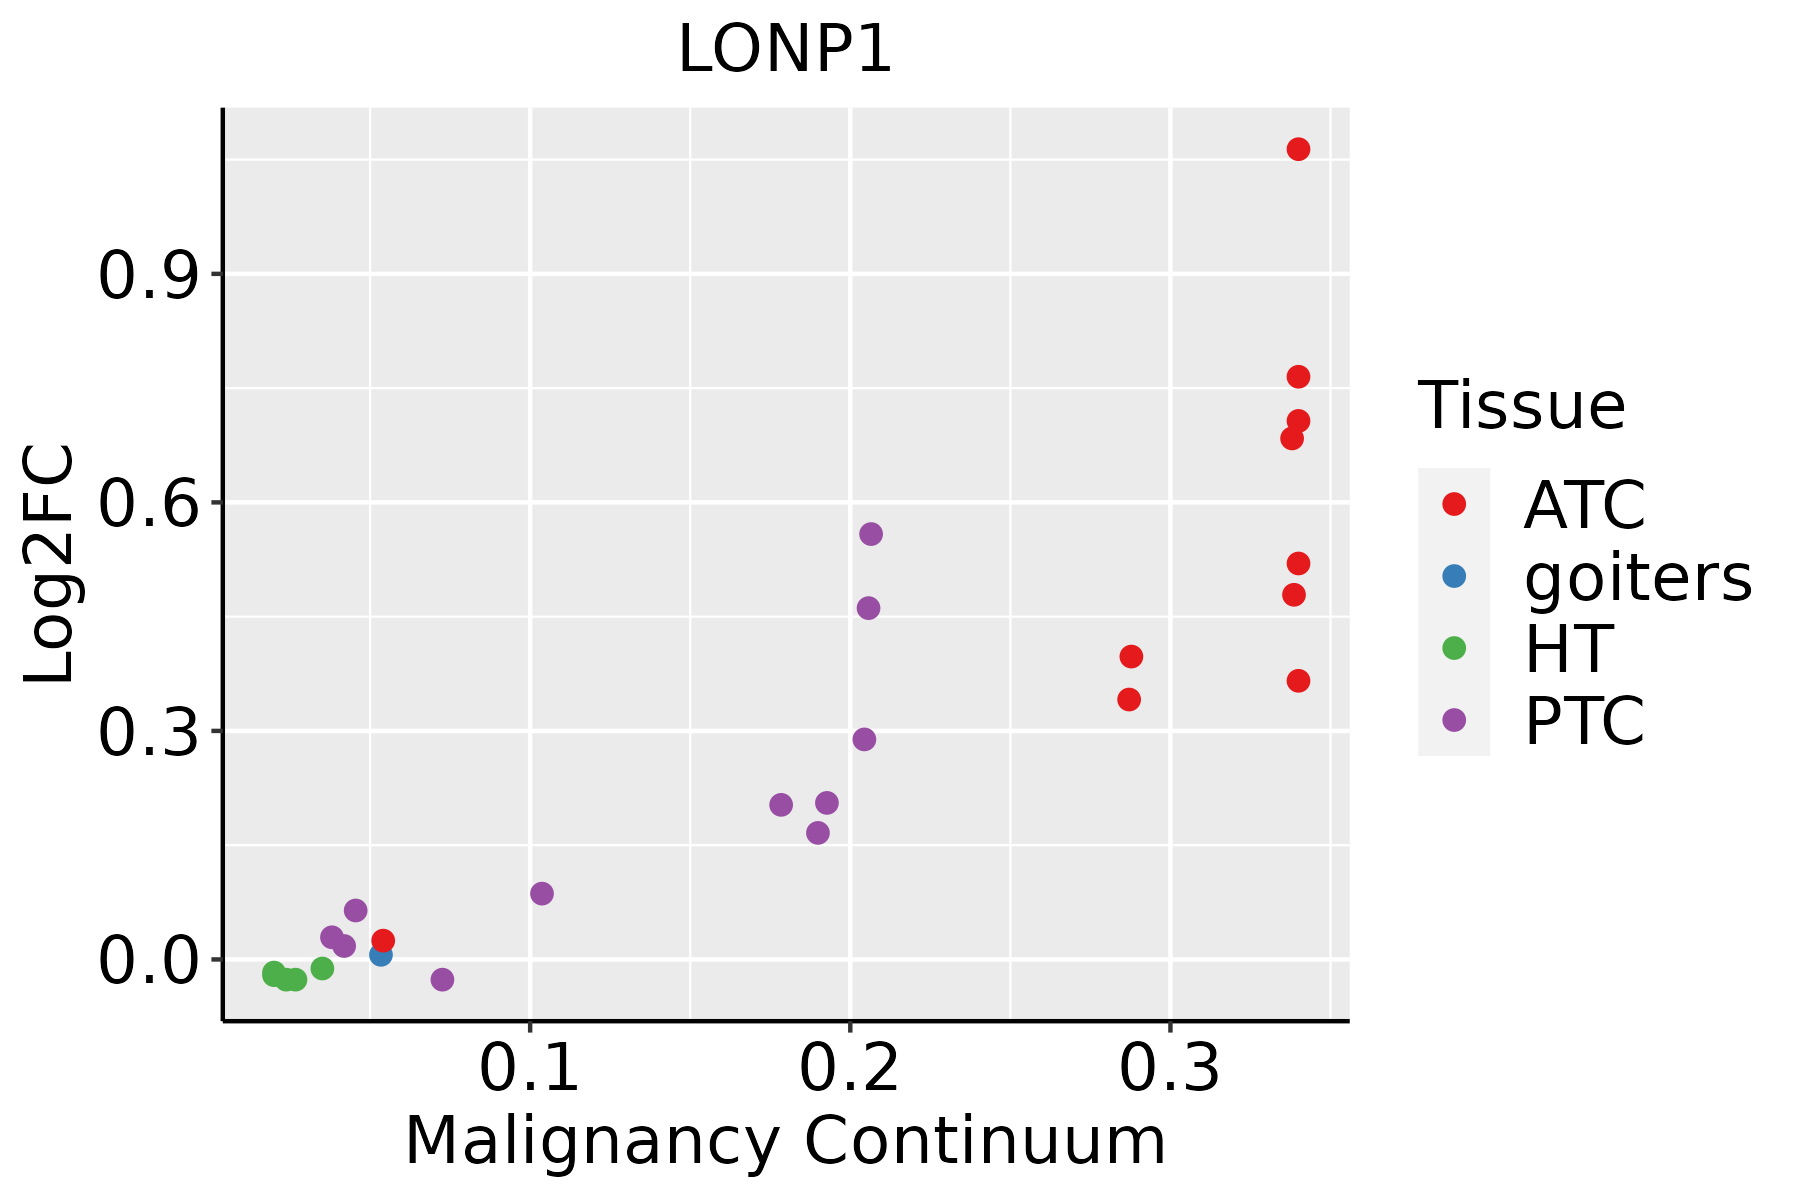 | ATC: Anaplastic thyroid cancer |
| HT: Hashimoto's thyroiditis | ||
| PTC: Papillary thyroid cancer |
| ∗log2FC in expression of this searched gene in stem-like cells from each diseased tissue sample relative to stem-like cells in normal samples in each tissue plotted against the malignancy continuum. Samples are colored based on if they are from different disease stage. |
Top |
Malignant transformation related pathway analysis |
| Find out the enriched GO biological processes and KEGG pathways involved in transition from healthy to precancer to cancer |
| Tissue | Disease Stage | Enriched GO biological Processes |
| Colorectum | AD |  |
| Colorectum | SER |  |
| Colorectum | MSS |  |
| Colorectum | MSI-H |  |
| Colorectum | FAP |  |
| ∗Top 15 enriched GO BP terms are showed in the bar plot of each disease state in each tissue. Each row represents a significant GO biological process which is colored according to the -log10(p.adjust). |
| Page: 1 2 3 4 5 6 7 8 9 |
| GO ID | Tissue | Disease Stage | Description | Gene Ratio | Bg Ratio | pvalue | p.adjust | Count |
| GO:0006979111 | Esophagus | ESCC | response to oxidative stress | 303/8552 | 446/18723 | 7.15e-22 | 1.30e-19 | 303 |
| GO:0062197111 | Esophagus | ESCC | cellular response to chemical stress | 234/8552 | 337/18723 | 5.37e-19 | 5.97e-17 | 234 |
| GO:0034599111 | Esophagus | ESCC | cellular response to oxidative stress | 197/8552 | 288/18723 | 3.76e-15 | 2.15e-13 | 197 |
| GO:0070482111 | Esophagus | ESCC | response to oxygen levels | 218/8552 | 347/18723 | 6.91e-11 | 2.17e-09 | 218 |
| GO:0036293111 | Esophagus | ESCC | response to decreased oxygen levels | 201/8552 | 322/18723 | 8.37e-10 | 2.04e-08 | 201 |
| GO:0001666111 | Esophagus | ESCC | response to hypoxia | 192/8552 | 307/18723 | 1.59e-09 | 3.69e-08 | 192 |
| GO:000756820 | Esophagus | ESCC | aging | 201/8552 | 339/18723 | 2.64e-07 | 3.94e-06 | 201 |
| GO:001003827 | Esophagus | ESCC | response to metal ion | 208/8552 | 373/18723 | 5.02e-05 | 3.90e-04 | 208 |
| GO:00000021 | Esophagus | ESCC | mitochondrial genome maintenance | 17/8552 | 21/18723 | 1.03e-03 | 5.19e-03 | 17 |
| GO:00065154 | Esophagus | ESCC | protein quality control for misfolded or incompletely synthesized proteins | 21/8552 | 28/18723 | 1.57e-03 | 7.33e-03 | 21 |
| GO:005113119 | Esophagus | ESCC | chaperone-mediated protein complex assembly | 17/8552 | 23/18723 | 5.73e-03 | 2.13e-02 | 17 |
| GO:000697922 | Liver | HCC | response to oxidative stress | 281/7958 | 446/18723 | 9.75e-19 | 1.24e-16 | 281 |
| GO:006219722 | Liver | HCC | cellular response to chemical stress | 216/7958 | 337/18723 | 6.86e-16 | 5.44e-14 | 216 |
| GO:003459922 | Liver | HCC | cellular response to oxidative stress | 183/7958 | 288/18723 | 3.65e-13 | 1.93e-11 | 183 |
| GO:001003822 | Liver | HCC | response to metal ion | 208/7958 | 373/18723 | 1.35e-07 | 2.56e-06 | 208 |
| GO:000166612 | Liver | HCC | response to hypoxia | 172/7958 | 307/18723 | 1.06e-06 | 1.59e-05 | 172 |
| GO:003629312 | Liver | HCC | response to decreased oxygen levels | 179/7958 | 322/18723 | 1.29e-06 | 1.87e-05 | 179 |
| GO:007048212 | Liver | HCC | response to oxygen levels | 191/7958 | 347/18723 | 1.42e-06 | 2.03e-05 | 191 |
| GO:000651521 | Liver | HCC | protein quality control for misfolded or incompletely synthesized proteins | 24/7958 | 28/18723 | 3.01e-06 | 3.99e-05 | 24 |
| GO:000756822 | Liver | HCC | aging | 185/7958 | 339/18723 | 4.28e-06 | 5.50e-05 | 185 |
| Page: 1 2 3 |
| Pathway ID | Tissue | Disease Stage | Description | Gene Ratio | Bg Ratio | pvalue | p.adjust | qvalue | Count |
| Page: 1 |
Top |
Cell-cell communication analysis |
| Identification of potential cell-cell interactions between two cell types and their ligand-receptor pairs for different disease states |
| Ligand | Receptor | LRpair | Pathway | Tissue | Disease Stage |
| Page: 1 |
Top |
Single-cell gene regulatory network inference analysis |
| Find out the significant the regulons (TFs) and the target genes of each regulon across cell types for different disease states |
| TF | Cell Type | Tissue | Disease Stage | Target Gene | RSS | Regulon Activity |
| ∗The dot plots of a searched regulon are shown for all cell subpopulations in each disease state of each tissue based on the regulon specific score inferred using pySCENIC and by calculating the average expression. |
| Page: 1 |
Top |
Somatic mutation of malignant transformation related genes |
| Annotation of somatic variants for genes involved in malignant transformation |
| Hugo Symbol | Variant Class | Variant Classification | dbSNP RS | HGVSc | HGVSp | HGVSp Short | SWISSPROT | BIOTYPE | SIFT | PolyPhen | Tumor Sample Barcode | Tissue | Histology | Sex | Age | Stage | Therapy Types | Drugs | Outcome |
| LONP1 | insertion | Frame_Shift_Ins | novel | c.1128_1129insGACCGTCCAACATTAAGGGAAGAAT | p.Gln377AspfsTer25 | p.Q377Dfs*25 | P36776 | protein_coding | TCGA-AO-A0J5-01 | Breast | breast invasive carcinoma | Female | <65 | III/IV | Other, specify in notesBisphosphonate | zoledronic | PD | ||
| LONP1 | SNV | Missense_Mutation | novel | c.2477N>G | p.Met826Arg | p.M826R | P36776 | protein_coding | tolerated(0.45) | benign(0.006) | TCGA-DS-A1OB-01 | Cervix | cervical & endocervical cancer | Female | <65 | I/II | Chemotherapy | carboplatin | PD |
| LONP1 | SNV | Missense_Mutation | c.1962N>C | p.Glu654Asp | p.E654D | P36776 | protein_coding | deleterious(0) | probably_damaging(0.988) | TCGA-IR-A3LL-01 | Cervix | cervical & endocervical cancer | Female | <65 | I/II | Chemotherapy | cisplatin | CR | |
| LONP1 | SNV | Missense_Mutation | rs768949488 | c.2191N>A | p.Glu731Lys | p.E731K | P36776 | protein_coding | tolerated(0.12) | benign(0.028) | TCGA-MY-A5BD-01 | Cervix | cervical & endocervical cancer | Female | <65 | I/II | Chemotherapy | cisplatin | CR |
| LONP1 | SNV | Missense_Mutation | c.427N>A | p.Glu143Lys | p.E143K | P36776 | protein_coding | tolerated(0.26) | probably_damaging(0.984) | TCGA-MY-A5BD-01 | Cervix | cervical & endocervical cancer | Female | <65 | I/II | Chemotherapy | cisplatin | CR | |
| LONP1 | SNV | Missense_Mutation | c.1688N>A | p.Arg563Gln | p.R563Q | P36776 | protein_coding | deleterious(0) | probably_damaging(0.971) | TCGA-AA-3815-01 | Colorectum | colon adenocarcinoma | Female | >=65 | I/II | Unknown | Unknown | SD | |
| LONP1 | SNV | Missense_Mutation | novel | c.2756N>T | p.Asp919Val | p.D919V | P36776 | protein_coding | deleterious(0) | probably_damaging(0.997) | TCGA-AA-3877-01 | Colorectum | colon adenocarcinoma | Female | >=65 | I/II | Unknown | Unknown | SD |
| LONP1 | SNV | Missense_Mutation | rs549574673 | c.2036G>A | p.Arg679His | p.R679H | P36776 | protein_coding | tolerated(0.08) | benign(0.007) | TCGA-AZ-5403-01 | Colorectum | colon adenocarcinoma | Male | <65 | I/II | Unknown | Unknown | PD |
| LONP1 | SNV | Missense_Mutation | rs756015513 | c.2357N>A | p.Arg786Gln | p.R786Q | P36776 | protein_coding | tolerated(0.28) | possibly_damaging(0.575) | TCGA-CK-4951-01 | Colorectum | colon adenocarcinoma | Female | >=65 | I/II | Unknown | Unknown | PD |
| LONP1 | SNV | Missense_Mutation | c.938N>T | p.Ser313Leu | p.S313L | P36776 | protein_coding | deleterious(0.01) | possibly_damaging(0.61) | TCGA-CK-4951-01 | Colorectum | colon adenocarcinoma | Female | >=65 | I/II | Unknown | Unknown | PD |
| Page: 1 2 3 4 5 6 7 8 |
Top |
Related drugs of malignant transformation related genes |
| Identification of chemicals and drugs interact with genes involved in malignant transfromation |
| (DGIdb 4.0) |
| Entrez ID | Symbol | Category | Interaction Types | Drug Claim Name | Drug Name | PMIDs |
| Page: 1 |

Copyright 2023-Present -The University of Texas Health Science Center at Houston |