
|
|||||
|
 | |
| |
| |
| |
| |
| |
|
Gene: LOC344967 |
Gene summary for LOC344967 |
| Gene information | Species | Human | Gene symbol | LOC344967 | Gene ID | 344967 |
| Gene name | acyl-CoA thioesterase 7 pseudogene | |
| Gene Alias | LOC344967 | |
| Cytomap | 4p14 | |
| Gene Type | pseudo | GO ID | GO:0001676 | UniProtAcc | NA |
Top |
Malignant transformation analysis |
| Identification of the aberrant gene expression in precancerous and cancerous lesions by comparing the gene expression of stem-like cells in diseased tissues with normal stem cells |
| Entrez ID | Symbol | Replicates | Species | Organ | Tissue | Adj P-value | Log2FC | Malignancy |
| 344967 | LOC344967 | HCC1 | Human | Liver | HCC | 8.27e-05 | 4.80e-01 | 0.5336 |
| 344967 | LOC344967 | HCC2 | Human | Liver | HCC | 1.12e-12 | 5.80e-01 | 0.5341 |
| 344967 | LOC344967 | HCC5 | Human | Liver | HCC | 4.66e-09 | 8.10e-01 | 0.4932 |
| Page: 1 |
| Tissue | Expression Dynamics | Abbreviation |
| Liver | 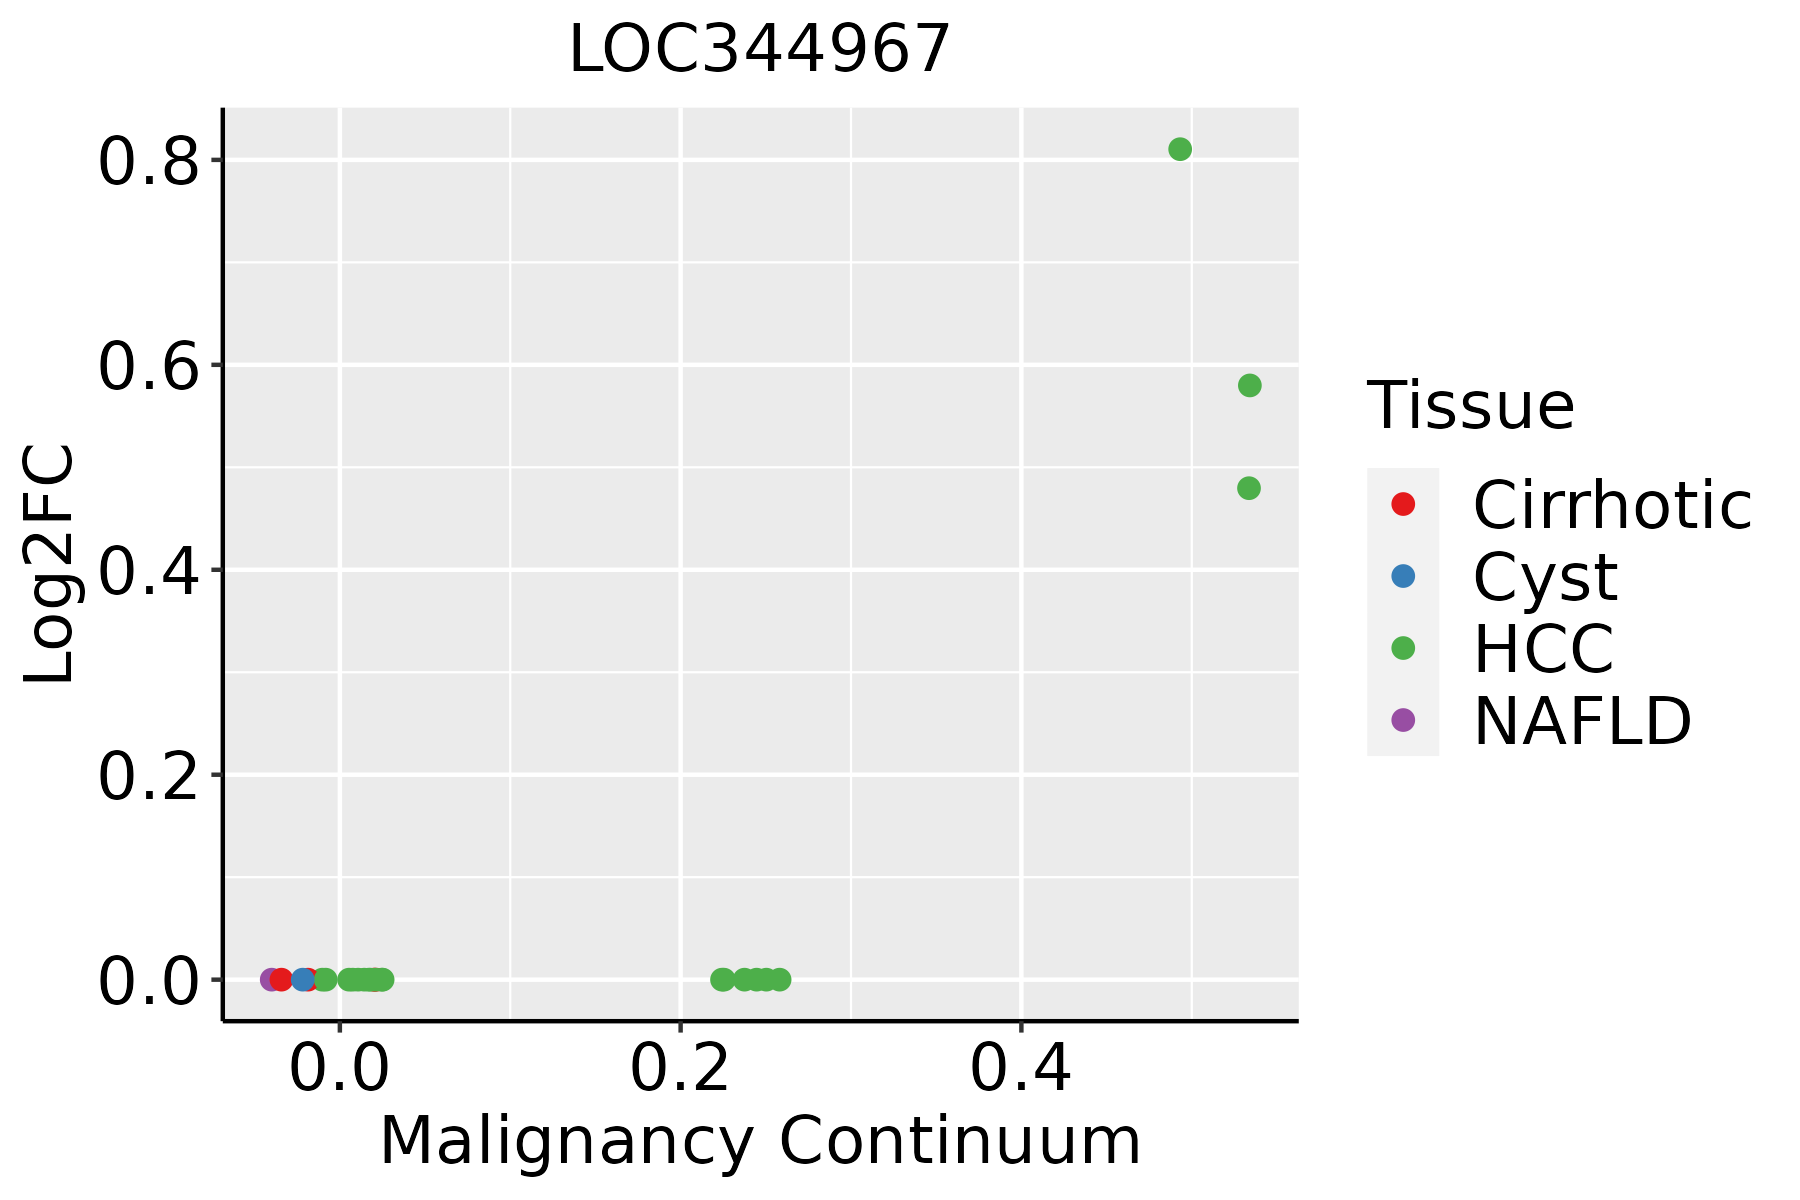 | HCC: Hepatocellular carcinoma |
| NAFLD: Non-alcoholic fatty liver disease |
| ∗log2FC in expression of this searched gene in stem-like cells from each diseased tissue sample relative to stem-like cells in normal samples in each tissue plotted against the malignancy continuum. Samples are colored based on if they are from different disease stage. |
Top |
Malignant transformation related pathway analysis |
| Find out the enriched GO biological processes and KEGG pathways involved in transition from healthy to precancer to cancer |
| Tissue | Disease Stage | Enriched GO biological Processes |
| Colorectum | AD |  |
| Colorectum | SER |  |
| Colorectum | MSS |  |
| Colorectum | MSI-H |  |
| Colorectum | FAP |  |
| ∗Top 15 enriched GO BP terms are showed in the bar plot of each disease state in each tissue. Each row represents a significant GO biological process which is colored according to the -log10(p.adjust). |
| Page: 1 2 3 4 5 6 7 8 9 |
| GO ID | Tissue | Disease Stage | Description | Gene Ratio | Bg Ratio | pvalue | p.adjust | Count |
| GO:000911722 | Liver | HCC | nucleotide metabolic process | 300/7958 | 489/18723 | 1.61e-17 | 1.71e-15 | 300 |
| GO:000675322 | Liver | HCC | nucleoside phosphate metabolic process | 304/7958 | 497/18723 | 1.78e-17 | 1.85e-15 | 304 |
| GO:001969322 | Liver | HCC | ribose phosphate metabolic process | 248/7958 | 396/18723 | 3.15e-16 | 2.70e-14 | 248 |
| GO:000925922 | Liver | HCC | ribonucleotide metabolic process | 240/7958 | 385/18723 | 2.07e-15 | 1.51e-13 | 240 |
| GO:001605321 | Liver | HCC | organic acid biosynthetic process | 200/7958 | 316/18723 | 5.24e-14 | 3.22e-12 | 200 |
| GO:000679021 | Liver | HCC | sulfur compound metabolic process | 212/7958 | 339/18723 | 5.60e-14 | 3.39e-12 | 212 |
| GO:000663122 | Liver | HCC | fatty acid metabolic process | 238/7958 | 390/18723 | 8.24e-14 | 4.84e-12 | 238 |
| GO:004639421 | Liver | HCC | carboxylic acid biosynthetic process | 198/7958 | 314/18723 | 1.19e-13 | 6.78e-12 | 198 |
| GO:000915022 | Liver | HCC | purine ribonucleotide metabolic process | 226/7958 | 368/18723 | 1.36e-13 | 7.69e-12 | 226 |
| GO:007252122 | Liver | HCC | purine-containing compound metabolic process | 250/7958 | 416/18723 | 2.26e-13 | 1.24e-11 | 250 |
| GO:000616322 | Liver | HCC | purine nucleotide metabolic process | 236/7958 | 396/18723 | 3.59e-12 | 1.62e-10 | 236 |
| GO:00338652 | Liver | HCC | nucleoside bisphosphate metabolic process | 88/7958 | 128/18723 | 1.63e-09 | 4.78e-08 | 88 |
| GO:00338752 | Liver | HCC | ribonucleoside bisphosphate metabolic process | 88/7958 | 128/18723 | 1.63e-09 | 4.78e-08 | 88 |
| GO:00340322 | Liver | HCC | purine nucleoside bisphosphate metabolic process | 88/7958 | 128/18723 | 1.63e-09 | 4.78e-08 | 88 |
| GO:00066372 | Liver | HCC | acyl-CoA metabolic process | 67/7958 | 96/18723 | 5.62e-08 | 1.19e-06 | 67 |
| GO:00353832 | Liver | HCC | thioester metabolic process | 67/7958 | 96/18723 | 5.62e-08 | 1.19e-06 | 67 |
| GO:007233021 | Liver | HCC | monocarboxylic acid biosynthetic process | 129/7958 | 214/18723 | 1.08e-07 | 2.09e-06 | 129 |
| GO:000663321 | Liver | HCC | fatty acid biosynthetic process | 96/7958 | 163/18723 | 1.71e-05 | 1.85e-04 | 96 |
| GO:000167621 | Liver | HCC | long-chain fatty acid metabolic process | 60/7958 | 112/18723 | 1.17e-02 | 4.28e-02 | 60 |
| Page: 1 |
| Pathway ID | Tissue | Disease Stage | Description | Gene Ratio | Bg Ratio | pvalue | p.adjust | qvalue | Count |
| Page: 1 |
Top |
Cell-cell communication analysis |
| Identification of potential cell-cell interactions between two cell types and their ligand-receptor pairs for different disease states |
| Ligand | Receptor | LRpair | Pathway | Tissue | Disease Stage |
| Page: 1 |
Top |
Single-cell gene regulatory network inference analysis |
| Find out the significant the regulons (TFs) and the target genes of each regulon across cell types for different disease states |
| TF | Cell Type | Tissue | Disease Stage | Target Gene | RSS | Regulon Activity |
| ∗The dot plots of a searched regulon are shown for all cell subpopulations in each disease state of each tissue based on the regulon specific score inferred using pySCENIC and by calculating the average expression. |
| Page: 1 |
Top |
Somatic mutation of malignant transformation related genes |
| Annotation of somatic variants for genes involved in malignant transformation |
| Hugo Symbol | Variant Class | Variant Classification | dbSNP RS | HGVSc | HGVSp | HGVSp Short | SWISSPROT | BIOTYPE | SIFT | PolyPhen | Tumor Sample Barcode | Tissue | Histology | Sex | Age | Stage | Therapy Types | Drugs | Outcome |
| Page: 1 |
Top |
Related drugs of malignant transformation related genes |
| Identification of chemicals and drugs interact with genes involved in malignant transfromation |
| (DGIdb 4.0) |
| Entrez ID | Symbol | Category | Interaction Types | Drug Claim Name | Drug Name | PMIDs |
| Page: 1 |

Copyright 2023-Present -The University of Texas Health Science Center at Houston |