
|
|||||
|
 | |
| |
| |
| |
| |
| |
|
Gene: LOC101928510 |
Gene summary for LOC101928510 |
| Gene information | Species | Human | Gene symbol | LOC101928510 | Gene ID | 101928510 |
| Gene name | uncharacterized LOC101928510 | |
| Gene Alias | LOC101928510 | |
| Cytomap | 11p13 | |
| Gene Type | ncRNA | GO ID | GO:0006605 | UniProtAcc | NA |
Top |
Malignant transformation analysis |
| Identification of the aberrant gene expression in precancerous and cancerous lesions by comparing the gene expression of stem-like cells in diseased tissues with normal stem cells |
| Entrez ID | Symbol | Replicates | Species | Organ | Tissue | Adj P-value | Log2FC | Malignancy |
| 101928510 | LOC101928510 | HCC1 | Human | Liver | HCC | 6.31e-22 | 1.38e+00 | 0.5336 |
| 101928510 | LOC101928510 | HCC2 | Human | Liver | HCC | 7.39e-40 | 2.08e+00 | 0.5341 |
| 101928510 | LOC101928510 | HCC5 | Human | Liver | HCC | 3.86e-42 | 1.83e+00 | 0.4932 |
| Page: 1 |
| Tissue | Expression Dynamics | Abbreviation |
| Liver | 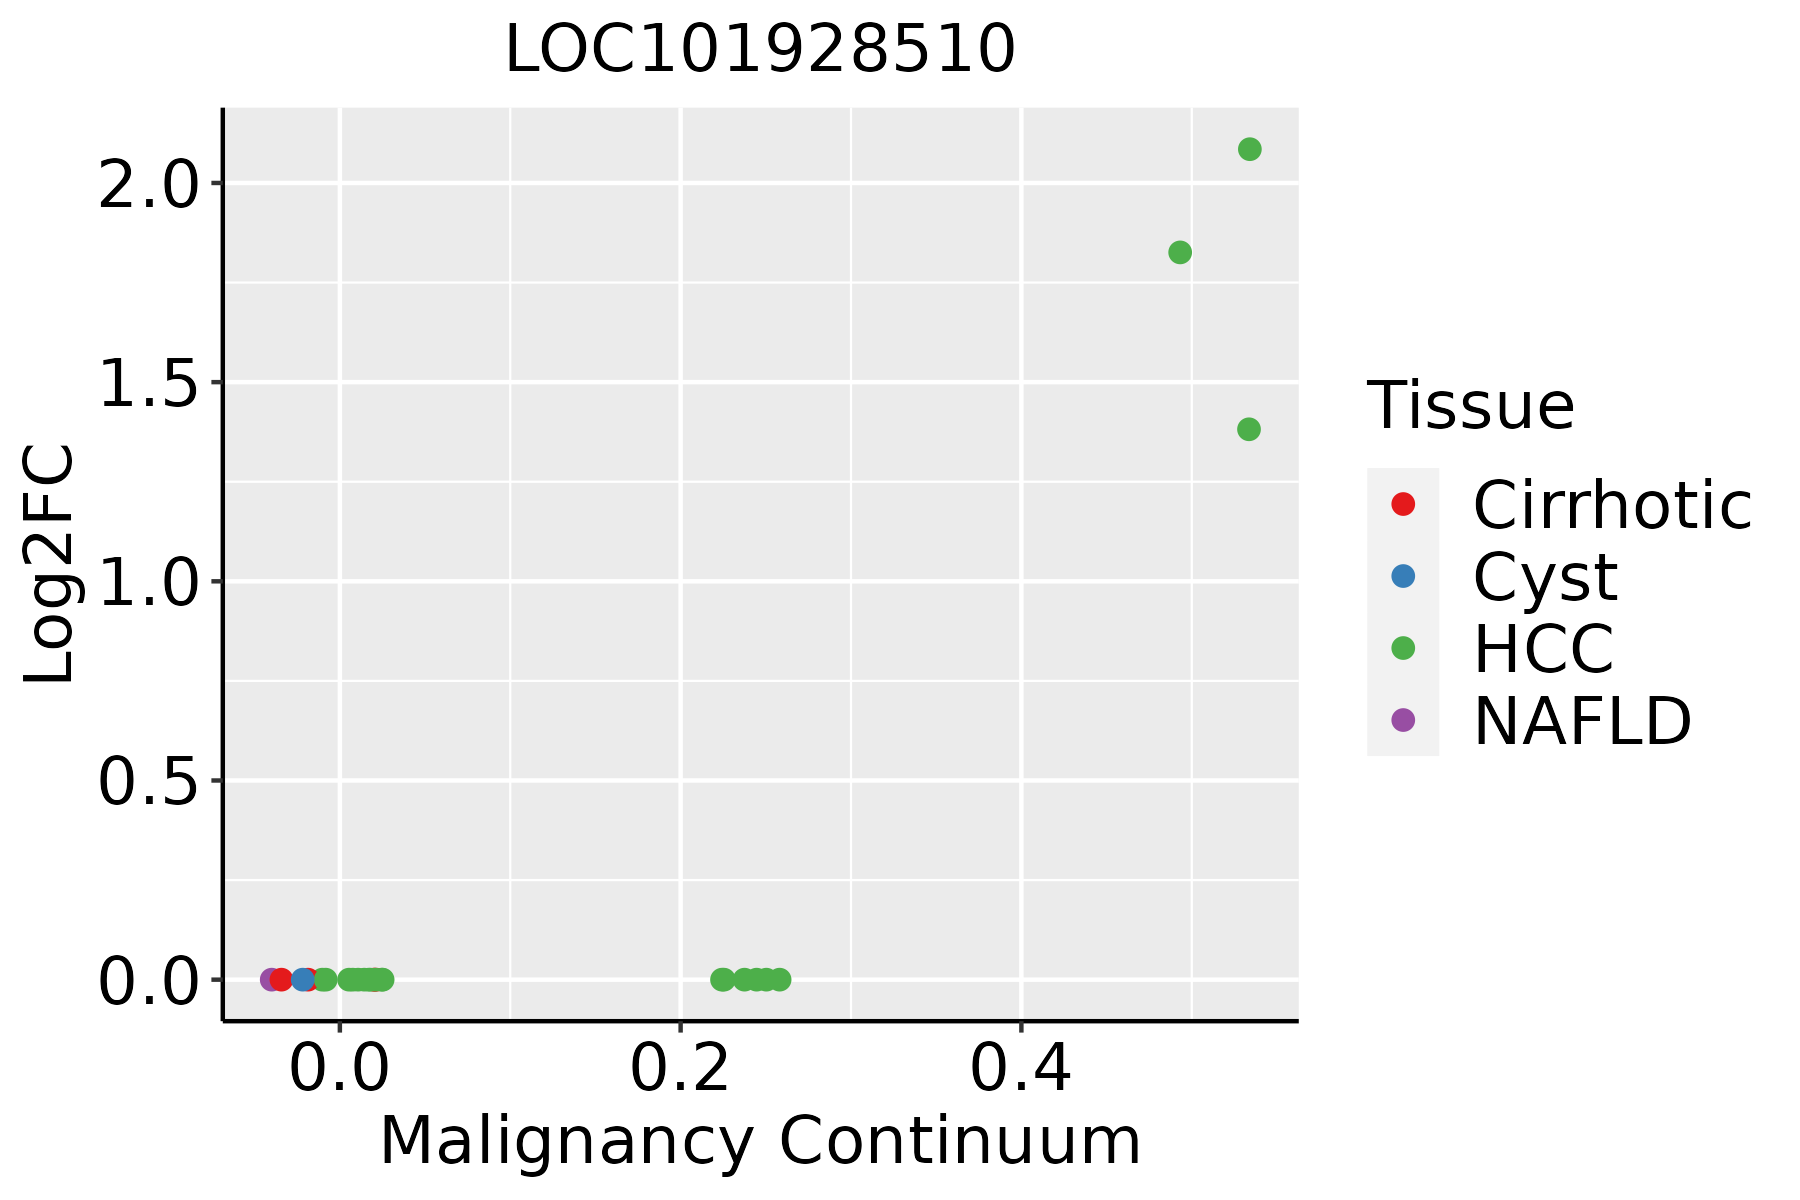 | HCC: Hepatocellular carcinoma |
| NAFLD: Non-alcoholic fatty liver disease |
| ∗log2FC in expression of this searched gene in stem-like cells from each diseased tissue sample relative to stem-like cells in normal samples in each tissue plotted against the malignancy continuum. Samples are colored based on if they are from different disease stage. |
Top |
Malignant transformation related pathway analysis |
| Find out the enriched GO biological processes and KEGG pathways involved in transition from healthy to precancer to cancer |
| Tissue | Disease Stage | Enriched GO biological Processes |
| Colorectum | AD |  |
| Colorectum | SER |  |
| Colorectum | MSS |  |
| Colorectum | MSI-H |  |
| Colorectum | FAP |  |
| ∗Top 15 enriched GO BP terms are showed in the bar plot of each disease state in each tissue. Each row represents a significant GO biological process which is colored according to the -log10(p.adjust). |
| Page: 1 2 3 4 5 6 7 8 9 |
| GO ID | Tissue | Disease Stage | Description | Gene Ratio | Bg Ratio | pvalue | p.adjust | Count |
| GO:007259422 | Liver | HCC | establishment of protein localization to organelle | 299/7958 | 422/18723 | 1.06e-32 | 6.10e-30 | 299 |
| GO:000660512 | Liver | HCC | protein targeting | 219/7958 | 314/18723 | 7.74e-23 | 1.49e-20 | 219 |
| GO:009015012 | Liver | HCC | establishment of protein localization to membrane | 168/7958 | 260/18723 | 4.07e-13 | 2.13e-11 | 168 |
| GO:007097212 | Liver | HCC | protein localization to endoplasmic reticulum | 54/7958 | 74/18723 | 1.01e-07 | 1.98e-06 | 54 |
| GO:007259911 | Liver | HCC | establishment of protein localization to endoplasmic reticulum | 34/7958 | 46/18723 | 1.53e-05 | 1.67e-04 | 34 |
| GO:004504711 | Liver | HCC | protein targeting to ER | 30/7958 | 42/18723 | 1.40e-04 | 1.13e-03 | 30 |
| GO:00066121 | Liver | HCC | protein targeting to membrane | 75/7958 | 131/18723 | 4.58e-04 | 3.04e-03 | 75 |
| GO:00066131 | Liver | HCC | cotranslational protein targeting to membrane | 20/7958 | 31/18723 | 1.11e-02 | 4.09e-02 | 20 |
| Page: 1 |
| Pathway ID | Tissue | Disease Stage | Description | Gene Ratio | Bg Ratio | pvalue | p.adjust | qvalue | Count |
| Page: 1 |
Top |
Cell-cell communication analysis |
| Identification of potential cell-cell interactions between two cell types and their ligand-receptor pairs for different disease states |
| Ligand | Receptor | LRpair | Pathway | Tissue | Disease Stage |
| Page: 1 |
Top |
Single-cell gene regulatory network inference analysis |
| Find out the significant the regulons (TFs) and the target genes of each regulon across cell types for different disease states |
| TF | Cell Type | Tissue | Disease Stage | Target Gene | RSS | Regulon Activity |
| ∗The dot plots of a searched regulon are shown for all cell subpopulations in each disease state of each tissue based on the regulon specific score inferred using pySCENIC and by calculating the average expression. |
| Page: 1 |
Top |
Somatic mutation of malignant transformation related genes |
| Annotation of somatic variants for genes involved in malignant transformation |
| Hugo Symbol | Variant Class | Variant Classification | dbSNP RS | HGVSc | HGVSp | HGVSp Short | SWISSPROT | BIOTYPE | SIFT | PolyPhen | Tumor Sample Barcode | Tissue | Histology | Sex | Age | Stage | Therapy Types | Drugs | Outcome |
| Page: 1 |
Top |
Related drugs of malignant transformation related genes |
| Identification of chemicals and drugs interact with genes involved in malignant transfromation |
| (DGIdb 4.0) |
| Entrez ID | Symbol | Category | Interaction Types | Drug Claim Name | Drug Name | PMIDs |
| Page: 1 |

Copyright 2023-Present -The University of Texas Health Science Center at Houston |