
|
|||||
|
 | |
| |
| |
| |
| |
| |
|
Gene: LNX2 |
Gene summary for LNX2 |
| Gene information | Species | Human | Gene symbol | LNX2 | Gene ID | 222484 |
| Gene name | ligand of numb-protein X 2 | |
| Gene Alias | PDZRN1 | |
| Cytomap | 13q12.2 | |
| Gene Type | protein-coding | GO ID | GO:0006464 | UniProtAcc | Q8N448 |
Top |
Malignant transformation analysis |
| Identification of the aberrant gene expression in precancerous and cancerous lesions by comparing the gene expression of stem-like cells in diseased tissues with normal stem cells |
| Entrez ID | Symbol | Replicates | Species | Organ | Tissue | Adj P-value | Log2FC | Malignancy |
| 222484 | LNX2 | CCI_1 | Human | Cervix | CC | 9.91e-07 | 6.00e-01 | 0.528 |
| 222484 | LNX2 | CCI_2 | Human | Cervix | CC | 6.17e-08 | 9.04e-01 | 0.5249 |
| 222484 | LNX2 | CCI_3 | Human | Cervix | CC | 4.31e-08 | 5.08e-01 | 0.516 |
| 222484 | LNX2 | NAFLD1 | Human | Liver | NAFLD | 5.33e-05 | 7.92e-01 | -0.04 |
| 222484 | LNX2 | HCC1_Meng | Human | Liver | HCC | 5.10e-28 | -8.38e-02 | 0.0246 |
| 222484 | LNX2 | HCC2_Meng | Human | Liver | HCC | 1.18e-09 | -6.89e-02 | 0.0107 |
| 222484 | LNX2 | HCC2 | Human | Liver | HCC | 2.43e-03 | 1.98e+00 | 0.5341 |
| 222484 | LNX2 | RNA-P25T1-P25T1-1 | Human | Lung | AIS | 4.48e-13 | 7.01e-01 | -0.2116 |
| 222484 | LNX2 | RNA-P25T1-P25T1-2 | Human | Lung | AIS | 2.69e-03 | 7.14e-01 | -0.1941 |
| 222484 | LNX2 | RNA-P25T1-P25T1-4 | Human | Lung | AIS | 5.58e-09 | 7.04e-01 | -0.2119 |
| 222484 | LNX2 | RNA-P6T2-P6T2-1 | Human | Lung | IAC | 2.78e-07 | 3.27e-01 | -0.0166 |
| 222484 | LNX2 | RNA-P6T2-P6T2-2 | Human | Lung | IAC | 4.10e-08 | 2.90e-01 | -0.0132 |
| 222484 | LNX2 | RNA-P6T2-P6T2-3 | Human | Lung | IAC | 1.41e-11 | 4.13e-01 | -0.013 |
| 222484 | LNX2 | RNA-P6T2-P6T2-4 | Human | Lung | IAC | 1.12e-05 | 3.86e-01 | -0.0121 |
| 222484 | LNX2 | RNA-P7T1-P7T1-1 | Human | Lung | AIS | 7.41e-03 | 4.78e-01 | -0.0961 |
| 222484 | LNX2 | RNA-P7T1-P7T1-2 | Human | Lung | AIS | 4.18e-06 | 5.65e-01 | -0.0876 |
| 222484 | LNX2 | RNA-P7T1-P7T1-3 | Human | Lung | AIS | 1.16e-06 | 7.15e-01 | -0.0822 |
| 222484 | LNX2 | RNA-P7T1-P7T1-4 | Human | Lung | AIS | 5.29e-03 | 4.76e-01 | -0.0809 |
| 222484 | LNX2 | RNA-P8T2-P8T2-3 | Human | Lung | AIS | 3.10e-04 | 8.58e-01 | -0.1284 |
| Page: 1 |
| Tissue | Expression Dynamics | Abbreviation |
| Cervix | 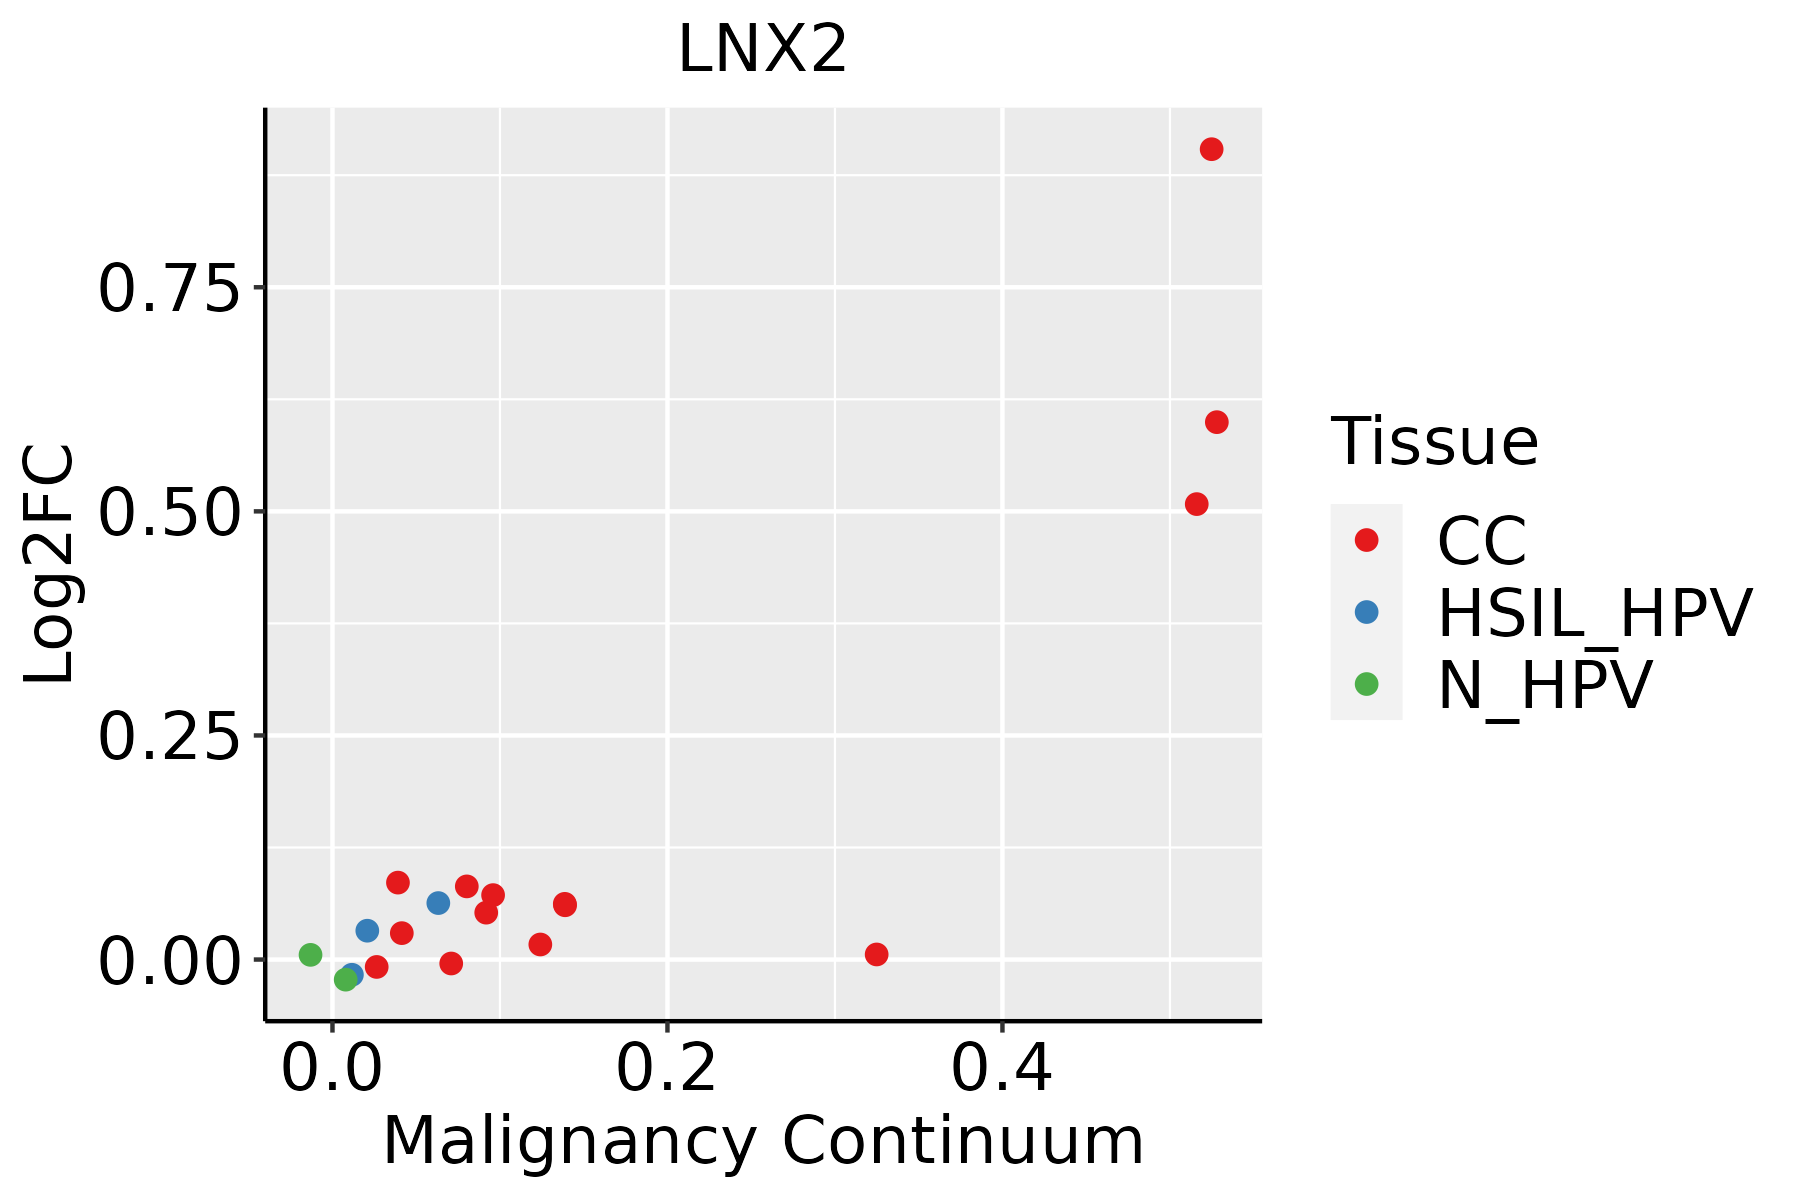 | CC: Cervix cancer |
| HSIL_HPV: HPV-infected high-grade squamous intraepithelial lesions | ||
| N_HPV: HPV-infected normal cervix | ||
| Liver | 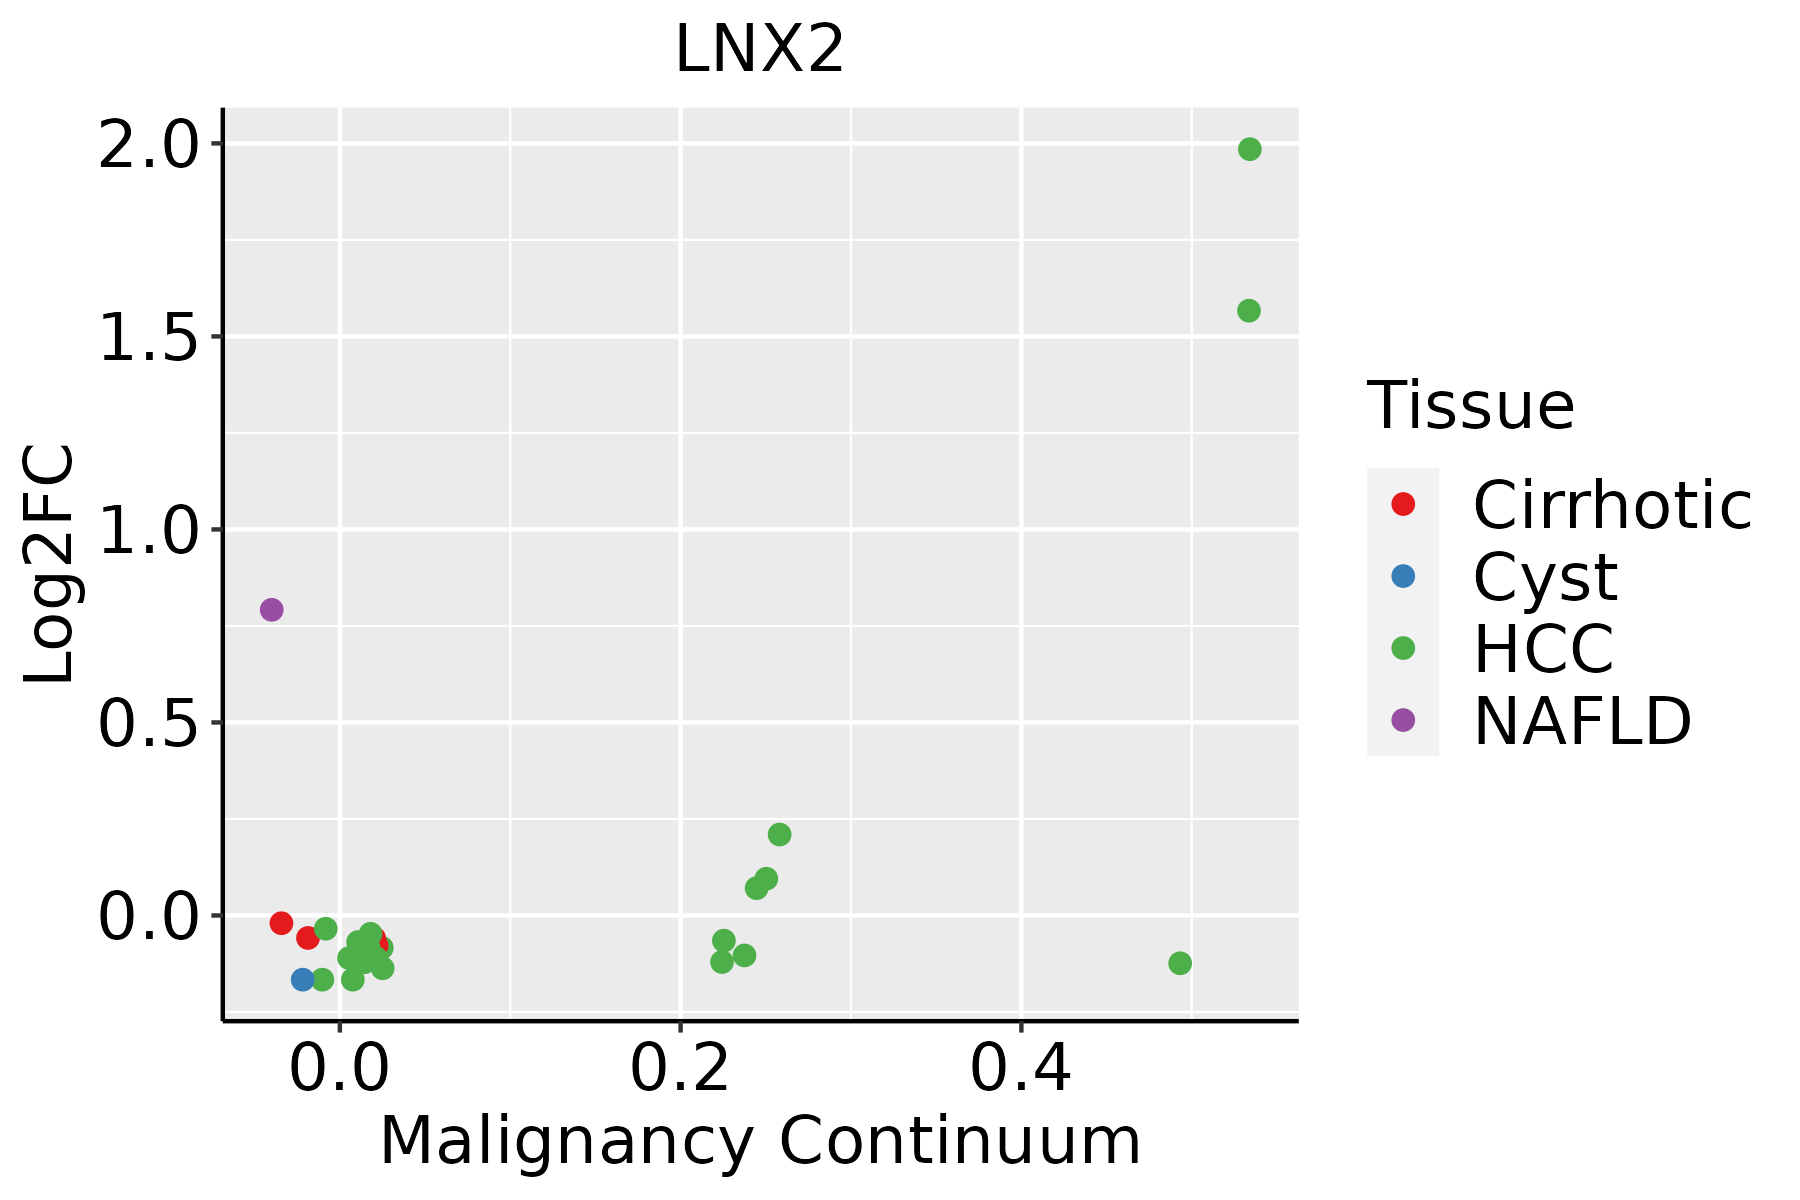 | HCC: Hepatocellular carcinoma |
| NAFLD: Non-alcoholic fatty liver disease | ||
| Lung |  | AAH: Atypical adenomatous hyperplasia |
| AIS: Adenocarcinoma in situ | ||
| IAC: Invasive lung adenocarcinoma | ||
| MIA: Minimally invasive adenocarcinoma |
| ∗log2FC in expression of this searched gene in stem-like cells from each diseased tissue sample relative to stem-like cells in normal samples in each tissue plotted against the malignancy continuum. Samples are colored based on if they are from different disease stage. |
Top |
Malignant transformation related pathway analysis |
| Find out the enriched GO biological processes and KEGG pathways involved in transition from healthy to precancer to cancer |
| Tissue | Disease Stage | Enriched GO biological Processes |
| Colorectum | AD |  |
| Colorectum | SER |  |
| Colorectum | MSS |  |
| Colorectum | MSI-H |  |
| Colorectum | FAP |  |
| ∗Top 15 enriched GO BP terms are showed in the bar plot of each disease state in each tissue. Each row represents a significant GO biological process which is colored according to the -log10(p.adjust). |
| Page: 1 2 3 4 5 6 7 8 9 |
| GO ID | Tissue | Disease Stage | Description | Gene Ratio | Bg Ratio | pvalue | p.adjust | Count |
| Page: 1 |
| Pathway ID | Tissue | Disease Stage | Description | Gene Ratio | Bg Ratio | pvalue | p.adjust | qvalue | Count |
| Page: 1 |
Top |
Cell-cell communication analysis |
| Identification of potential cell-cell interactions between two cell types and their ligand-receptor pairs for different disease states |
| Ligand | Receptor | LRpair | Pathway | Tissue | Disease Stage |
| Page: 1 |
Top |
Single-cell gene regulatory network inference analysis |
| Find out the significant the regulons (TFs) and the target genes of each regulon across cell types for different disease states |
| TF | Cell Type | Tissue | Disease Stage | Target Gene | RSS | Regulon Activity |
| ∗The dot plots of a searched regulon are shown for all cell subpopulations in each disease state of each tissue based on the regulon specific score inferred using pySCENIC and by calculating the average expression. |
| Page: 1 |
Top |
Somatic mutation of malignant transformation related genes |
| Annotation of somatic variants for genes involved in malignant transformation |
| Hugo Symbol | Variant Class | Variant Classification | dbSNP RS | HGVSc | HGVSp | HGVSp Short | SWISSPROT | BIOTYPE | SIFT | PolyPhen | Tumor Sample Barcode | Tissue | Histology | Sex | Age | Stage | Therapy Types | Drugs | Outcome |
| LNX2 | SNV | Missense_Mutation | c.1256C>A | p.Ala419Asp | p.A419D | Q8N448 | protein_coding | tolerated(0.24) | benign(0.222) | TCGA-A2-A25E-01 | Breast | breast invasive carcinoma | Female | <65 | III/IV | Chemotherapy | cytoxan | PD | |
| LNX2 | SNV | Missense_Mutation | c.1660N>A | p.Glu554Lys | p.E554K | Q8N448 | protein_coding | deleterious(0.01) | benign(0.119) | TCGA-AC-A23H-01 | Breast | breast invasive carcinoma | Female | >=65 | I/II | Unknown | Unknown | PD | |
| LNX2 | SNV | Missense_Mutation | c.703G>C | p.Glu235Gln | p.E235Q | Q8N448 | protein_coding | deleterious(0.03) | probably_damaging(0.975) | TCGA-D8-A1XW-01 | Breast | breast invasive carcinoma | Female | <65 | I/II | Chemotherapy | adriamycin+cyclophosphamide | SD | |
| LNX2 | insertion | Nonsense_Mutation | novel | c.759_760insTTATCTCTATAGTGCTTTGTTGTTGTTTCTAAGGAATTCACAGTG | p.Asn253_Glu254insLeuSerLeuTerCysPheValValValSerLysGluPheThrVal | p.N253_E254insLSL*CFVVVSKEFTV | Q8N448 | protein_coding | TCGA-A8-A0A1-01 | Breast | breast invasive carcinoma | Female | >=65 | I/II | Hormone Therapy | tamoxiphen | SD | ||
| LNX2 | SNV | Missense_Mutation | novel | c.785T>G | p.Ile262Ser | p.I262S | Q8N448 | protein_coding | deleterious(0) | probably_damaging(0.995) | TCGA-2W-A8YY-01 | Cervix | cervical & endocervical cancer | Female | <65 | I/II | Chemotherapy | cisplatin | CR |
| LNX2 | SNV | Missense_Mutation | c.478N>C | p.Glu160Gln | p.E160Q | Q8N448 | protein_coding | tolerated(0.37) | benign(0.01) | TCGA-DR-A0ZM-01 | Cervix | cervical & endocervical cancer | Female | <65 | III/IV | Unspecific | Cisplatin | SD | |
| LNX2 | SNV | Missense_Mutation | c.1950G>C | p.Met650Ile | p.M650I | Q8N448 | protein_coding | tolerated(0.48) | benign(0.023) | TCGA-EA-A3HR-01 | Cervix | cervical & endocervical cancer | Female | <65 | I/II | Unknown | Unknown | SD | |
| LNX2 | SNV | Missense_Mutation | c.956N>A | p.Arg319His | p.R319H | Q8N448 | protein_coding | tolerated(0.07) | probably_damaging(0.943) | TCGA-AA-3811-01 | Colorectum | colon adenocarcinoma | Female | >=65 | III/IV | Unknown | Unknown | PD | |
| LNX2 | SNV | Missense_Mutation | c.1054N>T | p.Gly352Cys | p.G352C | Q8N448 | protein_coding | deleterious(0) | probably_damaging(1) | TCGA-AA-3818-01 | Colorectum | colon adenocarcinoma | Female | >=65 | I/II | Unknown | Unknown | PD | |
| LNX2 | SNV | Missense_Mutation | rs199501730 | c.568N>T | p.Arg190Trp | p.R190W | Q8N448 | protein_coding | deleterious(0) | possibly_damaging(0.586) | TCGA-AA-3949-01 | Colorectum | colon adenocarcinoma | Female | >=65 | III/IV | Unknown | Unknown | SD |
| Page: 1 2 3 4 5 6 7 |
Top |
Related drugs of malignant transformation related genes |
| Identification of chemicals and drugs interact with genes involved in malignant transfromation |
| (DGIdb 4.0) |
| Entrez ID | Symbol | Category | Interaction Types | Drug Claim Name | Drug Name | PMIDs |
| Page: 1 |

Copyright 2023-Present -The University of Texas Health Science Center at Houston |