
|
|||||
|
 | |
| |
| |
| |
| |
| |
|
Gene: LNX1 |
Gene summary for LNX1 |
| Gene information | Species | Human | Gene symbol | LNX1 | Gene ID | 84708 |
| Gene name | ligand of numb-protein X 1 | |
| Gene Alias | LNX | |
| Cytomap | 4q12 | |
| Gene Type | protein-coding | GO ID | GO:0006464 | UniProtAcc | Q8TBB1 |
Top |
Malignant transformation analysis |
| Identification of the aberrant gene expression in precancerous and cancerous lesions by comparing the gene expression of stem-like cells in diseased tissues with normal stem cells |
| Entrez ID | Symbol | Replicates | Species | Organ | Tissue | Adj P-value | Log2FC | Malignancy |
| 84708 | LNX1 | LZE7T | Human | Esophagus | ESCC | 3.82e-02 | 2.76e-01 | 0.0667 |
| 84708 | LNX1 | LZE24T | Human | Esophagus | ESCC | 2.70e-06 | 3.55e-02 | 0.0596 |
| 84708 | LNX1 | P1T-E | Human | Esophagus | ESCC | 1.16e-02 | 1.71e-01 | 0.0875 |
| 84708 | LNX1 | P2T-E | Human | Esophagus | ESCC | 4.25e-19 | 3.99e-01 | 0.1177 |
| 84708 | LNX1 | P4T-E | Human | Esophagus | ESCC | 1.36e-05 | 1.02e-01 | 0.1323 |
| 84708 | LNX1 | P8T-E | Human | Esophagus | ESCC | 4.80e-21 | 2.96e-01 | 0.0889 |
| 84708 | LNX1 | P9T-E | Human | Esophagus | ESCC | 3.58e-08 | 8.19e-02 | 0.1131 |
| 84708 | LNX1 | P10T-E | Human | Esophagus | ESCC | 5.73e-09 | 1.54e-02 | 0.116 |
| 84708 | LNX1 | P11T-E | Human | Esophagus | ESCC | 4.55e-02 | 2.42e-02 | 0.1426 |
| 84708 | LNX1 | P12T-E | Human | Esophagus | ESCC | 1.74e-30 | 7.62e-01 | 0.1122 |
| 84708 | LNX1 | P15T-E | Human | Esophagus | ESCC | 6.25e-17 | 4.89e-01 | 0.1149 |
| 84708 | LNX1 | P16T-E | Human | Esophagus | ESCC | 1.76e-15 | 1.90e-01 | 0.1153 |
| 84708 | LNX1 | P17T-E | Human | Esophagus | ESCC | 3.70e-02 | 6.70e-02 | 0.1278 |
| 84708 | LNX1 | P20T-E | Human | Esophagus | ESCC | 2.95e-06 | 1.01e-01 | 0.1124 |
| 84708 | LNX1 | P22T-E | Human | Esophagus | ESCC | 3.81e-08 | 1.34e-01 | 0.1236 |
| 84708 | LNX1 | P23T-E | Human | Esophagus | ESCC | 3.37e-15 | 3.18e-01 | 0.108 |
| 84708 | LNX1 | P24T-E | Human | Esophagus | ESCC | 5.68e-09 | -1.83e-02 | 0.1287 |
| 84708 | LNX1 | P26T-E | Human | Esophagus | ESCC | 3.58e-31 | 6.41e-01 | 0.1276 |
| 84708 | LNX1 | P27T-E | Human | Esophagus | ESCC | 3.03e-15 | 2.51e-01 | 0.1055 |
| 84708 | LNX1 | P28T-E | Human | Esophagus | ESCC | 3.30e-15 | 5.18e-01 | 0.1149 |
| Page: 1 2 3 |
| Tissue | Expression Dynamics | Abbreviation |
| Esophagus | 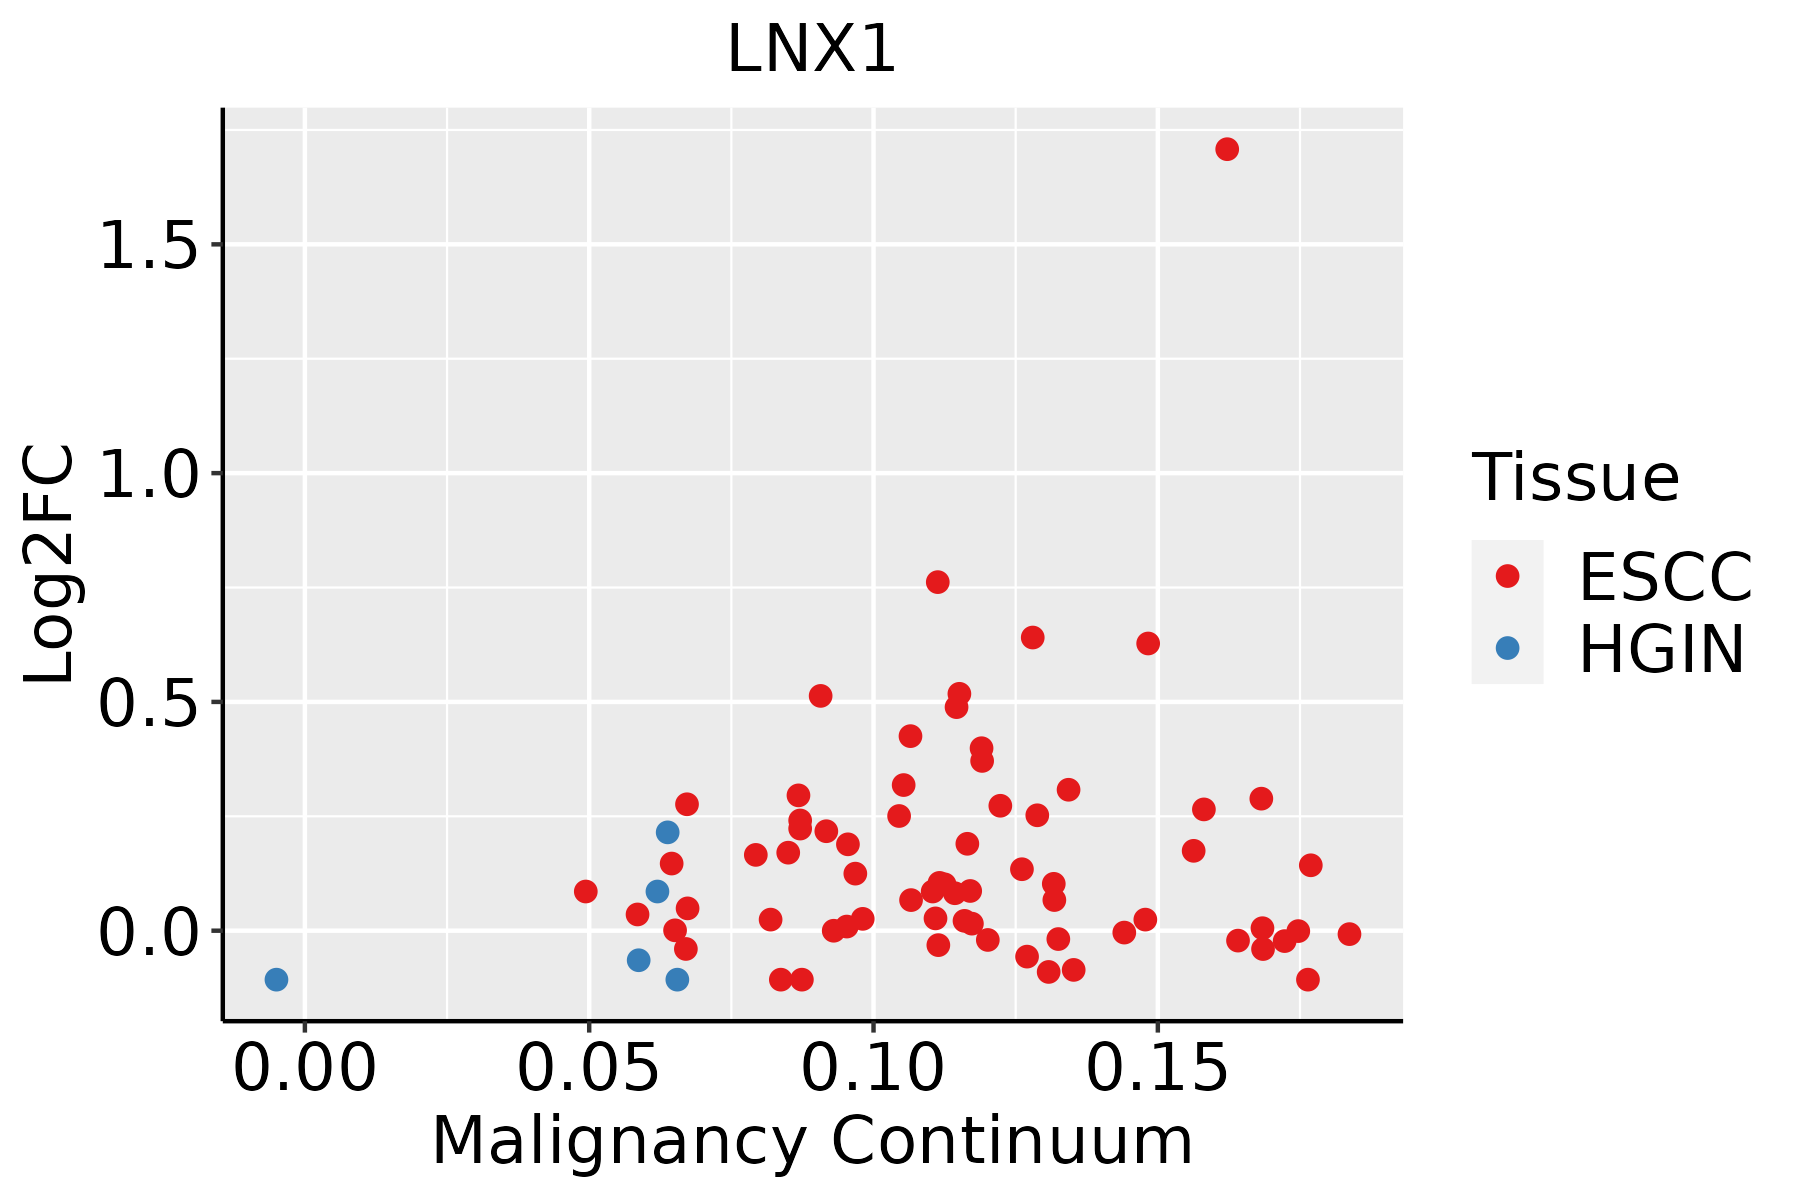 | ESCC: Esophageal squamous cell carcinoma |
| HGIN: High-grade intraepithelial neoplasias | ||
| LGIN: Low-grade intraepithelial neoplasias |
| ∗log2FC in expression of this searched gene in stem-like cells from each diseased tissue sample relative to stem-like cells in normal samples in each tissue plotted against the malignancy continuum. Samples are colored based on if they are from different disease stage. |
Top |
Malignant transformation related pathway analysis |
| Find out the enriched GO biological processes and KEGG pathways involved in transition from healthy to precancer to cancer |
| Tissue | Disease Stage | Enriched GO biological Processes |
| Colorectum | AD |  |
| Colorectum | SER |  |
| Colorectum | MSS |  |
| Colorectum | MSI-H |  |
| Colorectum | FAP |  |
| ∗Top 15 enriched GO BP terms are showed in the bar plot of each disease state in each tissue. Each row represents a significant GO biological process which is colored according to the -log10(p.adjust). |
| Page: 1 2 3 4 5 6 7 8 9 |
| GO ID | Tissue | Disease Stage | Description | Gene Ratio | Bg Ratio | pvalue | p.adjust | Count |
| Page: 1 |
| Pathway ID | Tissue | Disease Stage | Description | Gene Ratio | Bg Ratio | pvalue | p.adjust | qvalue | Count |
| Page: 1 |
Top |
Cell-cell communication analysis |
| Identification of potential cell-cell interactions between two cell types and their ligand-receptor pairs for different disease states |
| Ligand | Receptor | LRpair | Pathway | Tissue | Disease Stage |
| Page: 1 |
Top |
Single-cell gene regulatory network inference analysis |
| Find out the significant the regulons (TFs) and the target genes of each regulon across cell types for different disease states |
| TF | Cell Type | Tissue | Disease Stage | Target Gene | RSS | Regulon Activity |
| ∗The dot plots of a searched regulon are shown for all cell subpopulations in each disease state of each tissue based on the regulon specific score inferred using pySCENIC and by calculating the average expression. |
| Page: 1 |
Top |
Somatic mutation of malignant transformation related genes |
| Annotation of somatic variants for genes involved in malignant transformation |
| Hugo Symbol | Variant Class | Variant Classification | dbSNP RS | HGVSc | HGVSp | HGVSp Short | SWISSPROT | BIOTYPE | SIFT | PolyPhen | Tumor Sample Barcode | Tissue | Histology | Sex | Age | Stage | Therapy Types | Drugs | Outcome |
| LNX1 | SNV | Missense_Mutation | rs759216838 | c.1958T>C | p.Ile653Thr | p.I653T | Q8TBB1 | protein_coding | deleterious(0) | probably_damaging(0.999) | TCGA-A7-A4SE-01 | Breast | breast invasive carcinoma | Female | <65 | I/II | Chemotherapy | adriamycin | CR |
| LNX1 | SNV | Missense_Mutation | c.812N>G | p.Glu271Gly | p.E271G | Q8TBB1 | protein_coding | deleterious(0) | possibly_damaging(0.791) | TCGA-A8-A08F-01 | Breast | breast invasive carcinoma | Female | <65 | III/IV | Chemotherapy | 5-fluorouracil | CR | |
| LNX1 | SNV | Missense_Mutation | c.1123N>T | p.Pro375Ser | p.P375S | Q8TBB1 | protein_coding | tolerated(0.24) | benign(0.007) | TCGA-A8-A09I-01 | Breast | breast invasive carcinoma | Female | >=65 | I/II | Hormone Therapy | anastrozole | SD | |
| LNX1 | SNV | Missense_Mutation | c.1693N>A | p.Glu565Lys | p.E565K | Q8TBB1 | protein_coding | deleterious(0) | benign(0.12) | TCGA-AC-A23C-01 | Breast | breast invasive carcinoma | Female | <65 | I/II | Chemotherapy | chemo | CR | |
| LNX1 | SNV | Missense_Mutation | rs766762059 | c.1256G>A | p.Arg419Gln | p.R419Q | Q8TBB1 | protein_coding | tolerated(0.53) | probably_damaging(0.999) | TCGA-AN-A046-01 | Breast | breast invasive carcinoma | Female | >=65 | I/II | Unknown | Unknown | SD |
| LNX1 | SNV | Missense_Mutation | c.828G>C | p.Lys276Asn | p.K276N | Q8TBB1 | protein_coding | tolerated(0.1) | probably_damaging(0.992) | TCGA-BH-A0H5-01 | Breast | breast invasive carcinoma | Female | <65 | I/II | Chemotherapy | cytoxan | CR | |
| LNX1 | SNV | Missense_Mutation | c.1102N>A | p.Gln368Lys | p.Q368K | Q8TBB1 | protein_coding | tolerated(0.84) | benign(0.021) | TCGA-C8-A138-01 | Breast | breast invasive carcinoma | Female | <65 | III/IV | Unknown | Unknown | SD | |
| LNX1 | SNV | Missense_Mutation | c.1121N>C | p.Arg374Thr | p.R374T | Q8TBB1 | protein_coding | tolerated(0.41) | benign(0) | TCGA-D8-A1XL-01 | Breast | breast invasive carcinoma | Female | <65 | I/II | Chemotherapy | doxorubicine+cyclophosphamide+tamoxifen | SD | |
| LNX1 | SNV | Missense_Mutation | novel | c.705N>C | p.Lys235Asn | p.K235N | Q8TBB1 | protein_coding | tolerated(0.13) | probably_damaging(0.999) | TCGA-EW-A3E8-01 | Breast | breast invasive carcinoma | Female | <65 | I/II | Hormone Therapy | anastrozole | SD |
| LNX1 | insertion | Nonsense_Mutation | novel | c.1076_1077insAATGATAAATAGTACCTGGAGCCTGGGGTGTGTATTTTAAAAAGCAGC | p.Gln359_Lys360insMetIleAsnSerThrTrpSerLeuGlyCysValPheTerLysAlaAla | p.Q359_K360insMINSTWSLGCVF*KAA | Q8TBB1 | protein_coding | TCGA-B6-A0I8-01 | Breast | breast invasive carcinoma | Female | <65 | I/II | Unknown | Unknown | PD |
| Page: 1 2 3 4 5 6 7 8 |
Top |
Related drugs of malignant transformation related genes |
| Identification of chemicals and drugs interact with genes involved in malignant transfromation |
| (DGIdb 4.0) |
| Entrez ID | Symbol | Category | Interaction Types | Drug Claim Name | Drug Name | PMIDs |
| Page: 1 |

Copyright 2023-Present -The University of Texas Health Science Center at Houston |