
|
|||||
|
 | |
| |
| |
| |
| |
| |
|
Gene: LNPK |
Gene summary for LNPK |
| Gene information | Species | Human | Gene symbol | LNPK | Gene ID | 80856 |
| Gene name | lunapark, ER junction formation factor | |
| Gene Alias | KIAA1715 | |
| Cytomap | 2q31.1 | |
| Gene Type | protein-coding | GO ID | GO:0001501 | UniProtAcc | Q9C0E8 |
Top |
Malignant transformation analysis |
| Identification of the aberrant gene expression in precancerous and cancerous lesions by comparing the gene expression of stem-like cells in diseased tissues with normal stem cells |
| Entrez ID | Symbol | Replicates | Species | Organ | Tissue | Adj P-value | Log2FC | Malignancy |
| 80856 | LNPK | NAFLD1 | Human | Liver | NAFLD | 6.76e-04 | 3.71e-01 | -0.04 |
| 80856 | LNPK | HCC1 | Human | Liver | HCC | 1.57e-14 | 3.56e+00 | 0.5336 |
| 80856 | LNPK | HCC2 | Human | Liver | HCC | 3.94e-19 | 3.44e+00 | 0.5341 |
| 80856 | LNPK | HCC5 | Human | Liver | HCC | 1.45e-11 | 1.77e+00 | 0.4932 |
| 80856 | LNPK | S014 | Human | Liver | HCC | 5.82e-03 | 2.32e-01 | 0.2254 |
| 80856 | LNPK | S015 | Human | Liver | HCC | 1.23e-03 | 2.78e-01 | 0.2375 |
| 80856 | LNPK | S016 | Human | Liver | HCC | 2.76e-05 | 2.84e-01 | 0.2243 |
| 80856 | LNPK | S027 | Human | Liver | HCC | 2.64e-06 | 5.73e-01 | 0.2446 |
| 80856 | LNPK | S028 | Human | Liver | HCC | 4.40e-16 | 6.34e-01 | 0.2503 |
| 80856 | LNPK | S029 | Human | Liver | HCC | 2.96e-09 | 4.83e-01 | 0.2581 |
| 80856 | LNPK | male-WTA | Human | Thyroid | PTC | 7.27e-07 | 6.45e-02 | 0.1037 |
| 80856 | LNPK | PTC01 | Human | Thyroid | PTC | 8.37e-03 | 2.30e-02 | 0.1899 |
| 80856 | LNPK | PTC04 | Human | Thyroid | PTC | 2.90e-08 | 7.76e-02 | 0.1927 |
| 80856 | LNPK | PTC05 | Human | Thyroid | PTC | 1.69e-08 | 3.18e-01 | 0.2065 |
| 80856 | LNPK | PTC06 | Human | Thyroid | PTC | 3.54e-17 | 3.50e-01 | 0.2057 |
| 80856 | LNPK | PTC07 | Human | Thyroid | PTC | 2.19e-12 | 1.69e-01 | 0.2044 |
| 80856 | LNPK | ATC09 | Human | Thyroid | ATC | 1.32e-05 | 1.43e-01 | 0.2871 |
| 80856 | LNPK | ATC11 | Human | Thyroid | ATC | 4.53e-03 | 3.99e-01 | 0.3386 |
| 80856 | LNPK | ATC12 | Human | Thyroid | ATC | 1.33e-11 | 3.30e-01 | 0.34 |
| 80856 | LNPK | ATC13 | Human | Thyroid | ATC | 2.45e-28 | 5.55e-01 | 0.34 |
| Page: 1 2 |
| Tissue | Expression Dynamics | Abbreviation |
| Liver |  | HCC: Hepatocellular carcinoma |
| NAFLD: Non-alcoholic fatty liver disease | ||
| Thyroid | 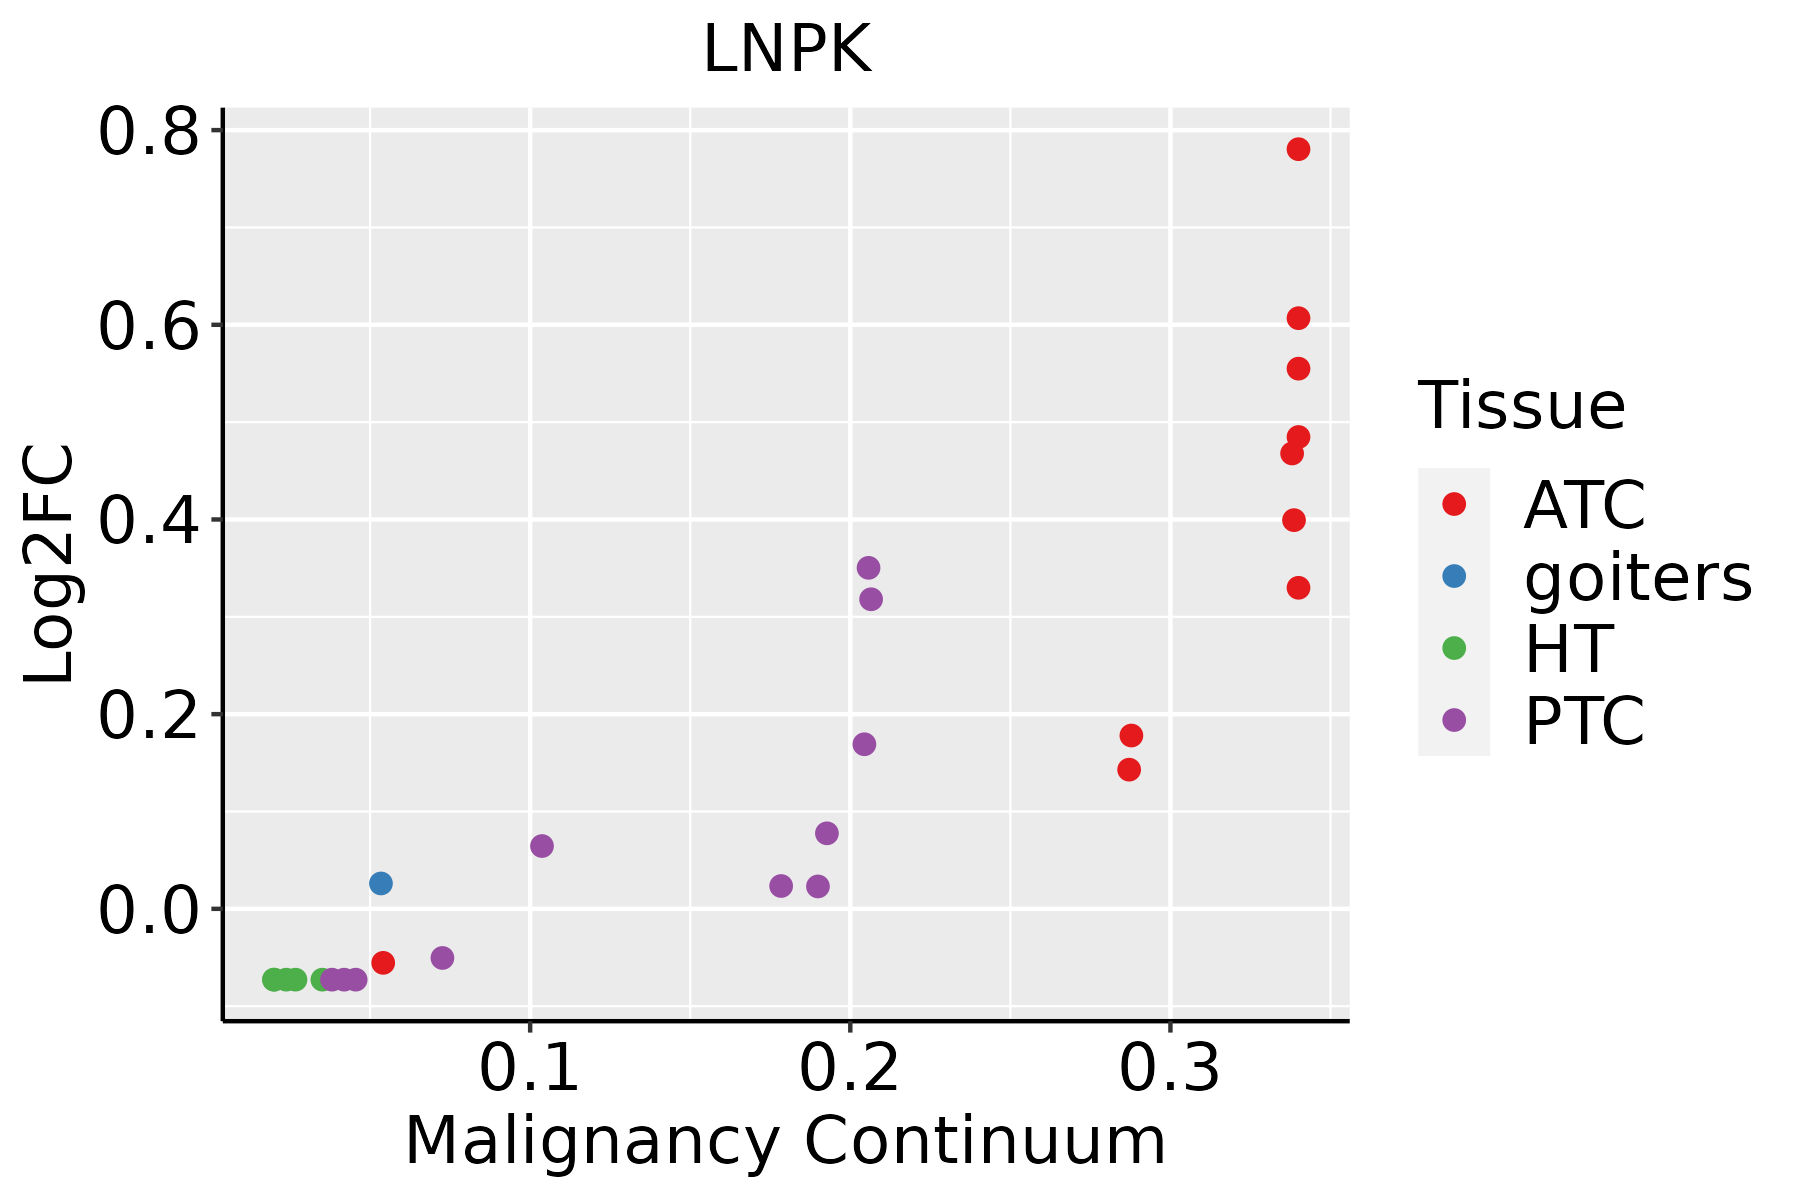 | ATC: Anaplastic thyroid cancer |
| HT: Hashimoto's thyroiditis | ||
| PTC: Papillary thyroid cancer |
| ∗log2FC in expression of this searched gene in stem-like cells from each diseased tissue sample relative to stem-like cells in normal samples in each tissue plotted against the malignancy continuum. Samples are colored based on if they are from different disease stage. |
Top |
Malignant transformation related pathway analysis |
| Find out the enriched GO biological processes and KEGG pathways involved in transition from healthy to precancer to cancer |
| Tissue | Disease Stage | Enriched GO biological Processes |
| Colorectum | AD |  |
| Colorectum | SER |  |
| Colorectum | MSS |  |
| Colorectum | MSI-H |  |
| Colorectum | FAP |  |
| ∗Top 15 enriched GO BP terms are showed in the bar plot of each disease state in each tissue. Each row represents a significant GO biological process which is colored according to the -log10(p.adjust). |
| Page: 1 2 3 4 5 6 7 8 9 |
| GO ID | Tissue | Disease Stage | Description | Gene Ratio | Bg Ratio | pvalue | p.adjust | Count |
| GO:00420607 | Liver | NAFLD | wound healing | 84/1882 | 422/18723 | 6.56e-10 | 1.37e-07 | 84 |
| GO:00075994 | Liver | NAFLD | hemostasis | 49/1882 | 222/18723 | 9.23e-08 | 7.59e-06 | 49 |
| GO:00075964 | Liver | NAFLD | blood coagulation | 48/1882 | 217/18723 | 1.16e-07 | 8.81e-06 | 48 |
| GO:00508174 | Liver | NAFLD | coagulation | 48/1882 | 222/18723 | 2.40e-07 | 1.61e-05 | 48 |
| GO:00508787 | Liver | NAFLD | regulation of body fluid levels | 60/1882 | 379/18723 | 2.61e-04 | 4.23e-03 | 60 |
| GO:00717863 | Liver | NAFLD | endoplasmic reticulum tubular network organization | 6/1882 | 18/18723 | 6.55e-03 | 4.69e-02 | 6 |
| GO:000702911 | Liver | HCC | endoplasmic reticulum organization | 64/7958 | 87/18723 | 3.92e-09 | 1.04e-07 | 64 |
| GO:004206022 | Liver | HCC | wound healing | 219/7958 | 422/18723 | 5.34e-05 | 5.04e-04 | 219 |
| GO:00075962 | Liver | HCC | blood coagulation | 118/7958 | 217/18723 | 2.63e-04 | 1.94e-03 | 118 |
| GO:00717862 | Liver | HCC | endoplasmic reticulum tubular network organization | 15/7958 | 18/18723 | 4.74e-04 | 3.12e-03 | 15 |
| GO:00075992 | Liver | HCC | hemostasis | 119/7958 | 222/18723 | 5.25e-04 | 3.41e-03 | 119 |
| GO:00508172 | Liver | HCC | coagulation | 118/7958 | 222/18723 | 8.41e-04 | 5.03e-03 | 118 |
| GO:005087822 | Liver | HCC | regulation of body fluid levels | 191/7958 | 379/18723 | 1.06e-03 | 6.11e-03 | 191 |
| GO:0042060112 | Thyroid | PTC | wound healing | 190/5968 | 422/18723 | 7.72e-09 | 1.92e-07 | 190 |
| GO:000702915 | Thyroid | PTC | endoplasmic reticulum organization | 51/5968 | 87/18723 | 2.37e-07 | 4.15e-06 | 51 |
| GO:007178613 | Thyroid | PTC | endoplasmic reticulum tubular network organization | 14/5968 | 18/18723 | 8.31e-05 | 7.01e-04 | 14 |
| GO:004206034 | Thyroid | ATC | wound healing | 210/6293 | 422/18723 | 3.33e-12 | 1.37e-10 | 210 |
| GO:000702921 | Thyroid | ATC | endoplasmic reticulum organization | 51/6293 | 87/18723 | 1.47e-06 | 1.81e-05 | 51 |
| GO:007178622 | Thyroid | ATC | endoplasmic reticulum tubular network organization | 14/6293 | 18/18723 | 1.59e-04 | 1.10e-03 | 14 |
| GO:00020624 | Thyroid | ATC | chondrocyte differentiation | 54/6293 | 106/18723 | 1.67e-04 | 1.14e-03 | 54 |
| Page: 1 2 |
| Pathway ID | Tissue | Disease Stage | Description | Gene Ratio | Bg Ratio | pvalue | p.adjust | qvalue | Count |
| Page: 1 |
Top |
Cell-cell communication analysis |
| Identification of potential cell-cell interactions between two cell types and their ligand-receptor pairs for different disease states |
| Ligand | Receptor | LRpair | Pathway | Tissue | Disease Stage |
| Page: 1 |
Top |
Single-cell gene regulatory network inference analysis |
| Find out the significant the regulons (TFs) and the target genes of each regulon across cell types for different disease states |
| TF | Cell Type | Tissue | Disease Stage | Target Gene | RSS | Regulon Activity |
| ∗The dot plots of a searched regulon are shown for all cell subpopulations in each disease state of each tissue based on the regulon specific score inferred using pySCENIC and by calculating the average expression. |
| Page: 1 |
Top |
Somatic mutation of malignant transformation related genes |
| Annotation of somatic variants for genes involved in malignant transformation |
| Hugo Symbol | Variant Class | Variant Classification | dbSNP RS | HGVSc | HGVSp | HGVSp Short | SWISSPROT | BIOTYPE | SIFT | PolyPhen | Tumor Sample Barcode | Tissue | Histology | Sex | Age | Stage | Therapy Types | Drugs | Outcome |
| LNPK | SNV | Missense_Mutation | c.437N>G | p.Ala146Gly | p.A146G | Q9C0E8 | protein_coding | tolerated(0.1) | benign(0.142) | TCGA-A8-A07W-01 | Breast | breast invasive carcinoma | Female | >=65 | III/IV | Hormone Therapy | exemestane | SD | |
| LNPK | SNV | Missense_Mutation | c.1334N>G | p.Ser445Cys | p.S445C | Q9C0E8 | protein_coding | deleterious_low_confidence(0.04) | benign(0.003) | TCGA-AC-A23H-01 | Breast | breast invasive carcinoma | Female | >=65 | I/II | Unknown | Unknown | PD | |
| LNPK | SNV | Missense_Mutation | c.99A>T | p.Glu33Asp | p.E33D | Q9C0E8 | protein_coding | tolerated(0.18) | benign(0.012) | TCGA-AN-A0FT-01 | Breast | breast invasive carcinoma | Female | <65 | I/II | Unknown | Unknown | SD | |
| LNPK | SNV | Missense_Mutation | c.551N>T | p.Asn184Ile | p.N184I | Q9C0E8 | protein_coding | tolerated(0.16) | benign(0.081) | TCGA-B6-A1KN-01 | Breast | breast invasive carcinoma | Female | <65 | III/IV | Unknown | Unknown | SD | |
| LNPK | SNV | Missense_Mutation | c.977C>G | p.Ala326Gly | p.A326G | Q9C0E8 | protein_coding | deleterious(0.01) | possibly_damaging(0.573) | TCGA-EW-A1PH-01 | Breast | breast invasive carcinoma | Female | <65 | I/II | Chemotherapy | cyclophosphamide | SD | |
| LNPK | SNV | Missense_Mutation | c.1275N>T | p.Glu425Asp | p.E425D | Q9C0E8 | protein_coding | tolerated(0.41) | benign(0.027) | TCGA-FU-A3HZ-01 | Cervix | cervical & endocervical cancer | Female | <65 | I/II | Chemotherapy | cisplatin | CR | |
| LNPK | SNV | Missense_Mutation | novel | c.322N>A | p.Ala108Thr | p.A108T | Q9C0E8 | protein_coding | tolerated(0.19) | benign(0.251) | TCGA-AA-3930-01 | Colorectum | colon adenocarcinoma | Male | >=65 | III/IV | Chemotherapy | capecitabine | PD |
| LNPK | SNV | Missense_Mutation | novel | c.1174N>T | p.Asp392Tyr | p.D392Y | Q9C0E8 | protein_coding | deleterious(0.02) | benign(0.009) | TCGA-AA-A010-01 | Colorectum | colon adenocarcinoma | Female | <65 | I/II | Chemotherapy | folinic | CR |
| LNPK | SNV | Missense_Mutation | c.353N>C | p.Lys118Thr | p.K118T | Q9C0E8 | protein_coding | deleterious(0) | probably_damaging(0.971) | TCGA-AA-A010-01 | Colorectum | colon adenocarcinoma | Female | <65 | I/II | Chemotherapy | folinic | CR | |
| LNPK | SNV | Missense_Mutation | c.98N>G | p.Glu33Gly | p.E33G | Q9C0E8 | protein_coding | tolerated(0.1) | benign(0.283) | TCGA-AZ-6598-01 | Colorectum | colon adenocarcinoma | Female | >=65 | I/II | Unknown | Unknown | SD |
| Page: 1 2 3 4 5 |
Top |
Related drugs of malignant transformation related genes |
| Identification of chemicals and drugs interact with genes involved in malignant transfromation |
| (DGIdb 4.0) |
| Entrez ID | Symbol | Category | Interaction Types | Drug Claim Name | Drug Name | PMIDs |
| Page: 1 |

Copyright 2023-Present -The University of Texas Health Science Center at Houston |