
|
|||||
|
 | |
| |
| |
| |
| |
| |
|
Gene: LNPEP |
Gene summary for LNPEP |
| Gene information | Species | Human | Gene symbol | LNPEP | Gene ID | 4012 |
| Gene name | leucyl and cystinyl aminopeptidase | |
| Gene Alias | CAP | |
| Cytomap | 5q15 | |
| Gene Type | protein-coding | GO ID | GO:0000003 | UniProtAcc | Q9UIQ6 |
Top |
Malignant transformation analysis |
| Identification of the aberrant gene expression in precancerous and cancerous lesions by comparing the gene expression of stem-like cells in diseased tissues with normal stem cells |
| Entrez ID | Symbol | Replicates | Species | Organ | Tissue | Adj P-value | Log2FC | Malignancy |
| 4012 | LNPEP | LZE2T | Human | Esophagus | ESCC | 1.01e-03 | 2.99e-01 | 0.082 |
| 4012 | LNPEP | LZE4T | Human | Esophagus | ESCC | 1.45e-09 | 2.90e-01 | 0.0811 |
| 4012 | LNPEP | LZE7T | Human | Esophagus | ESCC | 6.42e-05 | 4.34e-01 | 0.0667 |
| 4012 | LNPEP | LZE8T | Human | Esophagus | ESCC | 3.09e-04 | 1.49e-01 | 0.067 |
| 4012 | LNPEP | LZE20T | Human | Esophagus | ESCC | 1.78e-02 | 1.24e-01 | 0.0662 |
| 4012 | LNPEP | LZE22D1 | Human | Esophagus | HGIN | 3.50e-02 | 1.03e-01 | 0.0595 |
| 4012 | LNPEP | LZE24T | Human | Esophagus | ESCC | 8.02e-12 | 2.75e-01 | 0.0596 |
| 4012 | LNPEP | LZE6T | Human | Esophagus | ESCC | 3.91e-05 | 2.53e-01 | 0.0845 |
| 4012 | LNPEP | P1T-E | Human | Esophagus | ESCC | 1.63e-09 | 4.09e-01 | 0.0875 |
| 4012 | LNPEP | P2T-E | Human | Esophagus | ESCC | 4.39e-14 | 2.36e-01 | 0.1177 |
| 4012 | LNPEP | P4T-E | Human | Esophagus | ESCC | 3.03e-12 | 1.32e-01 | 0.1323 |
| 4012 | LNPEP | P5T-E | Human | Esophagus | ESCC | 1.37e-03 | -1.24e-02 | 0.1327 |
| 4012 | LNPEP | P8T-E | Human | Esophagus | ESCC | 5.15e-16 | 2.68e-01 | 0.0889 |
| 4012 | LNPEP | P9T-E | Human | Esophagus | ESCC | 3.40e-10 | 1.43e-01 | 0.1131 |
| 4012 | LNPEP | P10T-E | Human | Esophagus | ESCC | 4.28e-18 | 2.88e-01 | 0.116 |
| 4012 | LNPEP | P11T-E | Human | Esophagus | ESCC | 4.94e-14 | 3.62e-01 | 0.1426 |
| 4012 | LNPEP | P12T-E | Human | Esophagus | ESCC | 1.05e-15 | 2.58e-01 | 0.1122 |
| 4012 | LNPEP | P15T-E | Human | Esophagus | ESCC | 2.33e-13 | 3.32e-01 | 0.1149 |
| 4012 | LNPEP | P16T-E | Human | Esophagus | ESCC | 6.37e-08 | -5.32e-03 | 0.1153 |
| 4012 | LNPEP | P17T-E | Human | Esophagus | ESCC | 8.20e-03 | 1.98e-01 | 0.1278 |
| Page: 1 2 3 4 5 6 7 |
| Tissue | Expression Dynamics | Abbreviation |
| Esophagus | 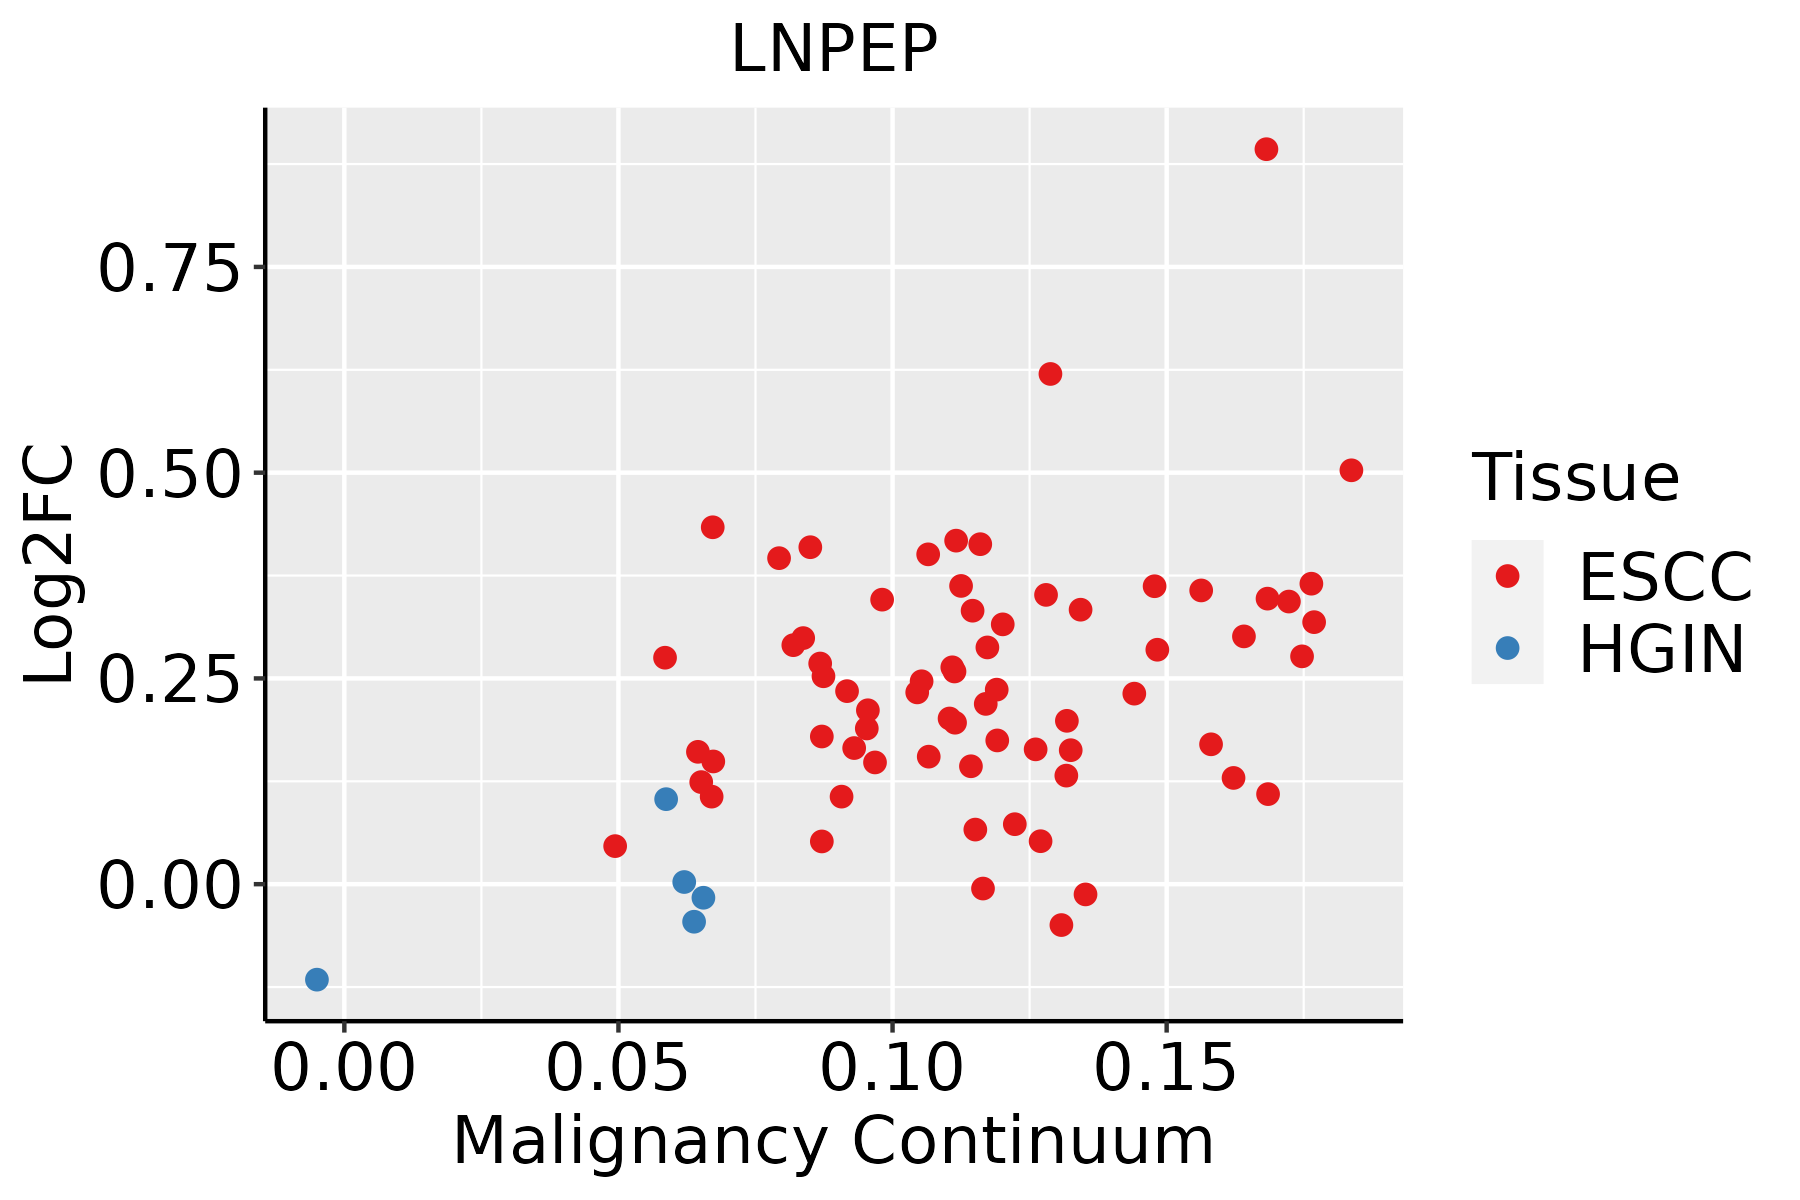 | ESCC: Esophageal squamous cell carcinoma |
| HGIN: High-grade intraepithelial neoplasias | ||
| LGIN: Low-grade intraepithelial neoplasias | ||
| Liver |  | HCC: Hepatocellular carcinoma |
| NAFLD: Non-alcoholic fatty liver disease | ||
| Oral Cavity | 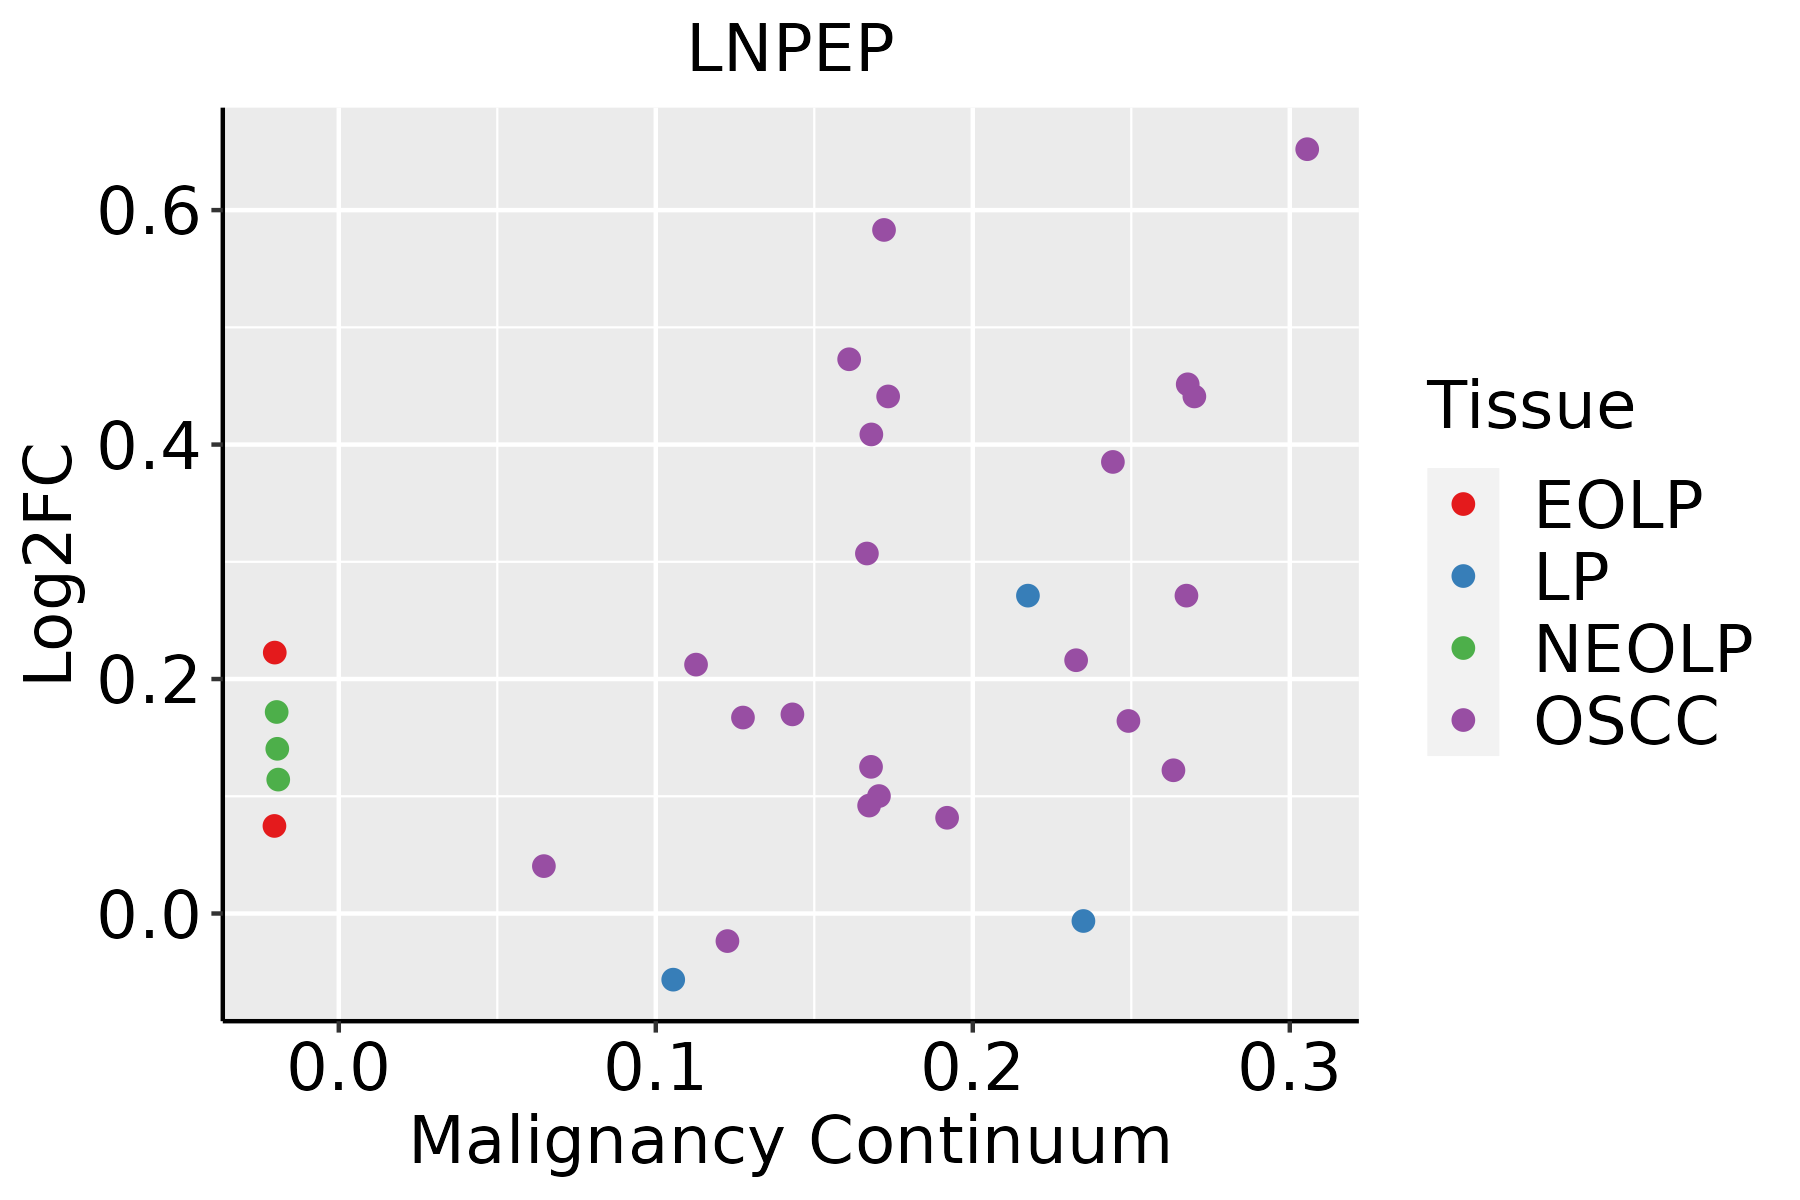 | EOLP: Erosive Oral lichen planus |
| LP: leukoplakia | ||
| NEOLP: Non-erosive oral lichen planus | ||
| OSCC: Oral squamous cell carcinoma | ||
| Prostate | 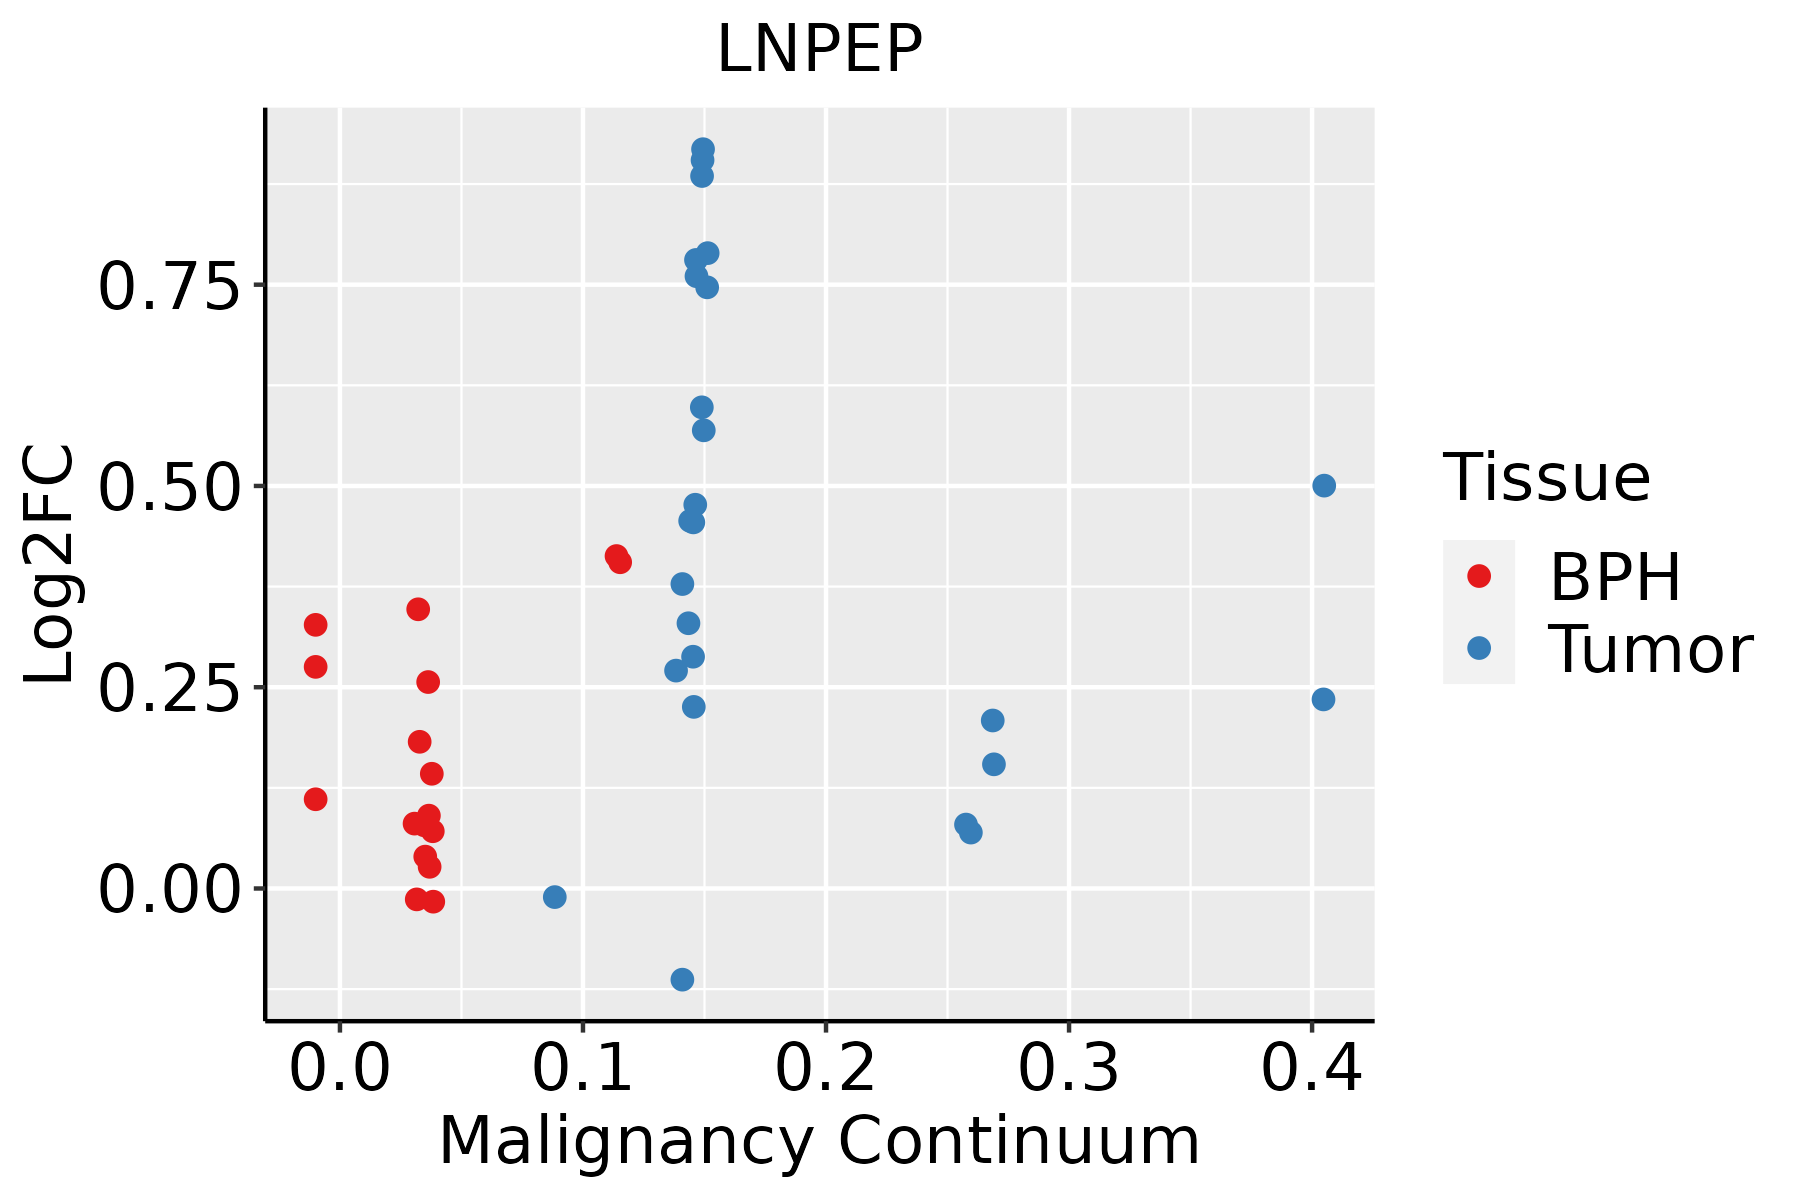 | BPH: Benign Prostatic Hyperplasia |
| Thyroid | 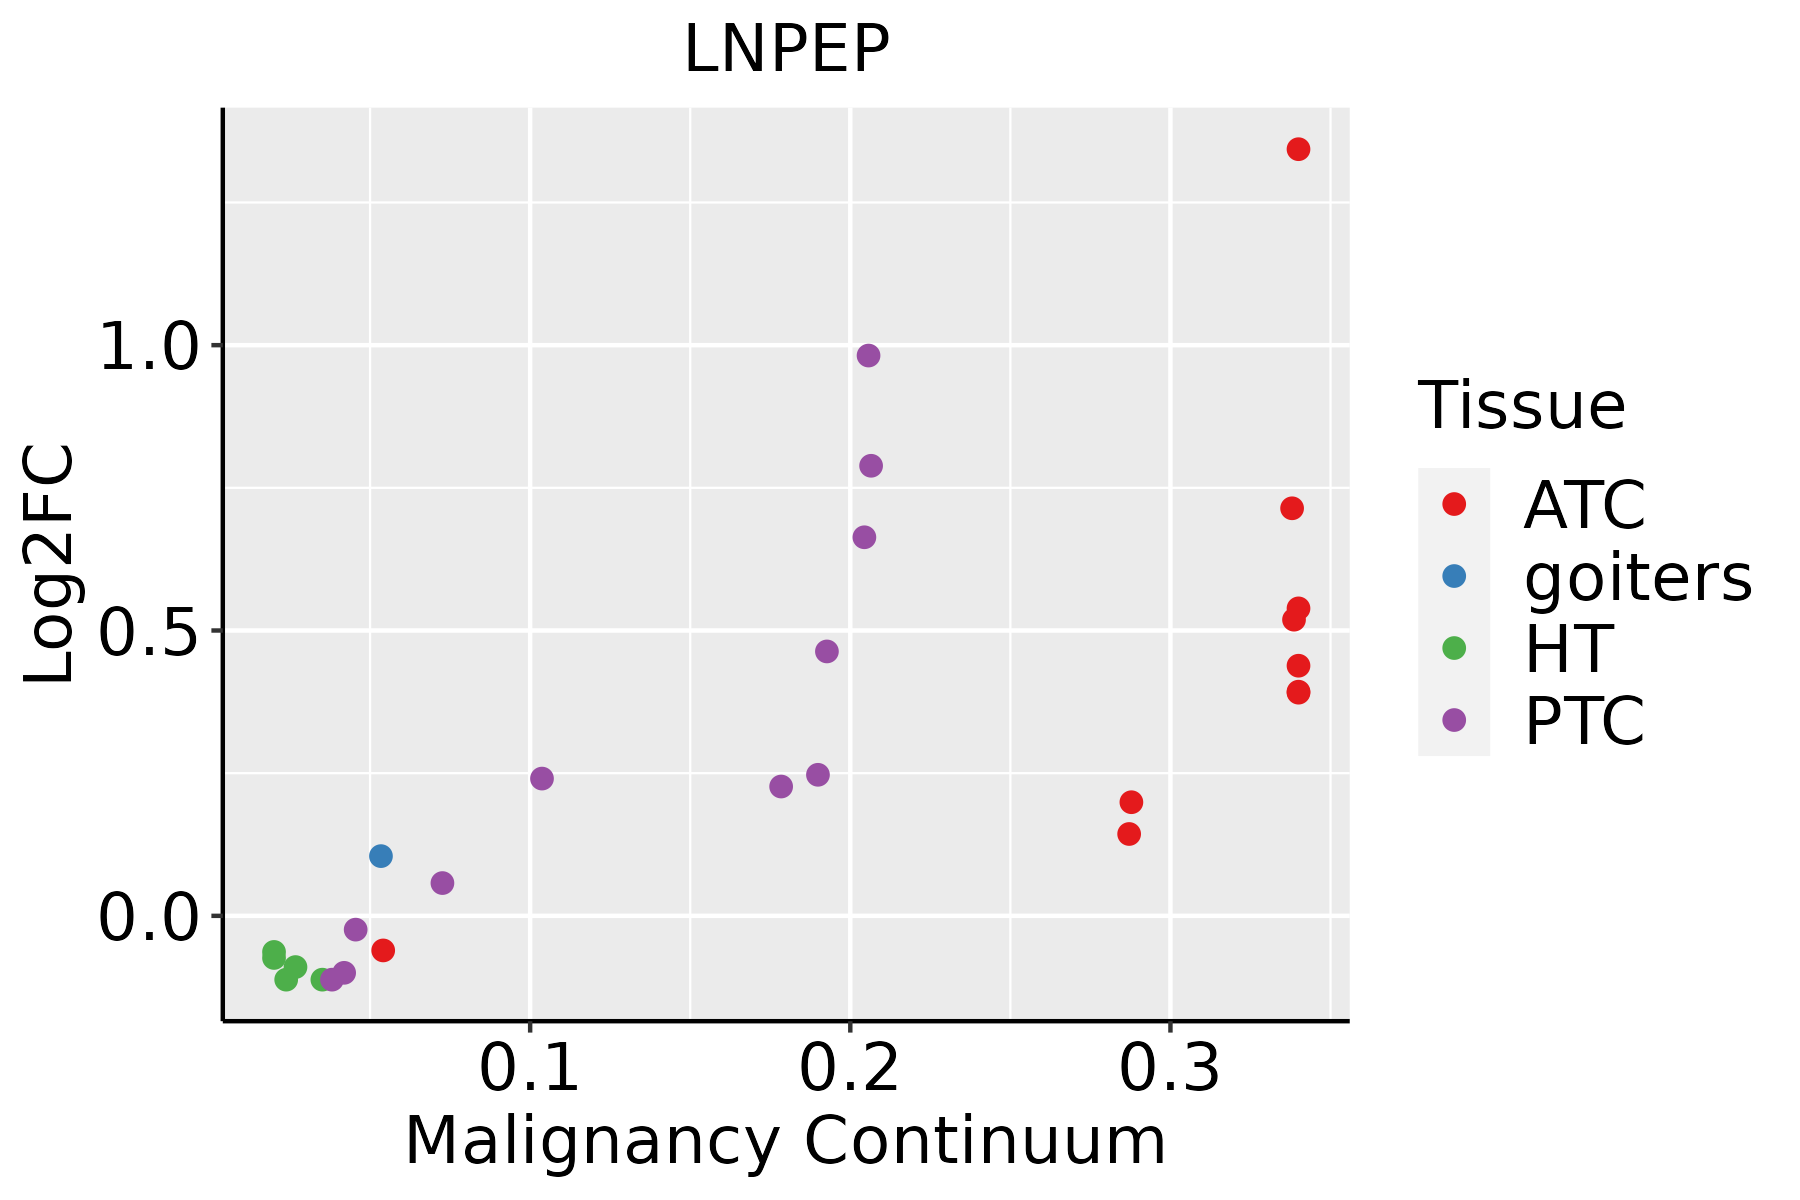 | ATC: Anaplastic thyroid cancer |
| HT: Hashimoto's thyroiditis | ||
| PTC: Papillary thyroid cancer |
| ∗log2FC in expression of this searched gene in stem-like cells from each diseased tissue sample relative to stem-like cells in normal samples in each tissue plotted against the malignancy continuum. Samples are colored based on if they are from different disease stage. |
Top |
Malignant transformation related pathway analysis |
| Find out the enriched GO biological processes and KEGG pathways involved in transition from healthy to precancer to cancer |
| Tissue | Disease Stage | Enriched GO biological Processes |
| Colorectum | AD |  |
| Colorectum | SER |  |
| Colorectum | MSS |  |
| Colorectum | MSI-H |  |
| Colorectum | FAP |  |
| ∗Top 15 enriched GO BP terms are showed in the bar plot of each disease state in each tissue. Each row represents a significant GO biological process which is colored according to the -log10(p.adjust). |
| Page: 1 2 3 4 5 6 7 8 9 |
| GO ID | Tissue | Disease Stage | Description | Gene Ratio | Bg Ratio | pvalue | p.adjust | Count |
| GO:000020916 | Esophagus | HGIN | protein polyubiquitination | 58/2587 | 236/18723 | 6.29e-06 | 1.97e-04 | 58 |
| GO:000020917 | Esophagus | ESCC | protein polyubiquitination | 170/8552 | 236/18723 | 1.40e-16 | 1.09e-14 | 170 |
| GO:004800220 | Esophagus | ESCC | antigen processing and presentation of peptide antigen | 44/8552 | 62/18723 | 4.81e-05 | 3.78e-04 | 44 |
| GO:000247820 | Esophagus | ESCC | antigen processing and presentation of exogenous peptide antigen | 29/8552 | 38/18723 | 1.18e-04 | 8.13e-04 | 29 |
| GO:001988225 | Esophagus | ESCC | antigen processing and presentation | 67/8552 | 106/18723 | 2.03e-04 | 1.28e-03 | 67 |
| GO:000247418 | Esophagus | ESCC | antigen processing and presentation of peptide antigen via MHC class I | 22/8552 | 28/18723 | 3.95e-04 | 2.26e-03 | 22 |
| GO:001988420 | Esophagus | ESCC | antigen processing and presentation of exogenous antigen | 33/8552 | 47/18723 | 5.77e-04 | 3.14e-03 | 33 |
| GO:01061066 | Esophagus | ESCC | cold-induced thermogenesis | 80/8552 | 144/18723 | 1.07e-02 | 3.65e-02 | 80 |
| GO:01201616 | Esophagus | ESCC | regulation of cold-induced thermogenesis | 80/8552 | 144/18723 | 1.07e-02 | 3.65e-02 | 80 |
| GO:000020911 | Liver | Cirrhotic | protein polyubiquitination | 89/4634 | 236/18723 | 6.09e-06 | 9.80e-05 | 89 |
| GO:00024787 | Liver | Cirrhotic | antigen processing and presentation of exogenous peptide antigen | 21/4634 | 38/18723 | 5.49e-05 | 6.31e-04 | 21 |
| GO:00198827 | Liver | Cirrhotic | antigen processing and presentation | 44/4634 | 106/18723 | 1.07e-04 | 1.10e-03 | 44 |
| GO:00480027 | Liver | Cirrhotic | antigen processing and presentation of peptide antigen | 29/4634 | 62/18723 | 1.34e-04 | 1.31e-03 | 29 |
| GO:00198847 | Liver | Cirrhotic | antigen processing and presentation of exogenous antigen | 23/4634 | 47/18723 | 2.84e-04 | 2.51e-03 | 23 |
| GO:00024747 | Liver | Cirrhotic | antigen processing and presentation of peptide antigen via MHC class I | 15/4634 | 28/18723 | 9.91e-04 | 6.98e-03 | 15 |
| GO:0007565 | Liver | Cirrhotic | female pregnancy | 65/4634 | 193/18723 | 3.21e-03 | 1.80e-02 | 65 |
| GO:0044706 | Liver | Cirrhotic | multi-multicellular organism process | 70/4634 | 220/18723 | 1.03e-02 | 4.61e-02 | 70 |
| GO:000020921 | Liver | HCC | protein polyubiquitination | 151/7958 | 236/18723 | 1.90e-11 | 7.59e-10 | 151 |
| GO:001988212 | Liver | HCC | antigen processing and presentation | 65/7958 | 106/18723 | 7.06e-05 | 6.37e-04 | 65 |
| GO:000247811 | Liver | HCC | antigen processing and presentation of exogenous peptide antigen | 27/7958 | 38/18723 | 3.47e-04 | 2.42e-03 | 27 |
| Page: 1 2 3 4 5 |
| Pathway ID | Tissue | Disease Stage | Description | Gene Ratio | Bg Ratio | pvalue | p.adjust | qvalue | Count |
| Page: 1 |
Top |
Cell-cell communication analysis |
| Identification of potential cell-cell interactions between two cell types and their ligand-receptor pairs for different disease states |
| Ligand | Receptor | LRpair | Pathway | Tissue | Disease Stage |
| Page: 1 |
Top |
Single-cell gene regulatory network inference analysis |
| Find out the significant the regulons (TFs) and the target genes of each regulon across cell types for different disease states |
| TF | Cell Type | Tissue | Disease Stage | Target Gene | RSS | Regulon Activity |
| ∗The dot plots of a searched regulon are shown for all cell subpopulations in each disease state of each tissue based on the regulon specific score inferred using pySCENIC and by calculating the average expression. |
| Page: 1 |
Top |
Somatic mutation of malignant transformation related genes |
| Annotation of somatic variants for genes involved in malignant transformation |
| Hugo Symbol | Variant Class | Variant Classification | dbSNP RS | HGVSc | HGVSp | HGVSp Short | SWISSPROT | BIOTYPE | SIFT | PolyPhen | Tumor Sample Barcode | Tissue | Histology | Sex | Age | Stage | Therapy Types | Drugs | Outcome |
| LNPEP | SNV | Missense_Mutation | c.1582N>T | p.His528Tyr | p.H528Y | Q9UIQ6 | protein_coding | deleterious(0) | probably_damaging(0.988) | TCGA-AC-A23H-01 | Breast | breast invasive carcinoma | Female | >=65 | I/II | Unknown | Unknown | PD | |
| LNPEP | SNV | Missense_Mutation | c.2992N>T | p.Arg998Cys | p.R998C | Q9UIQ6 | protein_coding | deleterious(0.01) | probably_damaging(0.982) | TCGA-AN-A046-01 | Breast | breast invasive carcinoma | Female | >=65 | I/II | Unknown | Unknown | SD | |
| LNPEP | insertion | Frame_Shift_Ins | novel | c.421_422insCTAGA | p.Cys141SerfsTer12 | p.C141Sfs*12 | Q9UIQ6 | protein_coding | TCGA-AR-A0U0-01 | Breast | breast invasive carcinoma | Female | >=65 | I/II | Unknown | Unknown | SD | ||
| LNPEP | SNV | Missense_Mutation | novel | c.578C>A | p.Ser193Tyr | p.S193Y | Q9UIQ6 | protein_coding | tolerated(0.28) | possibly_damaging(0.854) | TCGA-2W-A8YY-01 | Cervix | cervical & endocervical cancer | Female | <65 | I/II | Chemotherapy | cisplatin | CR |
| LNPEP | SNV | Missense_Mutation | c.1229T>C | p.Ile410Thr | p.I410T | Q9UIQ6 | protein_coding | deleterious(0) | probably_damaging(0.93) | TCGA-2W-A8YY-01 | Cervix | cervical & endocervical cancer | Female | <65 | I/II | Chemotherapy | cisplatin | CR | |
| LNPEP | SNV | Missense_Mutation | novel | c.2903N>T | p.Ala968Val | p.A968V | Q9UIQ6 | protein_coding | tolerated(0.47) | benign(0.03) | TCGA-ZJ-A8QO-01 | Cervix | cervical & endocervical cancer | Female | >=65 | I/II | Unknown | Unknown | SD |
| LNPEP | SNV | Missense_Mutation | c.2017T>G | p.Leu673Val | p.L673V | Q9UIQ6 | protein_coding | tolerated(0.06) | benign(0.08) | TCGA-AA-3492-01 | Colorectum | colon adenocarcinoma | Female | >=65 | I/II | Unknown | Unknown | SD | |
| LNPEP | SNV | Missense_Mutation | rs760096595 | c.730G>A | p.Ala244Thr | p.A244T | Q9UIQ6 | protein_coding | deleterious(0) | possibly_damaging(0.49) | TCGA-AA-3833-01 | Colorectum | colon adenocarcinoma | Female | <65 | I/II | Unknown | Unknown | SD |
| LNPEP | SNV | Missense_Mutation | c.617A>C | p.Asn206Thr | p.N206T | Q9UIQ6 | protein_coding | tolerated(0.41) | benign(0) | TCGA-AA-3966-01 | Colorectum | colon adenocarcinoma | Female | >=65 | I/II | Unknown | Unknown | SD | |
| LNPEP | SNV | Missense_Mutation | novel | c.2317N>A | p.Asp773Asn | p.D773N | Q9UIQ6 | protein_coding | tolerated(0.5) | benign(0.001) | TCGA-AA-3984-01 | Colorectum | colon adenocarcinoma | Female | <65 | I/II | Unknown | Unknown | SD |
| Page: 1 2 3 4 5 6 7 8 9 10 |
Top |
Related drugs of malignant transformation related genes |
| Identification of chemicals and drugs interact with genes involved in malignant transfromation |
| (DGIdb 4.0) |
| Entrez ID | Symbol | Category | Interaction Types | Drug Claim Name | Drug Name | PMIDs |
| 4012 | LNPEP | DRUGGABLE GENOME, NEUTRAL ZINC METALLOPEPTIDASE, ENZYME, TRANSPORTER, PROTEASE | US10059720, Example 82 | |||
| 4012 | LNPEP | DRUGGABLE GENOME, NEUTRAL ZINC METALLOPEPTIDASE, ENZYME, TRANSPORTER, PROTEASE | US10023583, Example 13 | |||
| 4012 | LNPEP | DRUGGABLE GENOME, NEUTRAL ZINC METALLOPEPTIDASE, ENZYME, TRANSPORTER, PROTEASE | US10059720, Example 84 | |||
| 4012 | LNPEP | DRUGGABLE GENOME, NEUTRAL ZINC METALLOPEPTIDASE, ENZYME, TRANSPORTER, PROTEASE | US10023583, Example 8 | |||
| 4012 | LNPEP | DRUGGABLE GENOME, NEUTRAL ZINC METALLOPEPTIDASE, ENZYME, TRANSPORTER, PROTEASE | US10059720, Example 80 | |||
| 4012 | LNPEP | DRUGGABLE GENOME, NEUTRAL ZINC METALLOPEPTIDASE, ENZYME, TRANSPORTER, PROTEASE | inhibitor | 252166866 | ||
| 4012 | LNPEP | DRUGGABLE GENOME, NEUTRAL ZINC METALLOPEPTIDASE, ENZYME, TRANSPORTER, PROTEASE | inhibitor | 252166822 | ||
| 4012 | LNPEP | DRUGGABLE GENOME, NEUTRAL ZINC METALLOPEPTIDASE, ENZYME, TRANSPORTER, PROTEASE | US10023583, Example 5 | |||
| 4012 | LNPEP | DRUGGABLE GENOME, NEUTRAL ZINC METALLOPEPTIDASE, ENZYME, TRANSPORTER, PROTEASE | US10023583, Example 24 | |||
| 4012 | LNPEP | DRUGGABLE GENOME, NEUTRAL ZINC METALLOPEPTIDASE, ENZYME, TRANSPORTER, PROTEASE | inhibitor | CHEMBL2103847 | TOSEDOSTAT |
| Page: 1 |

Copyright 2023-Present -The University of Texas Health Science Center at Houston |