| Tissue | Expression Dynamics | Abbreviation |
| Cervix | 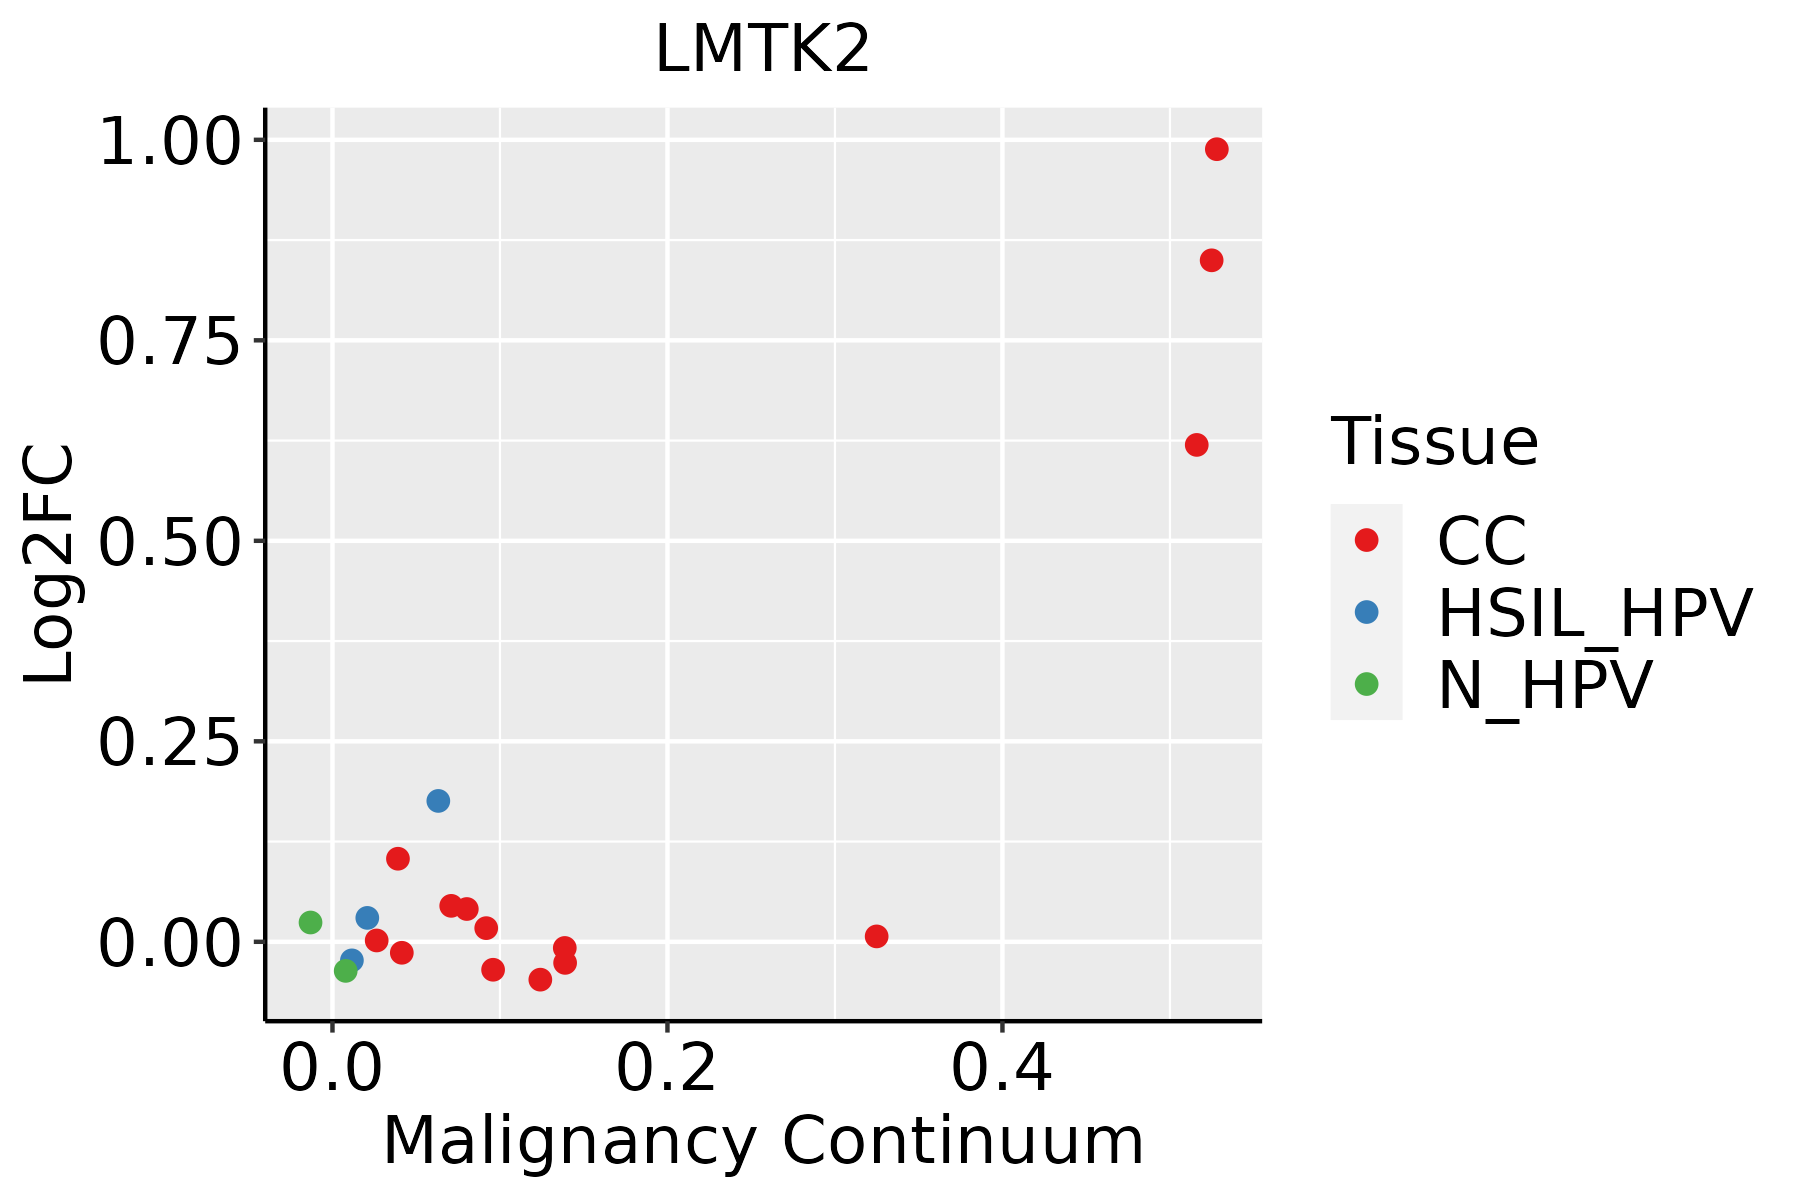 | CC: Cervix cancer |
| HSIL_HPV: HPV-infected high-grade squamous intraepithelial lesions |
| N_HPV: HPV-infected normal cervix |
| Colorectum (GSE201348) | 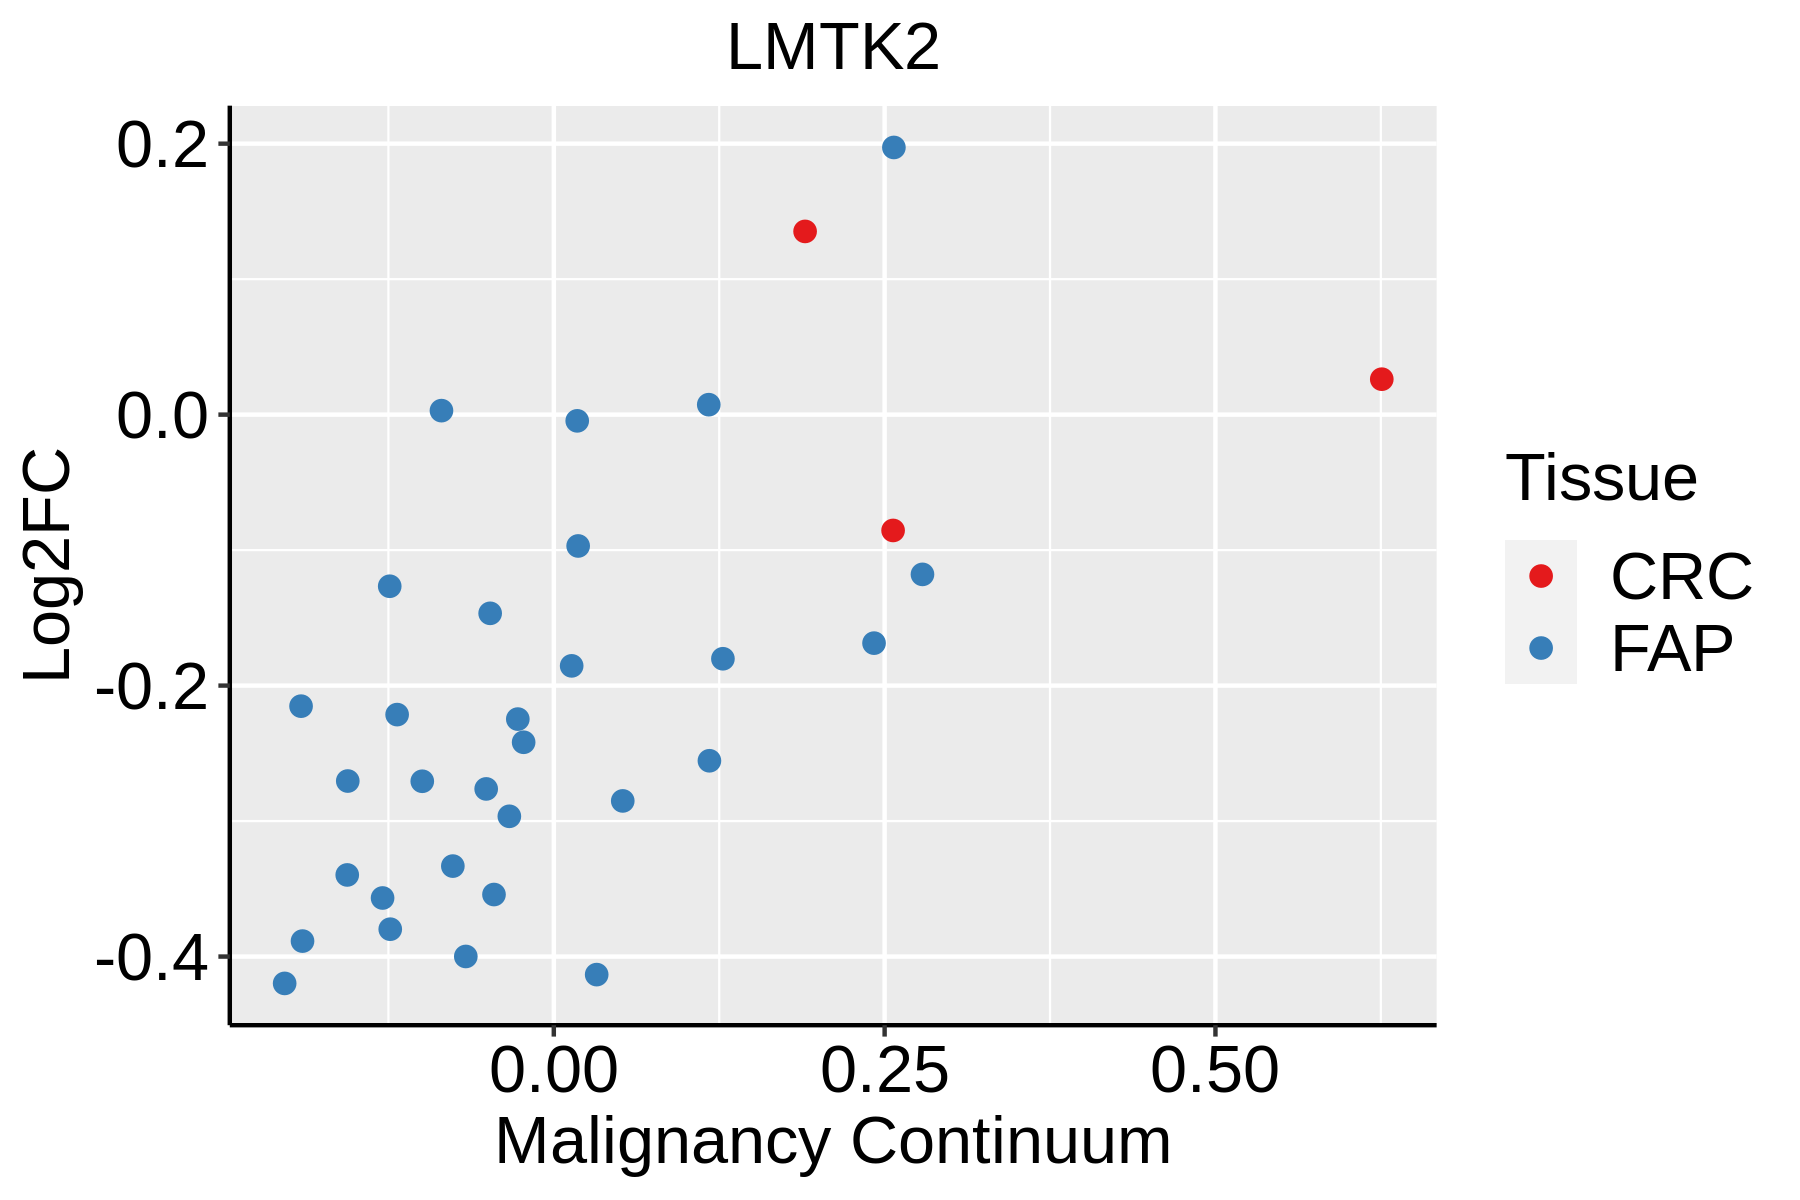 | FAP: Familial adenomatous polyposis |
| CRC: Colorectal cancer |
| Colorectum (HTA11) |  | AD: Adenomas |
| SER: Sessile serrated lesions |
| MSI-H: Microsatellite-high colorectal cancer |
| MSS: Microsatellite stable colorectal cancer |
| Esophagus | 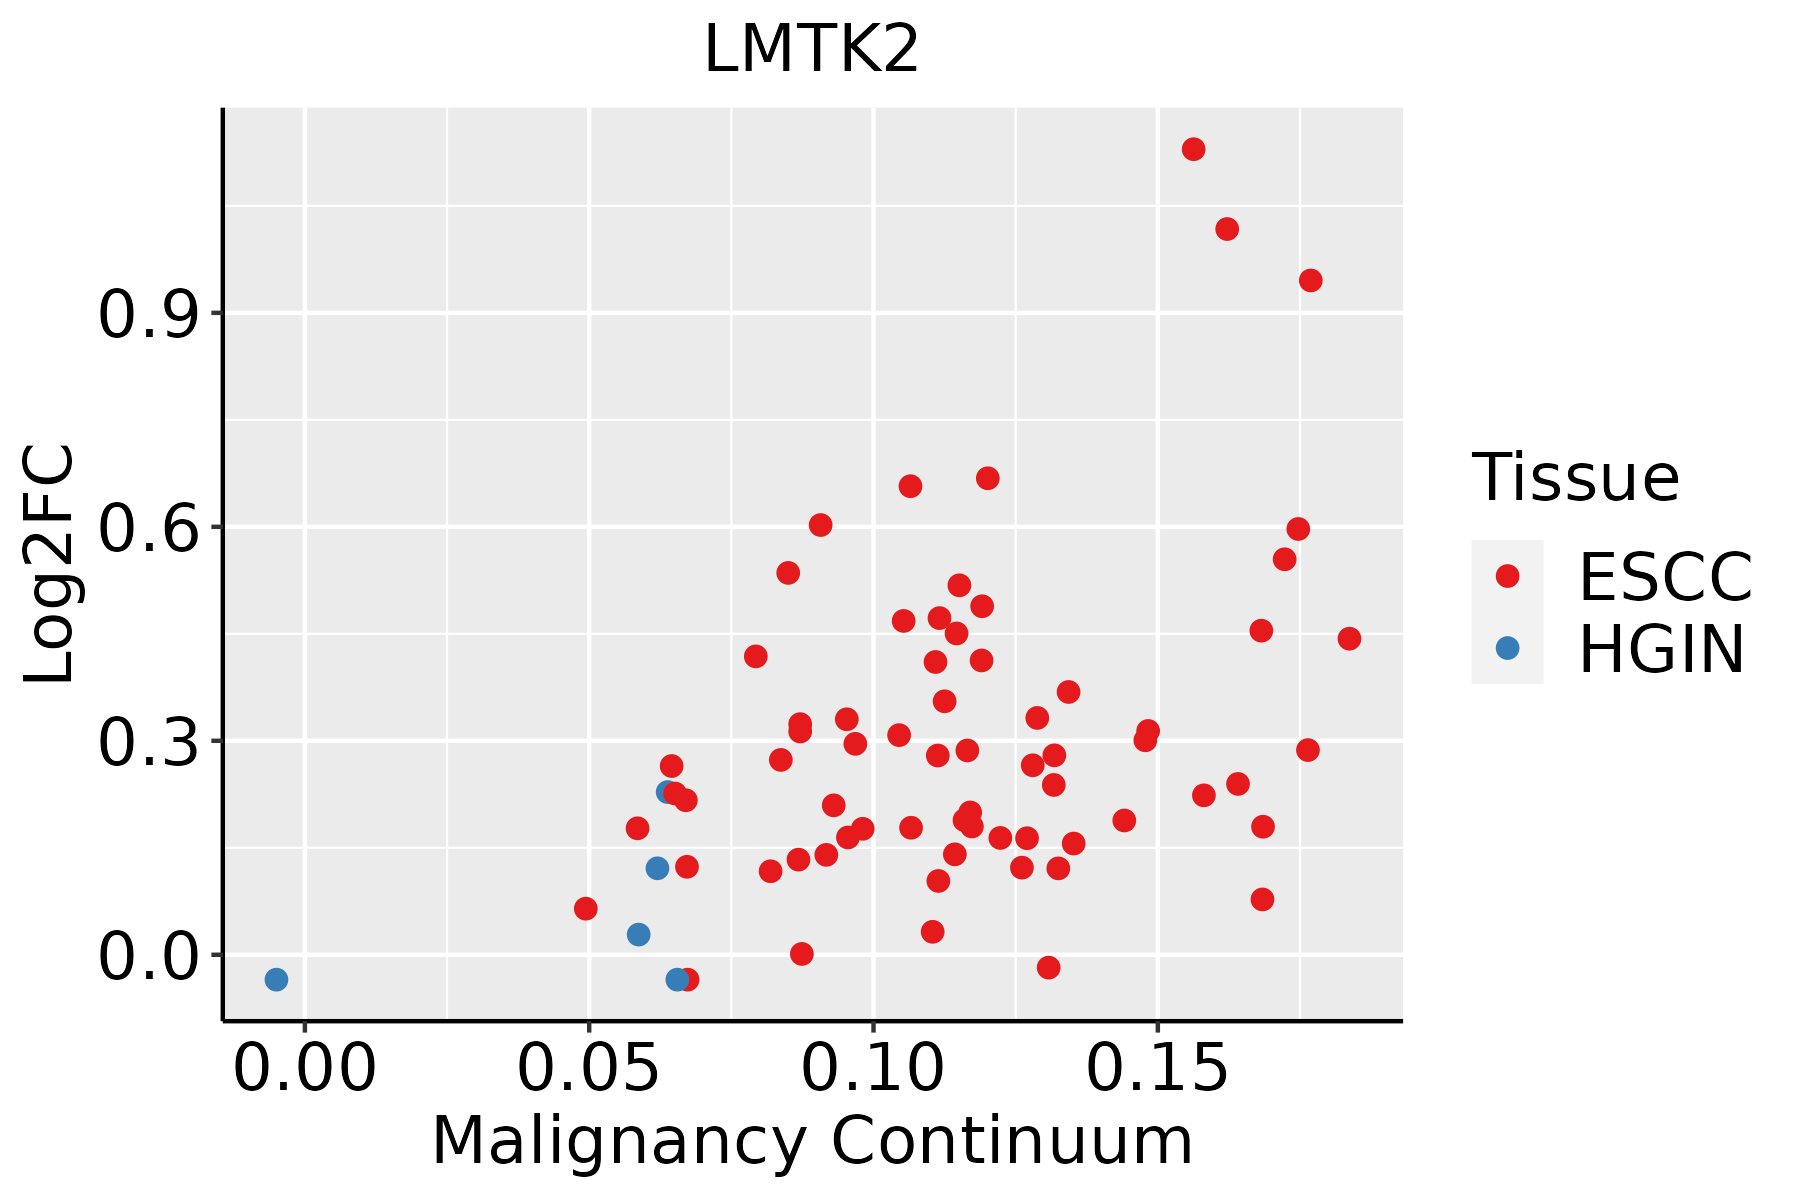 | ESCC: Esophageal squamous cell carcinoma |
| HGIN: High-grade intraepithelial neoplasias |
| LGIN: Low-grade intraepithelial neoplasias |
| GC | 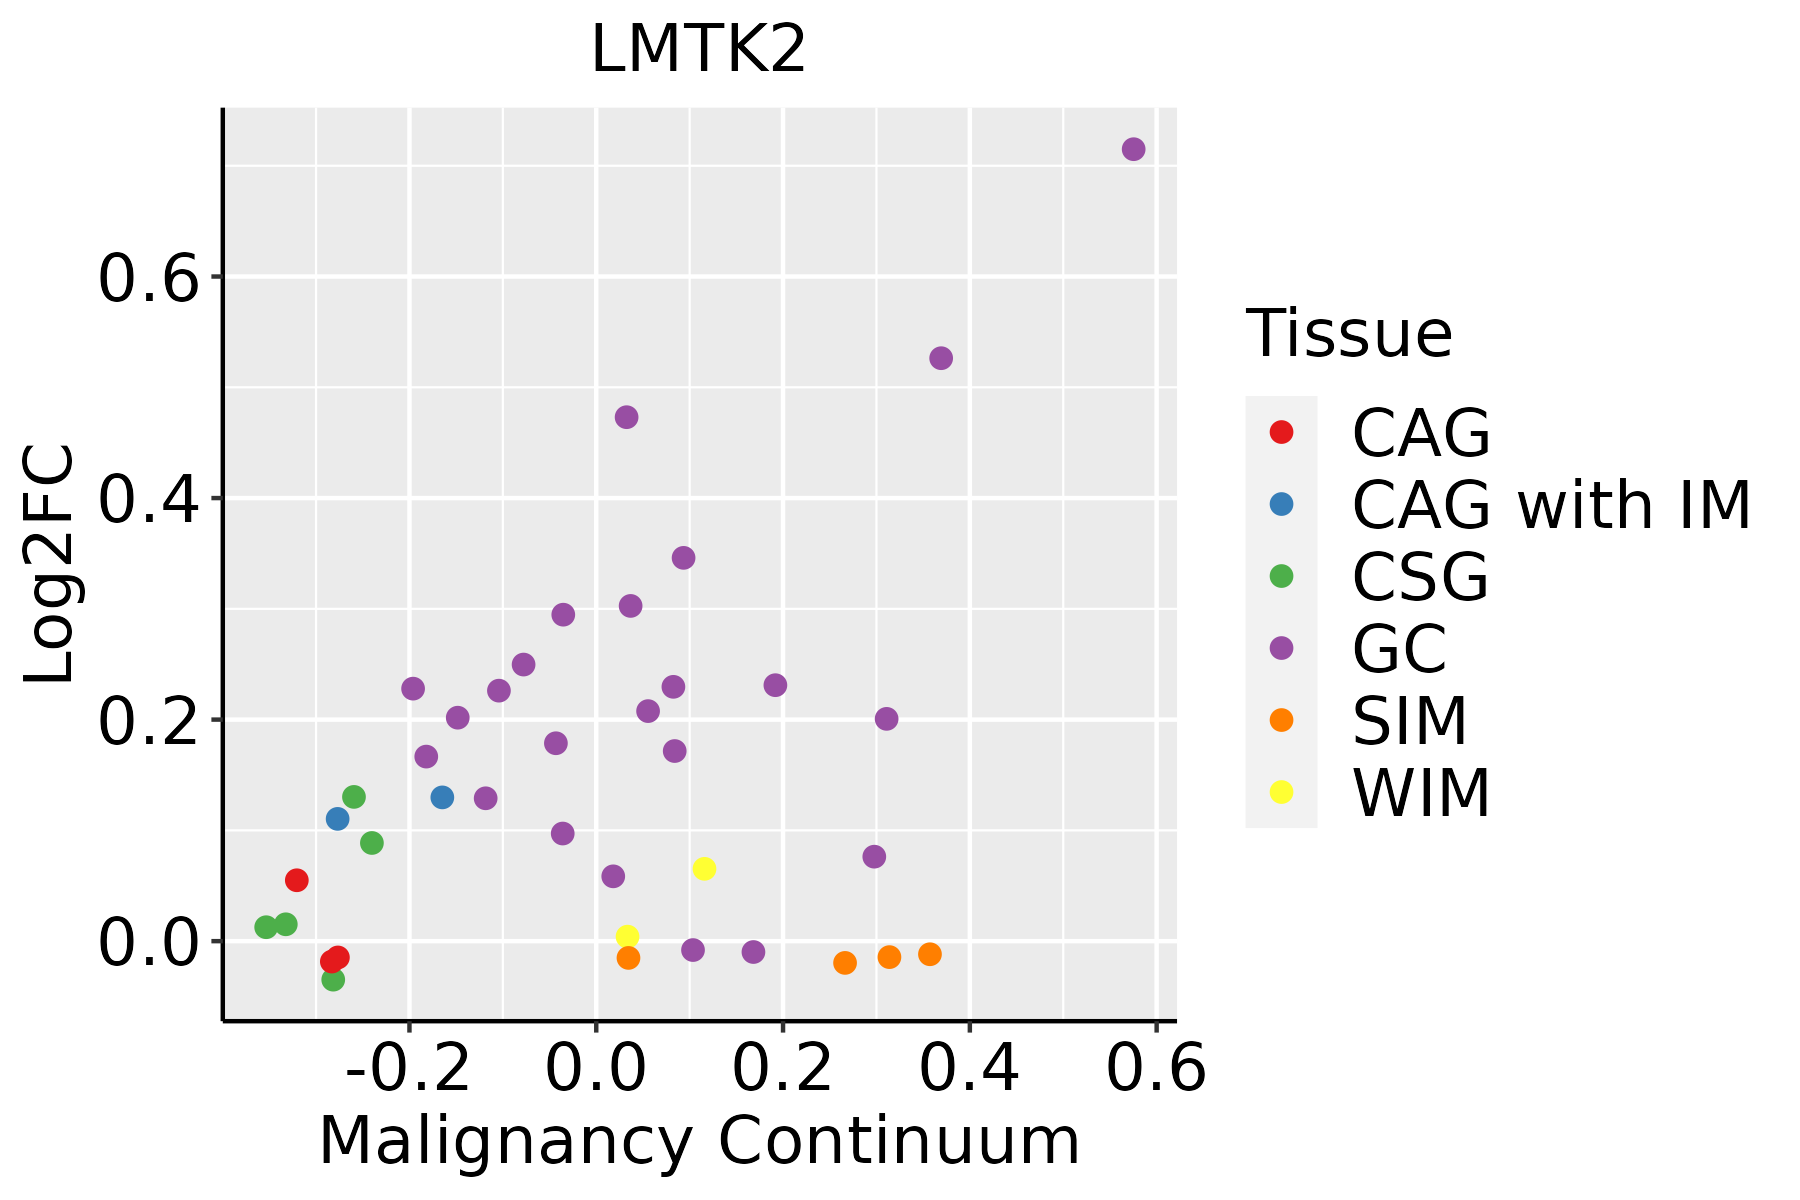 | CAG: Chronic atrophic gastritis |
| CAG with IM: Chronic atrophic gastritis with intestinal metaplasia |
| CSG: Chronic superficial gastritis |
| GC: Gastric cancer |
| SIM: Severe intestinal metaplasia |
| WIM: Wild intestinal metaplasia |
| Liver | 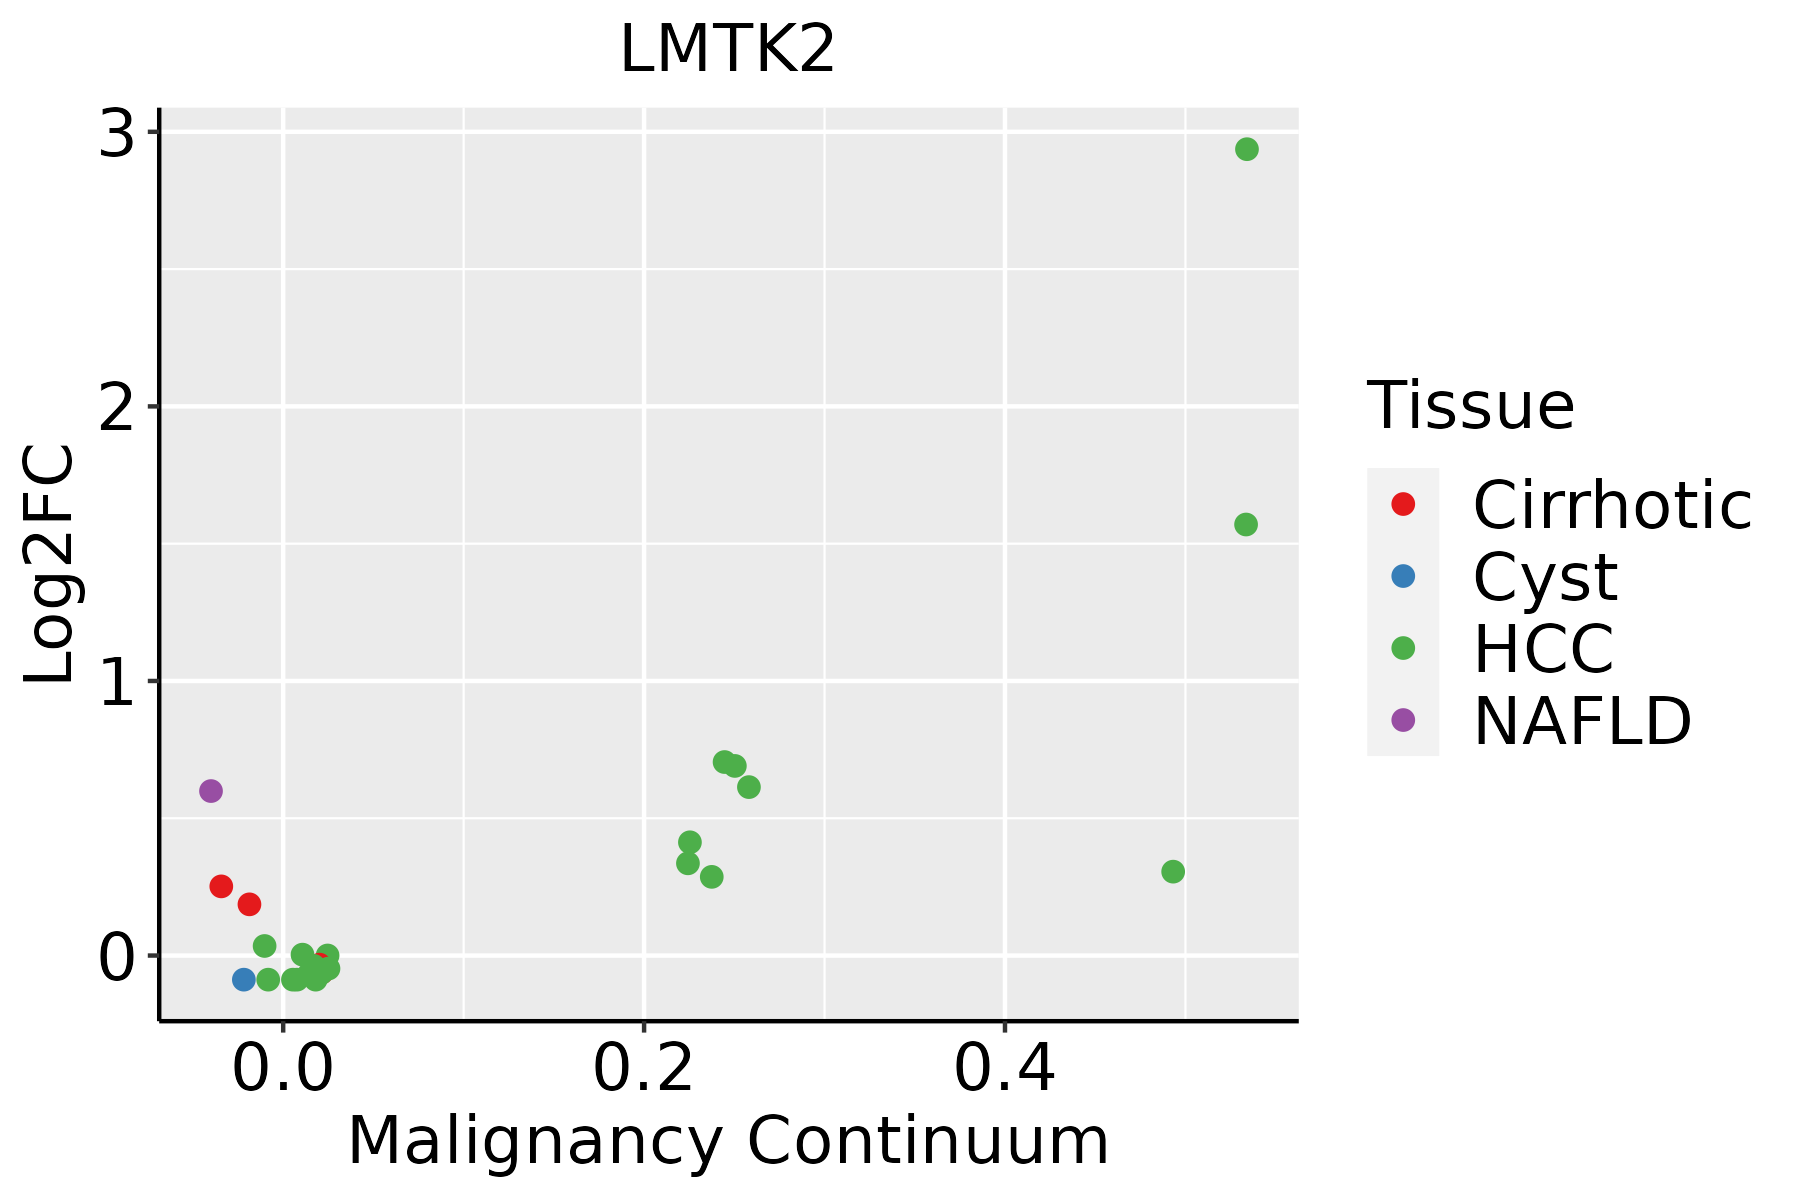 | HCC: Hepatocellular carcinoma |
| NAFLD: Non-alcoholic fatty liver disease |
| Lung | 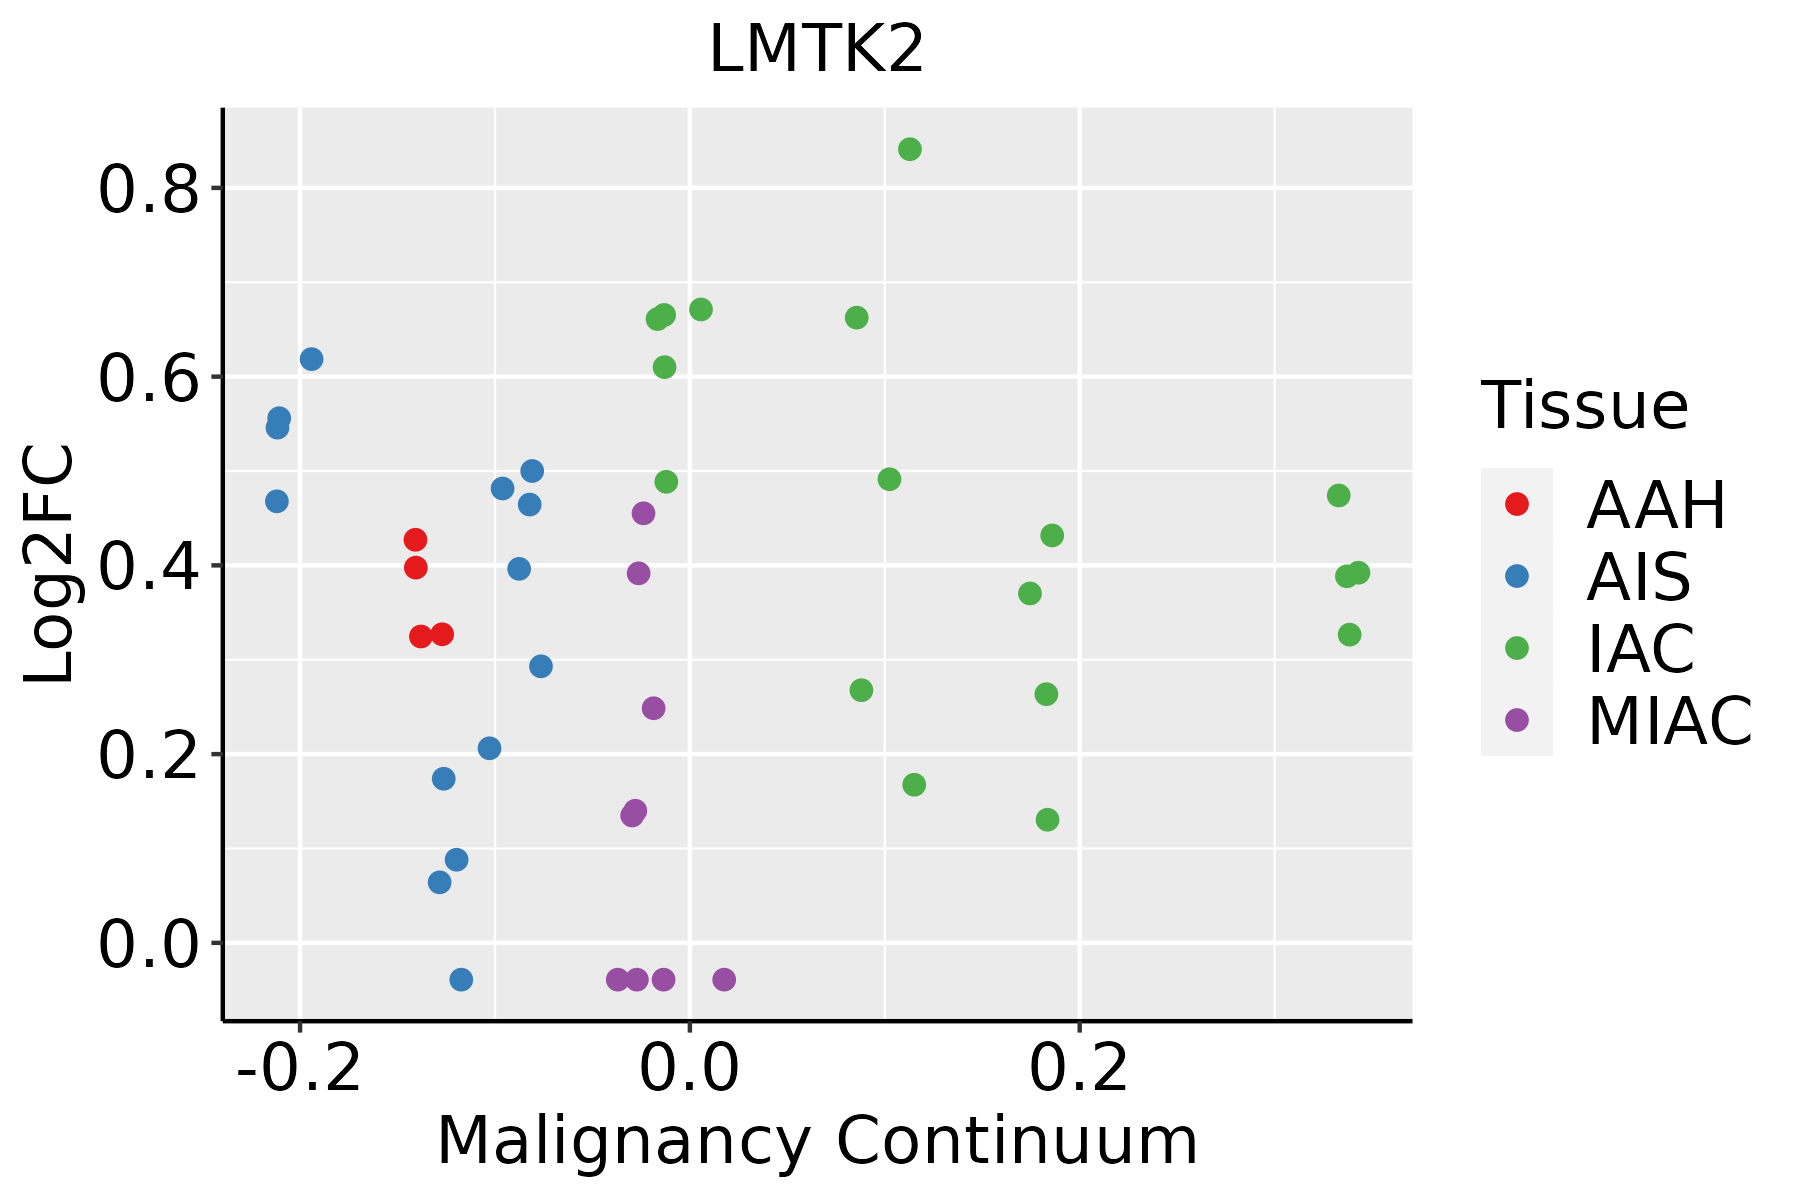 | AAH: Atypical adenomatous hyperplasia |
| AIS: Adenocarcinoma in situ |
| IAC: Invasive lung adenocarcinoma |
| MIA: Minimally invasive adenocarcinoma |
| GO ID | Tissue | Disease Stage | Description | Gene Ratio | Bg Ratio | pvalue | p.adjust | Count |
| GO:003367410 | Cervix | CC | positive regulation of kinase activity | 101/2311 | 467/18723 | 8.66e-09 | 7.22e-07 | 101 |
| GO:00615647 | Cervix | CC | axon development | 89/2311 | 467/18723 | 1.71e-05 | 3.27e-04 | 89 |
| GO:00988767 | Cervix | CC | vesicle-mediated transport to the plasma membrane | 34/2311 | 136/18723 | 3.75e-05 | 5.91e-04 | 34 |
| GO:00181057 | Cervix | CC | peptidyl-serine phosphorylation | 63/2311 | 315/18723 | 6.65e-05 | 9.47e-04 | 63 |
| GO:00182096 | Cervix | CC | peptidyl-serine modification | 66/2311 | 338/18723 | 9.58e-05 | 1.25e-03 | 66 |
| GO:00074097 | Cervix | CC | axonogenesis | 78/2311 | 418/18723 | 1.14e-04 | 1.43e-03 | 78 |
| GO:00161977 | Cervix | CC | endosomal transport | 48/2311 | 230/18723 | 1.65e-04 | 1.97e-03 | 48 |
| GO:00431127 | Cervix | CC | receptor metabolic process | 37/2311 | 166/18723 | 2.31e-04 | 2.58e-03 | 37 |
| GO:00181076 | Cervix | CC | peptidyl-threonine phosphorylation | 25/2311 | 116/18723 | 3.59e-03 | 2.30e-02 | 25 |
| GO:00164827 | Cervix | CC | cytosolic transport | 33/2311 | 168/18723 | 4.43e-03 | 2.70e-02 | 33 |
| GO:00182106 | Cervix | CC | peptidyl-threonine modification | 26/2311 | 125/18723 | 4.98e-03 | 2.97e-02 | 26 |
| GO:0016197 | Colorectum | AD | endosomal transport | 90/3918 | 230/18723 | 1.88e-10 | 1.73e-08 | 90 |
| GO:0016482 | Colorectum | AD | cytosolic transport | 68/3918 | 168/18723 | 6.00e-09 | 3.72e-07 | 68 |
| GO:0098876 | Colorectum | AD | vesicle-mediated transport to the plasma membrane | 57/3918 | 136/18723 | 2.30e-08 | 1.27e-06 | 57 |
| GO:0043112 | Colorectum | AD | receptor metabolic process | 62/3918 | 166/18723 | 8.18e-07 | 2.85e-05 | 62 |
| GO:0001881 | Colorectum | AD | receptor recycling | 18/3918 | 33/18723 | 2.23e-05 | 4.40e-04 | 18 |
| GO:0046777 | Colorectum | AD | protein autophosphorylation | 74/3918 | 227/18723 | 2.48e-05 | 4.76e-04 | 74 |
| GO:0007409 | Colorectum | AD | axonogenesis | 122/3918 | 418/18723 | 3.36e-05 | 6.15e-04 | 122 |
| GO:0061564 | Colorectum | AD | axon development | 132/3918 | 467/18723 | 8.40e-05 | 1.31e-03 | 132 |
| GO:0033674 | Colorectum | AD | positive regulation of kinase activity | 131/3918 | 467/18723 | 1.28e-04 | 1.85e-03 | 131 |
| Hugo Symbol | Variant Class | Variant Classification | dbSNP RS | HGVSc | HGVSp | HGVSp Short | SWISSPROT | BIOTYPE | SIFT | PolyPhen | Tumor Sample Barcode | Tissue | Histology | Sex | Age | Stage | Therapy Types | Drugs | Outcome |
| LMTK2 | SNV | Missense_Mutation | novel | c.4252G>C | p.Glu1418Gln | p.E1418Q | Q8IWU2 | protein_coding | deleterious(0) | probably_damaging(0.996) | TCGA-A7-A56D-01 | Breast | breast invasive carcinoma | Female | >=65 | I/II | Hormone Therapy | arimidex | SD |
| LMTK2 | SNV | Missense_Mutation | | c.2470N>A | p.Glu824Lys | p.E824K | Q8IWU2 | protein_coding | tolerated(0.68) | benign(0.054) | TCGA-AC-A23H-01 | Breast | breast invasive carcinoma | Female | >=65 | I/II | Unknown | Unknown | PD |
| LMTK2 | SNV | Missense_Mutation | novel | c.4383N>G | p.Ser1461Arg | p.S1461R | Q8IWU2 | protein_coding | deleterious(0.01) | probably_damaging(0.946) | TCGA-AC-A2QH-01 | Breast | breast invasive carcinoma | Female | <65 | I/II | Chemotherapy | cytoxan | CR |
| LMTK2 | SNV | Missense_Mutation | | c.3512N>G | p.Ser1171Cys | p.S1171C | Q8IWU2 | protein_coding | deleterious(0.03) | benign(0.005) | TCGA-D8-A147-01 | Breast | breast invasive carcinoma | Female | <65 | I/II | Chemotherapy | doxorubicine | SD |
| LMTK2 | SNV | Missense_Mutation | | c.4421N>G | p.Ser1474Cys | p.S1474C | Q8IWU2 | protein_coding | deleterious(0) | probably_damaging(0.936) | TCGA-D8-A1JA-01 | Breast | breast invasive carcinoma | Female | <65 | III/IV | Chemotherapy | adriamycin | PD |
| LMTK2 | SNV | Missense_Mutation | novel | c.1370G>A | p.Arg457His | p.R457H | Q8IWU2 | protein_coding | tolerated(0.33) | benign(0.019) | TCGA-D8-A73W-01 | Breast | breast invasive carcinoma | Female | >=65 | III/IV | Hormone Therapy | tamoxiphen | PD |
| LMTK2 | deletion | Frame_Shift_Del | novel | c.1566_1593delNNNNNNNNNNNNNNNNNNNNNNNNNNNN | p.Asp523GlyfsTer24 | p.D523Gfs*24 | Q8IWU2 | protein_coding | | | TCGA-A1-A0SO-01 | Breast | breast invasive carcinoma | Female | >=65 | I/II | Chemotherapy | | SD |
| LMTK2 | insertion | Nonsense_Mutation | novel | c.1957_1958insGGCCAACATGGTGAAACCCCGTCTGT | p.Asp653GlyfsTer5 | p.D653Gfs*5 | Q8IWU2 | protein_coding | | | TCGA-A8-A07U-01 | Breast | breast invasive carcinoma | Female | >=65 | III/IV | Chemotherapy | 5-fluorouracil | SD |
| LMTK2 | insertion | In_Frame_Ins | novel | c.4397_4398insCTCAGAGGGCTGCTTCAT | p.Ala1466_Pro1467insSerGluGlyCysPheMet | p.A1466_P1467insSEGCFM | Q8IWU2 | protein_coding | | | TCGA-A8-A08H-01 | Breast | breast invasive carcinoma | Female | >=65 | I/II | Unknown | Unknown | SD |
| LMTK2 | insertion | In_Frame_Ins | novel | c.1581_1582insTACAACAACCACCTGCAAAACAACACA | p.Gln527_Asp528insTyrAsnAsnHisLeuGlnAsnAsnThr | p.Q527_D528insYNNHLQNNT | Q8IWU2 | protein_coding | | | TCGA-AN-A0FV-01 | Breast | breast invasive carcinoma | Female | <65 | I/II | Unknown | Unknown | SD |


