
|
|||||
|
 | |
| |
| |
| |
| |
| |
|
Gene: LMO7 |
Gene summary for LMO7 |
| Gene information | Species | Human | Gene symbol | LMO7 | Gene ID | 4008 |
| Gene name | LIM domain 7 | |
| Gene Alias | FBX20 | |
| Cytomap | 13q22.2 | |
| Gene Type | protein-coding | GO ID | GO:0006139 | UniProtAcc | F8J2B5 |
Top |
Malignant transformation analysis |
| Identification of the aberrant gene expression in precancerous and cancerous lesions by comparing the gene expression of stem-like cells in diseased tissues with normal stem cells |
| Entrez ID | Symbol | Replicates | Species | Organ | Tissue | Adj P-value | Log2FC | Malignancy |
| 4008 | LMO7 | H2 | Human | Cervix | HSIL_HPV | 9.75e-27 | 7.46e-01 | 0.0632 |
| 4008 | LMO7 | T1 | Human | Cervix | CC | 2.29e-03 | 3.19e-01 | 0.0918 |
| 4008 | LMO7 | T2 | Human | Cervix | CC | 2.71e-04 | 5.18e-01 | 0.0709 |
| 4008 | LMO7 | HTA11_3410_2000001011 | Human | Colorectum | AD | 4.66e-12 | -5.58e-01 | 0.0155 |
| 4008 | LMO7 | HTA11_411_2000001011 | Human | Colorectum | SER | 4.40e-03 | 1.50e+00 | -0.2602 |
| 4008 | LMO7 | HTA11_3361_2000001011 | Human | Colorectum | AD | 4.80e-02 | -5.00e-01 | -0.1207 |
| 4008 | LMO7 | HTA11_866_2000001011 | Human | Colorectum | AD | 2.49e-05 | -3.54e-01 | -0.1001 |
| 4008 | LMO7 | HTA11_866_3004761011 | Human | Colorectum | AD | 6.94e-04 | -4.47e-01 | 0.096 |
| 4008 | LMO7 | HTA11_7696_3000711011 | Human | Colorectum | AD | 1.68e-14 | -4.50e-01 | 0.0674 |
| 4008 | LMO7 | HTA11_99999970781_79442 | Human | Colorectum | MSS | 4.02e-07 | 7.18e-01 | 0.294 |
| 4008 | LMO7 | HTA11_99999965104_69814 | Human | Colorectum | MSS | 1.03e-06 | 6.48e-01 | 0.281 |
| 4008 | LMO7 | HTA11_99999974143_84620 | Human | Colorectum | MSS | 9.80e-12 | -3.55e-01 | 0.3005 |
| 4008 | LMO7 | A015-C-203 | Human | Colorectum | FAP | 8.28e-22 | -1.87e-01 | -0.1294 |
| 4008 | LMO7 | A002-C-201 | Human | Colorectum | FAP | 4.44e-06 | -1.90e-01 | 0.0324 |
| 4008 | LMO7 | A001-C-119 | Human | Colorectum | FAP | 2.65e-02 | 8.13e-02 | -0.1557 |
| 4008 | LMO7 | A001-C-108 | Human | Colorectum | FAP | 1.82e-10 | 1.20e-01 | -0.0272 |
| 4008 | LMO7 | A002-C-205 | Human | Colorectum | FAP | 2.70e-14 | 2.74e-02 | -0.1236 |
| 4008 | LMO7 | A001-C-104 | Human | Colorectum | FAP | 8.45e-03 | 2.10e-01 | 0.0184 |
| 4008 | LMO7 | A015-C-006 | Human | Colorectum | FAP | 1.65e-09 | -5.33e-02 | -0.0994 |
| 4008 | LMO7 | A015-C-106 | Human | Colorectum | FAP | 1.02e-06 | 2.49e-02 | -0.0511 |
| Page: 1 2 3 4 5 6 7 8 9 10 |
| Tissue | Expression Dynamics | Abbreviation |
| Cervix | 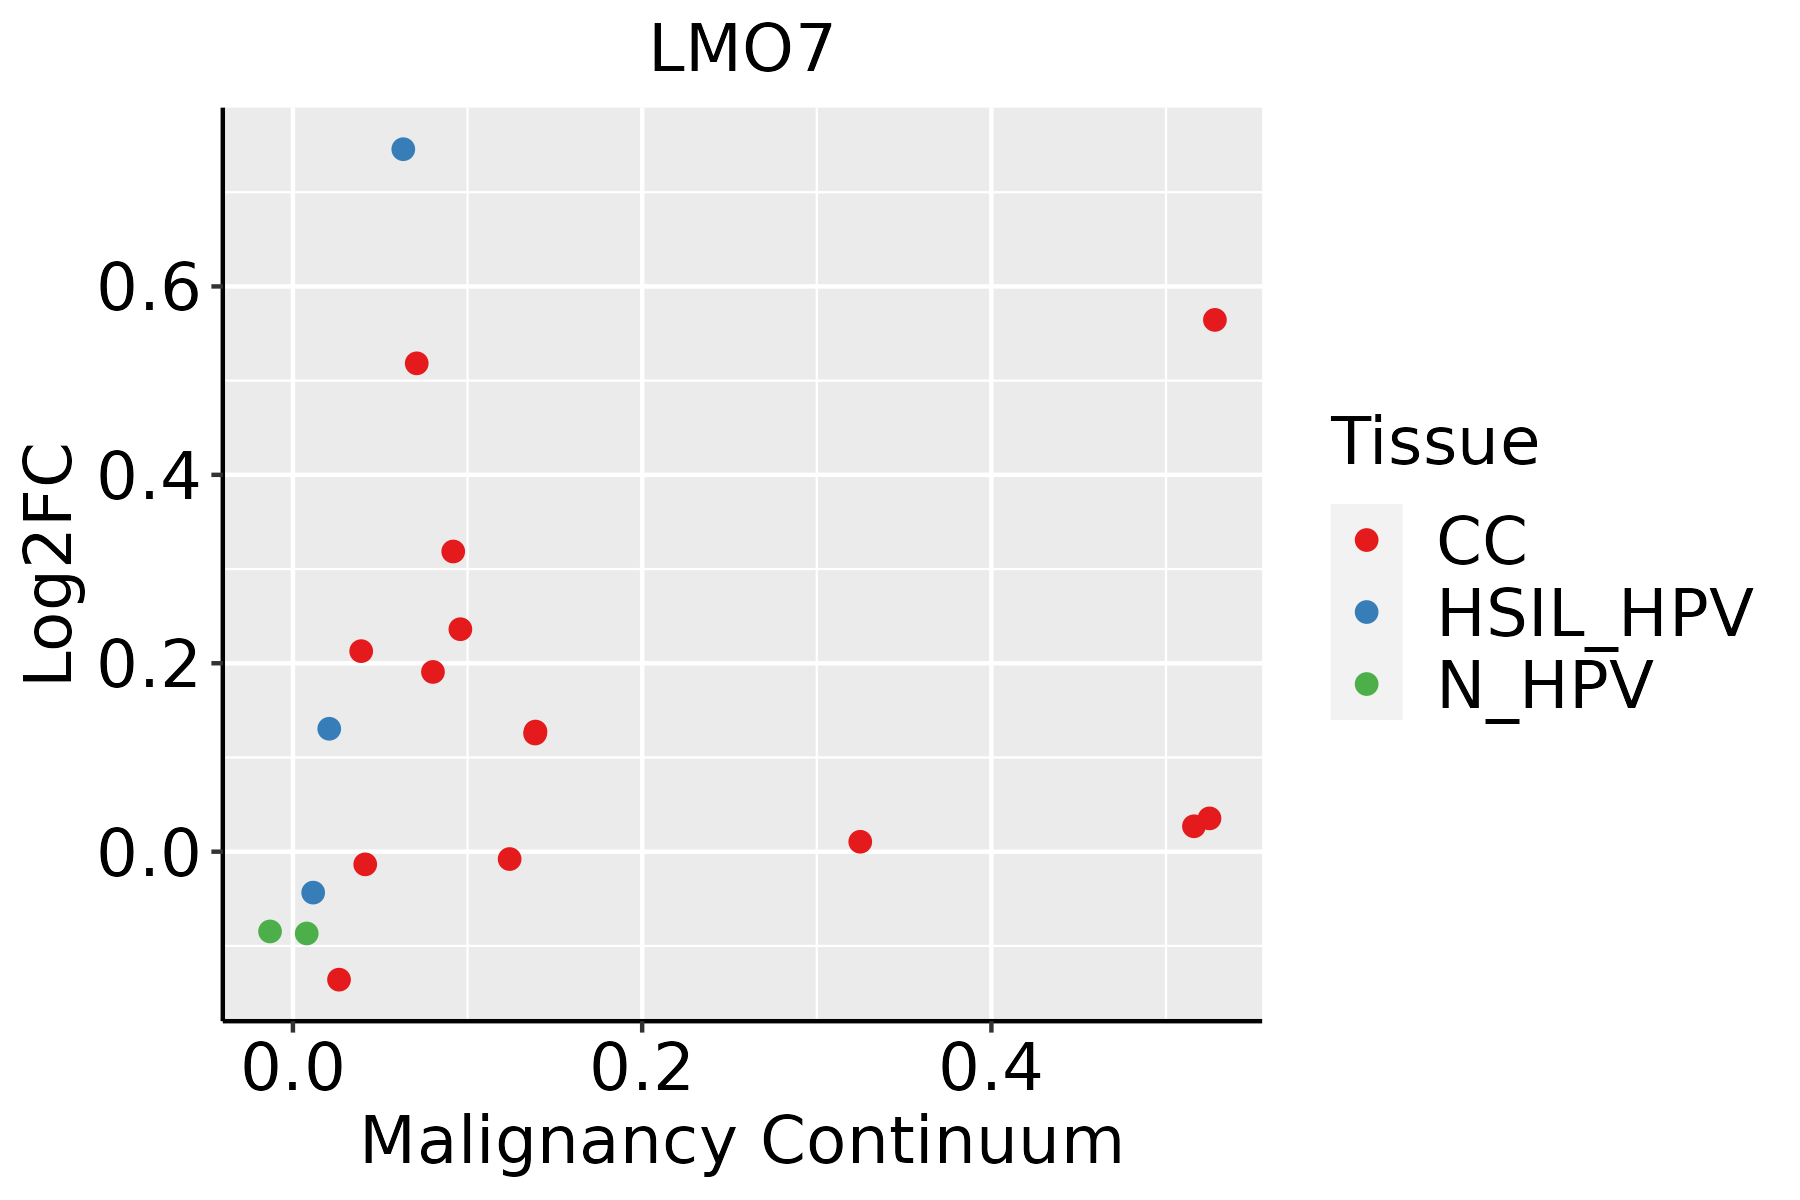 | CC: Cervix cancer |
| HSIL_HPV: HPV-infected high-grade squamous intraepithelial lesions | ||
| N_HPV: HPV-infected normal cervix | ||
| Colorectum (GSE201348) |  | FAP: Familial adenomatous polyposis |
| CRC: Colorectal cancer | ||
| Colorectum (HTA11) |  | AD: Adenomas |
| SER: Sessile serrated lesions | ||
| MSI-H: Microsatellite-high colorectal cancer | ||
| MSS: Microsatellite stable colorectal cancer | ||
| Endometrium |  | AEH: Atypical endometrial hyperplasia |
| EEC: Endometrioid Cancer | ||
| Esophagus | 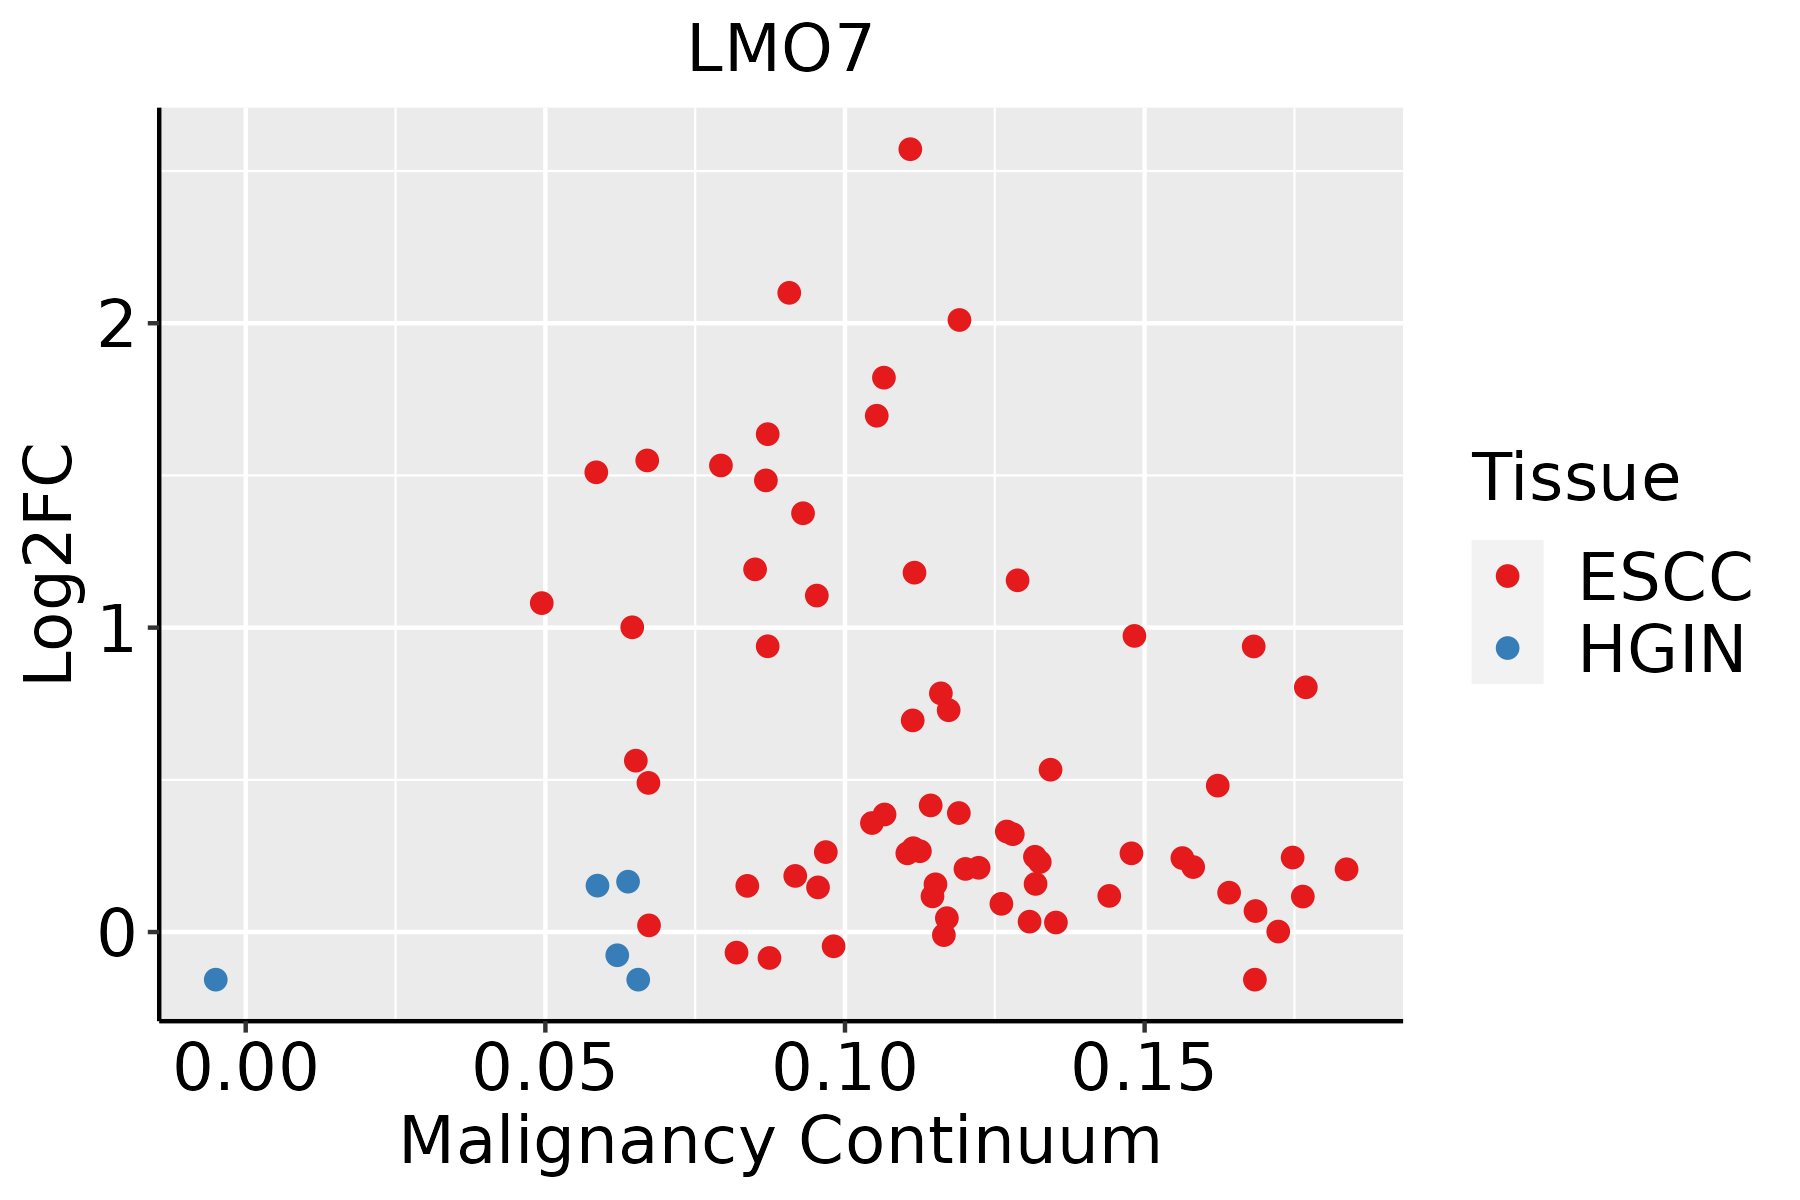 | ESCC: Esophageal squamous cell carcinoma |
| HGIN: High-grade intraepithelial neoplasias | ||
| LGIN: Low-grade intraepithelial neoplasias | ||
| GC | 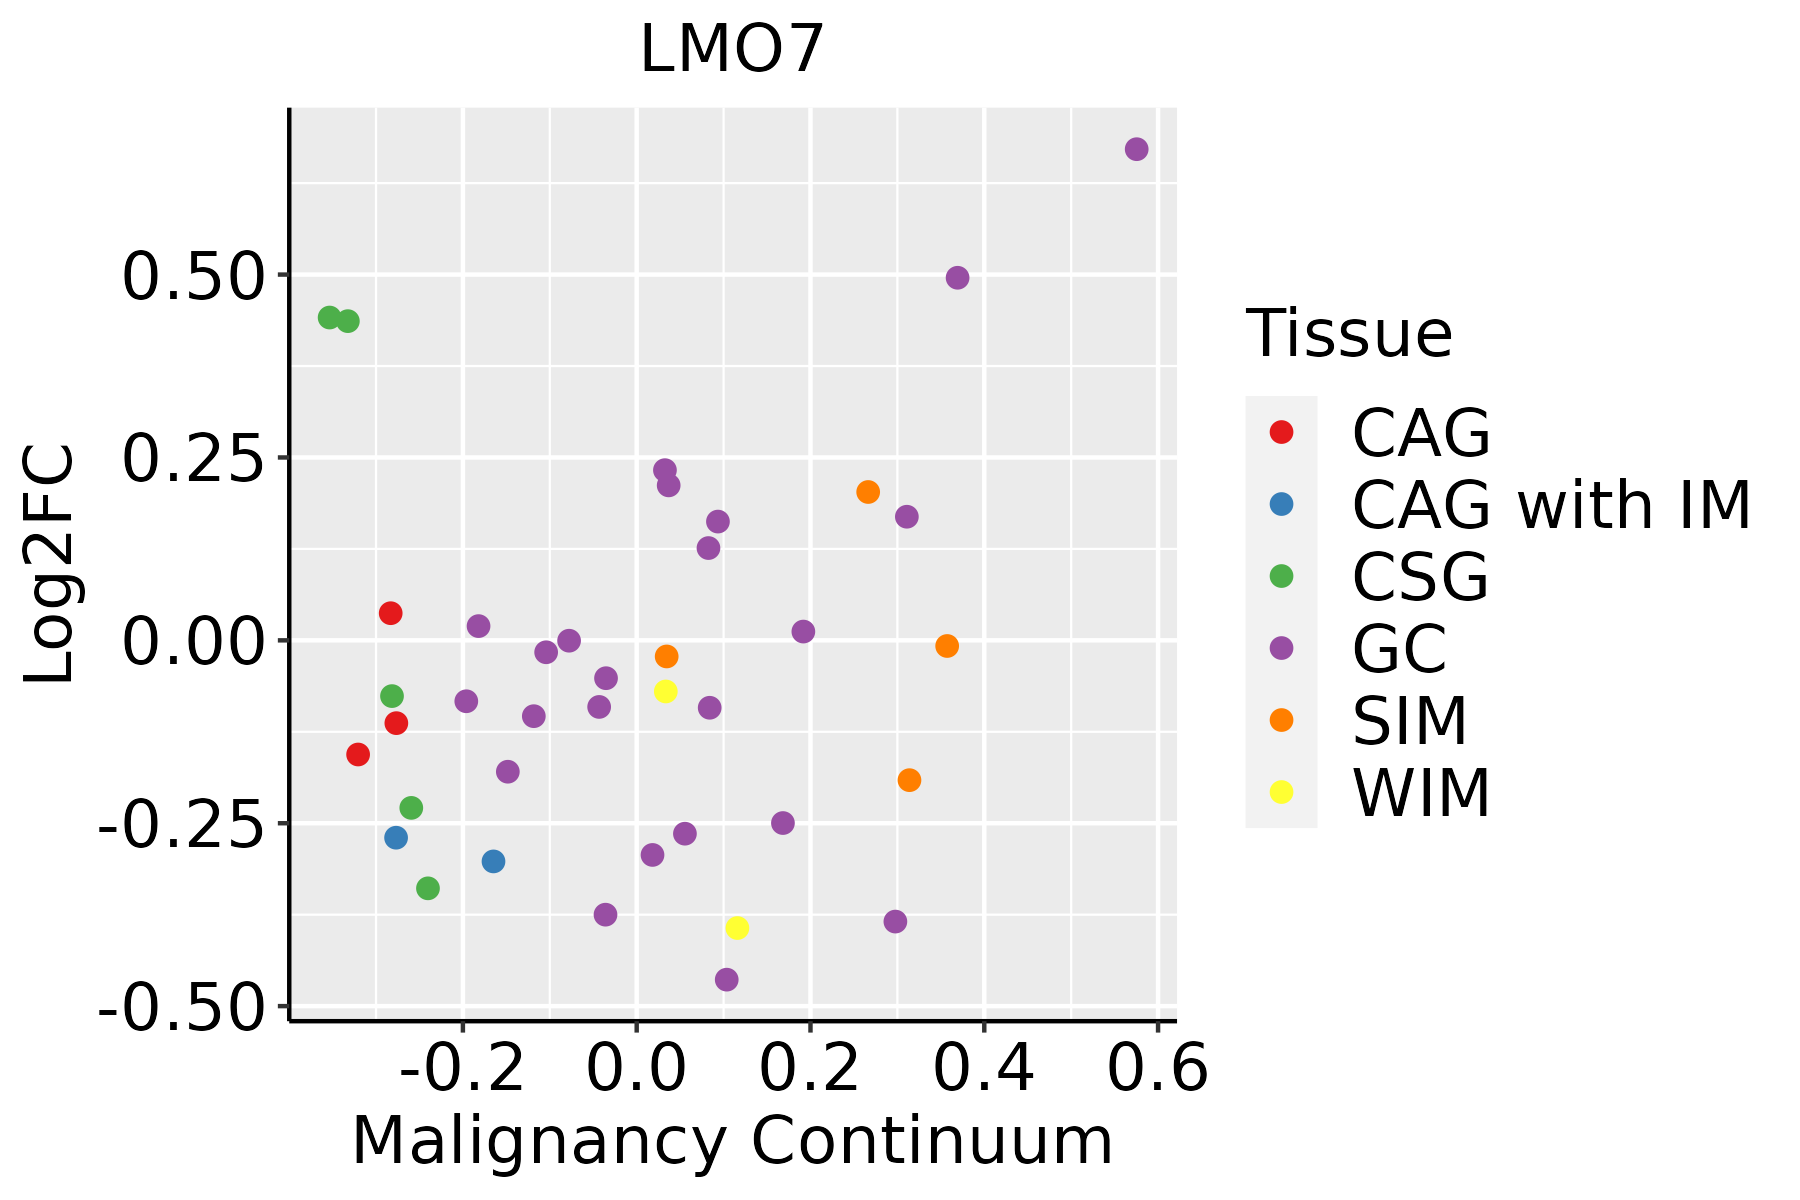 | CAG: Chronic atrophic gastritis |
| CAG with IM: Chronic atrophic gastritis with intestinal metaplasia | ||
| CSG: Chronic superficial gastritis | ||
| GC: Gastric cancer | ||
| SIM: Severe intestinal metaplasia | ||
| WIM: Wild intestinal metaplasia | ||
| Liver | 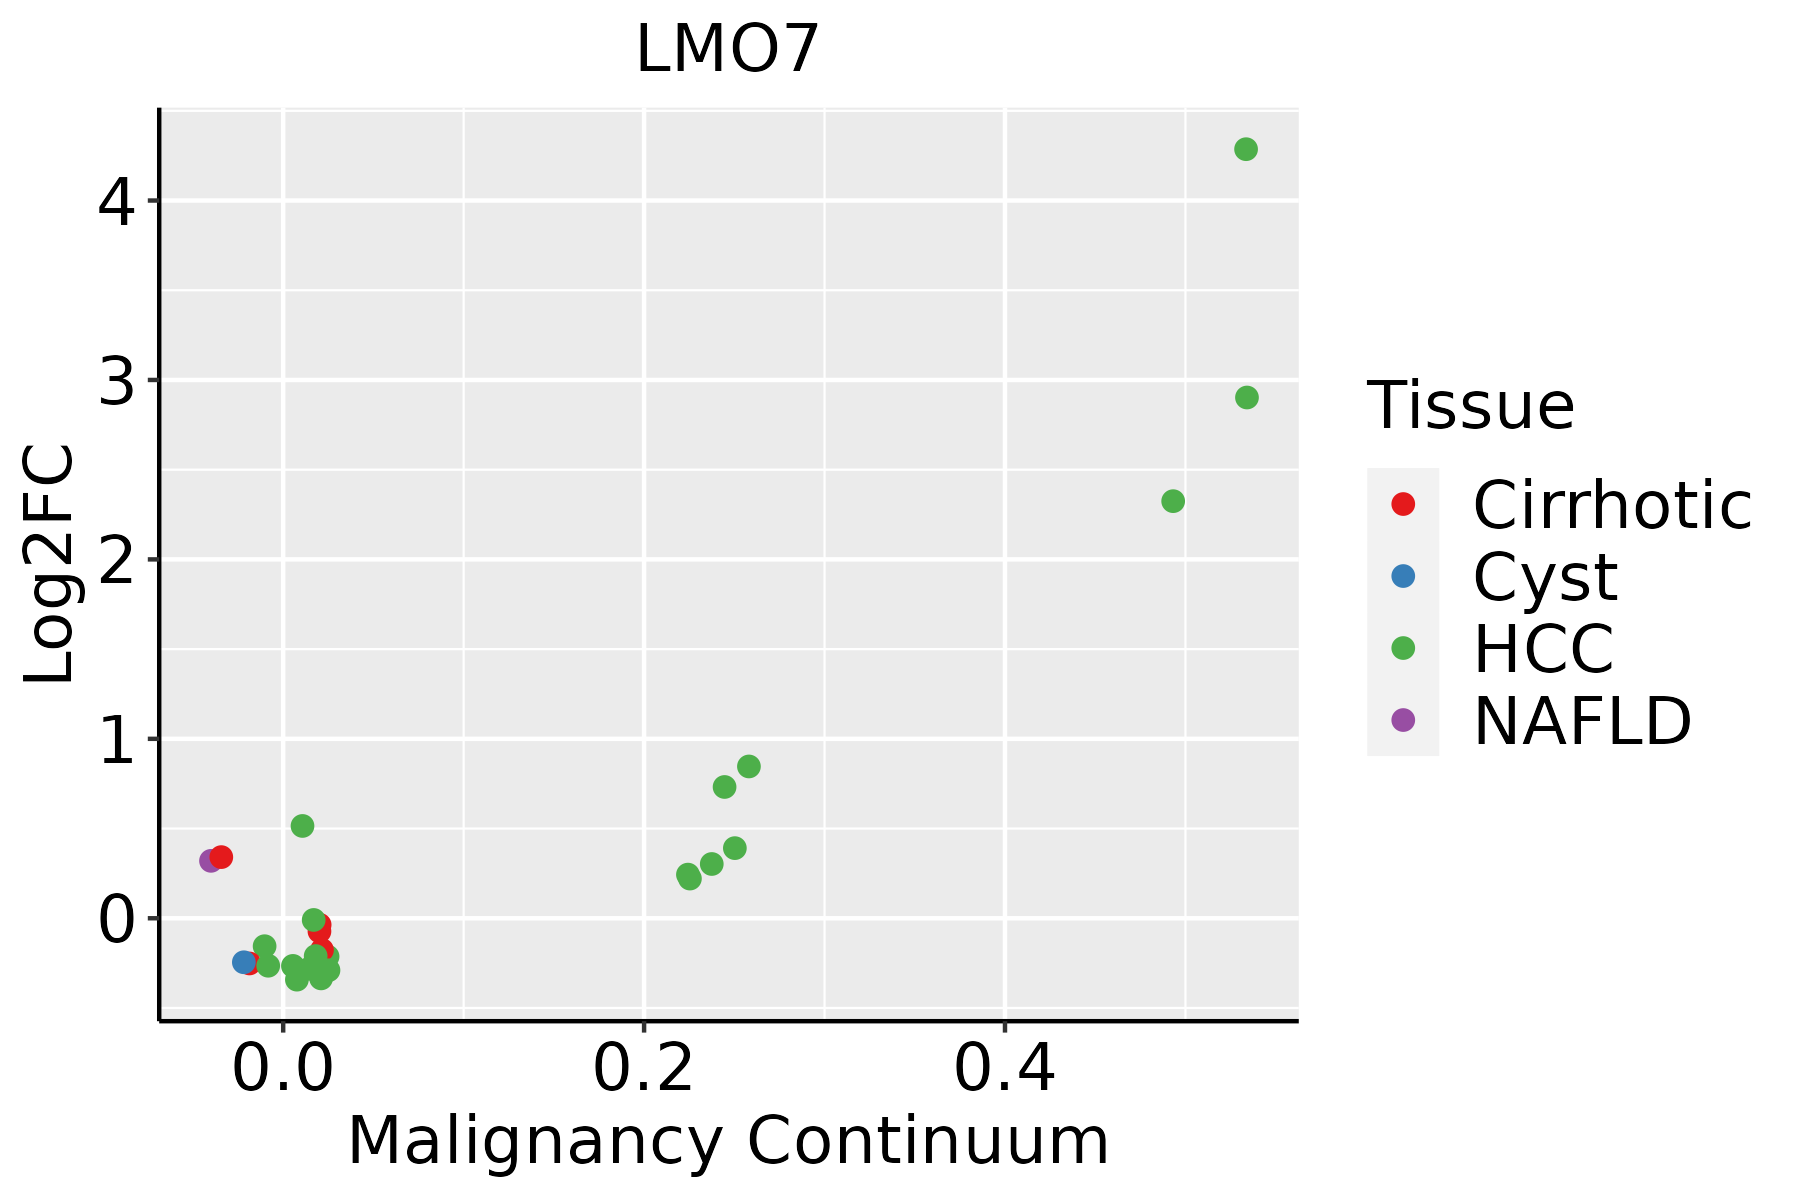 | HCC: Hepatocellular carcinoma |
| NAFLD: Non-alcoholic fatty liver disease | ||
| Lung |  | AAH: Atypical adenomatous hyperplasia |
| AIS: Adenocarcinoma in situ | ||
| IAC: Invasive lung adenocarcinoma | ||
| MIA: Minimally invasive adenocarcinoma | ||
| Oral Cavity | 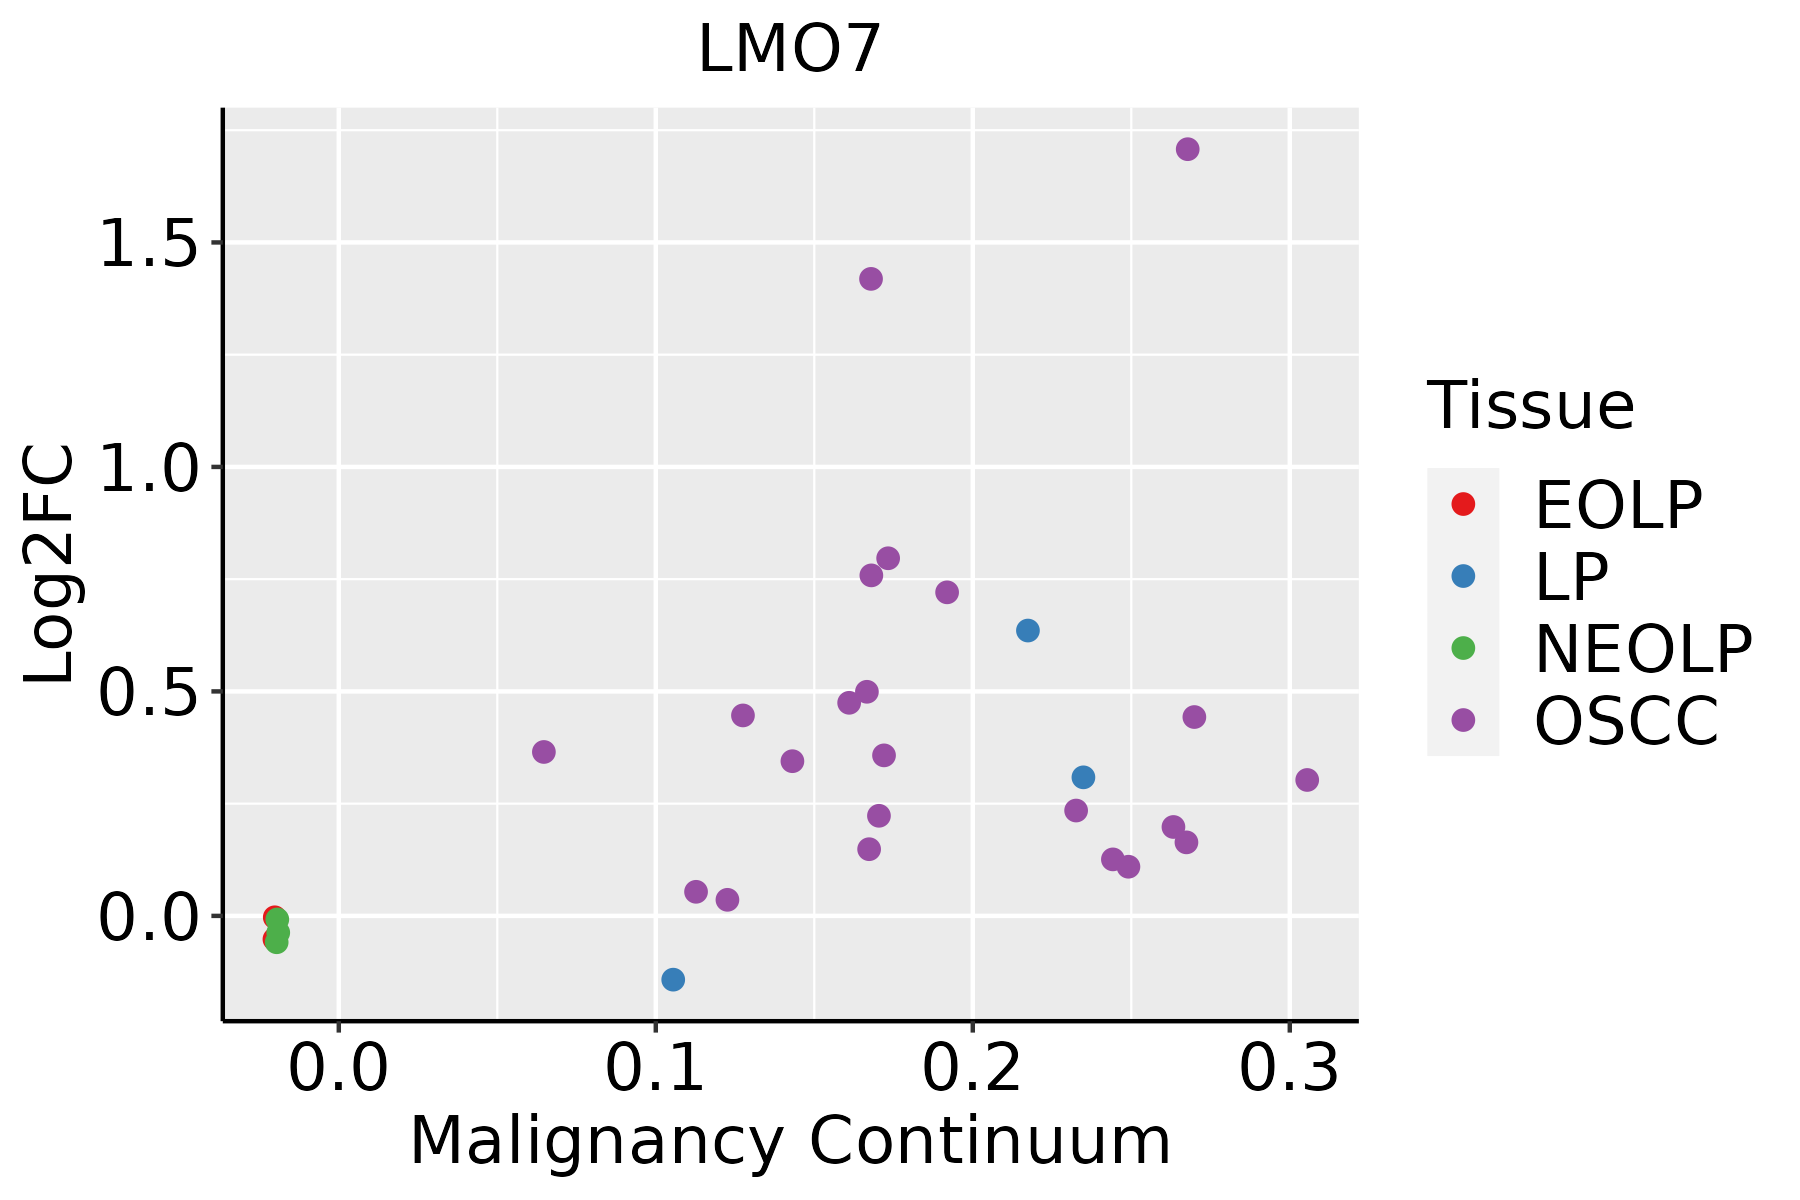 | EOLP: Erosive Oral lichen planus |
| LP: leukoplakia | ||
| NEOLP: Non-erosive oral lichen planus | ||
| OSCC: Oral squamous cell carcinoma | ||
| Prostate | 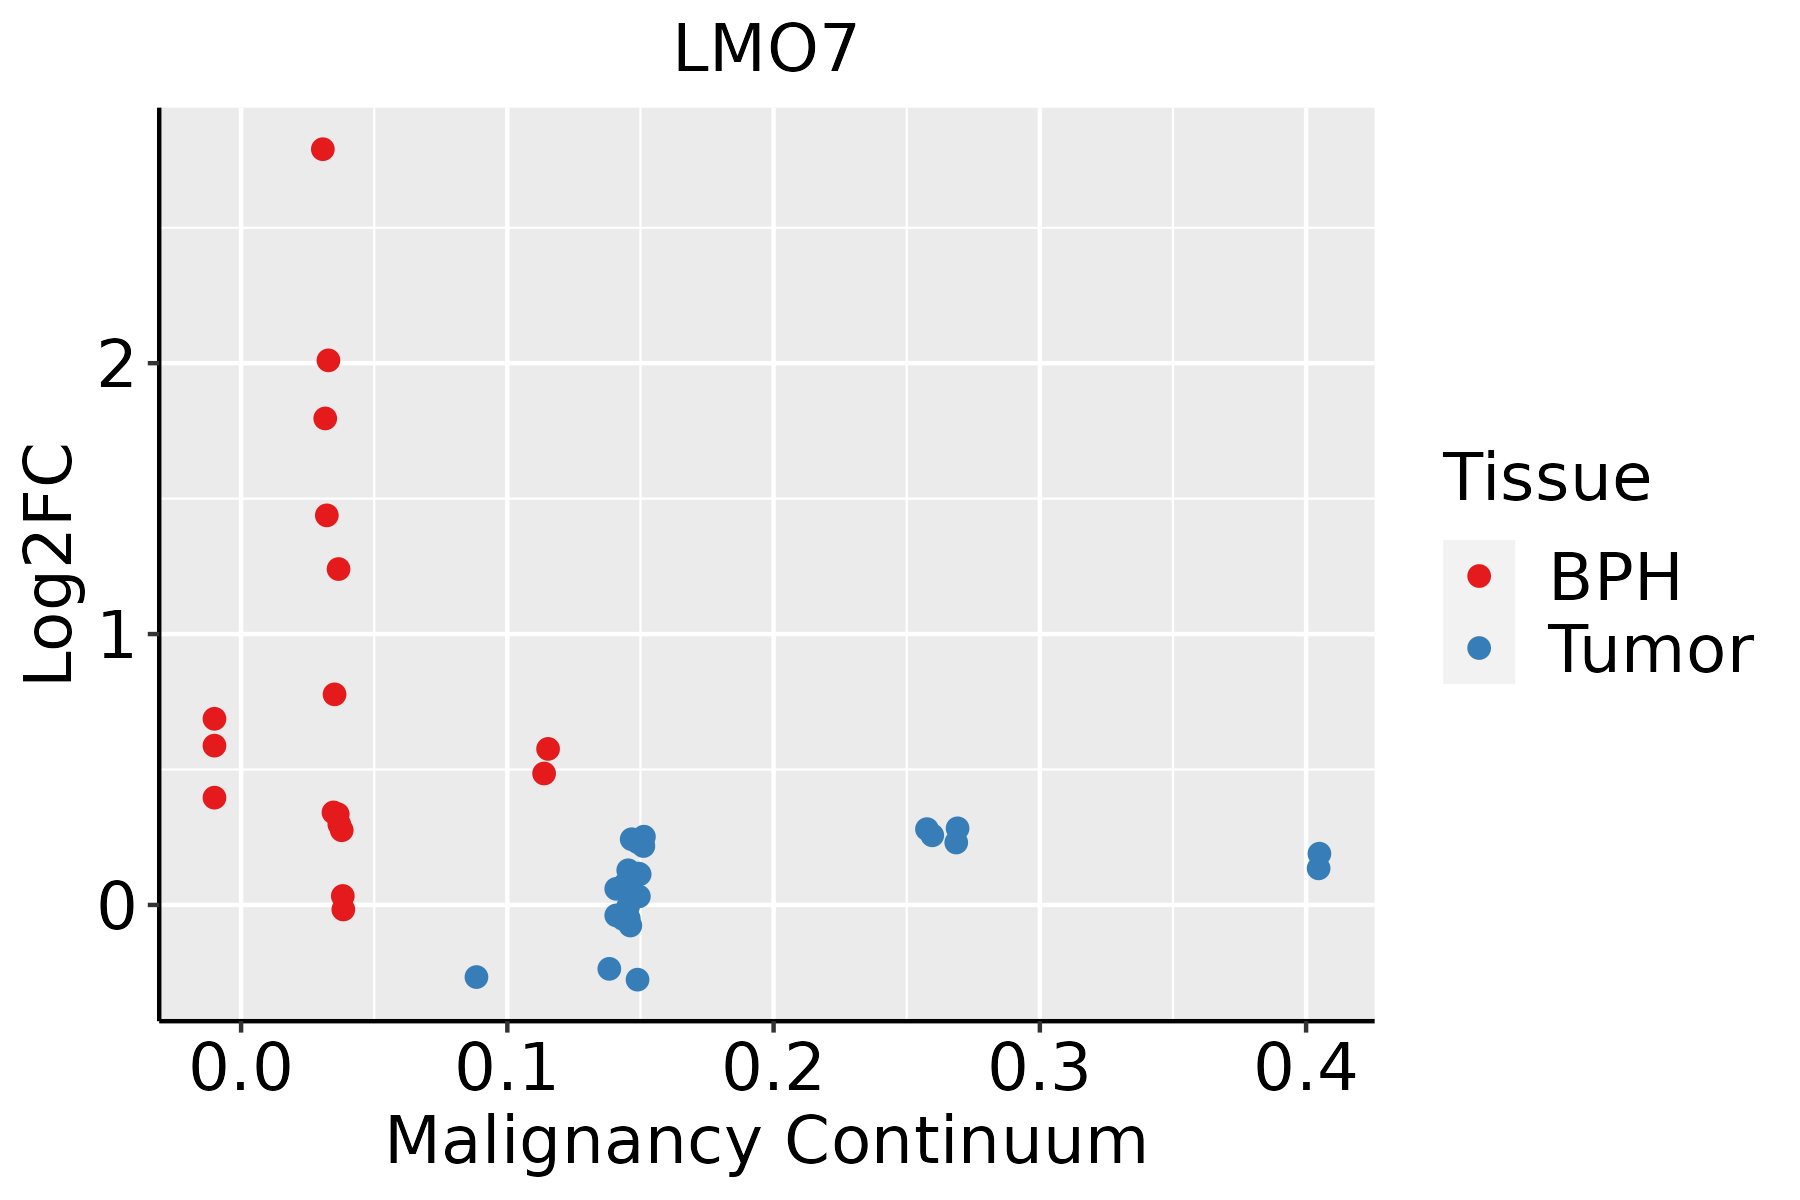 | BPH: Benign Prostatic Hyperplasia |
| Thyroid | 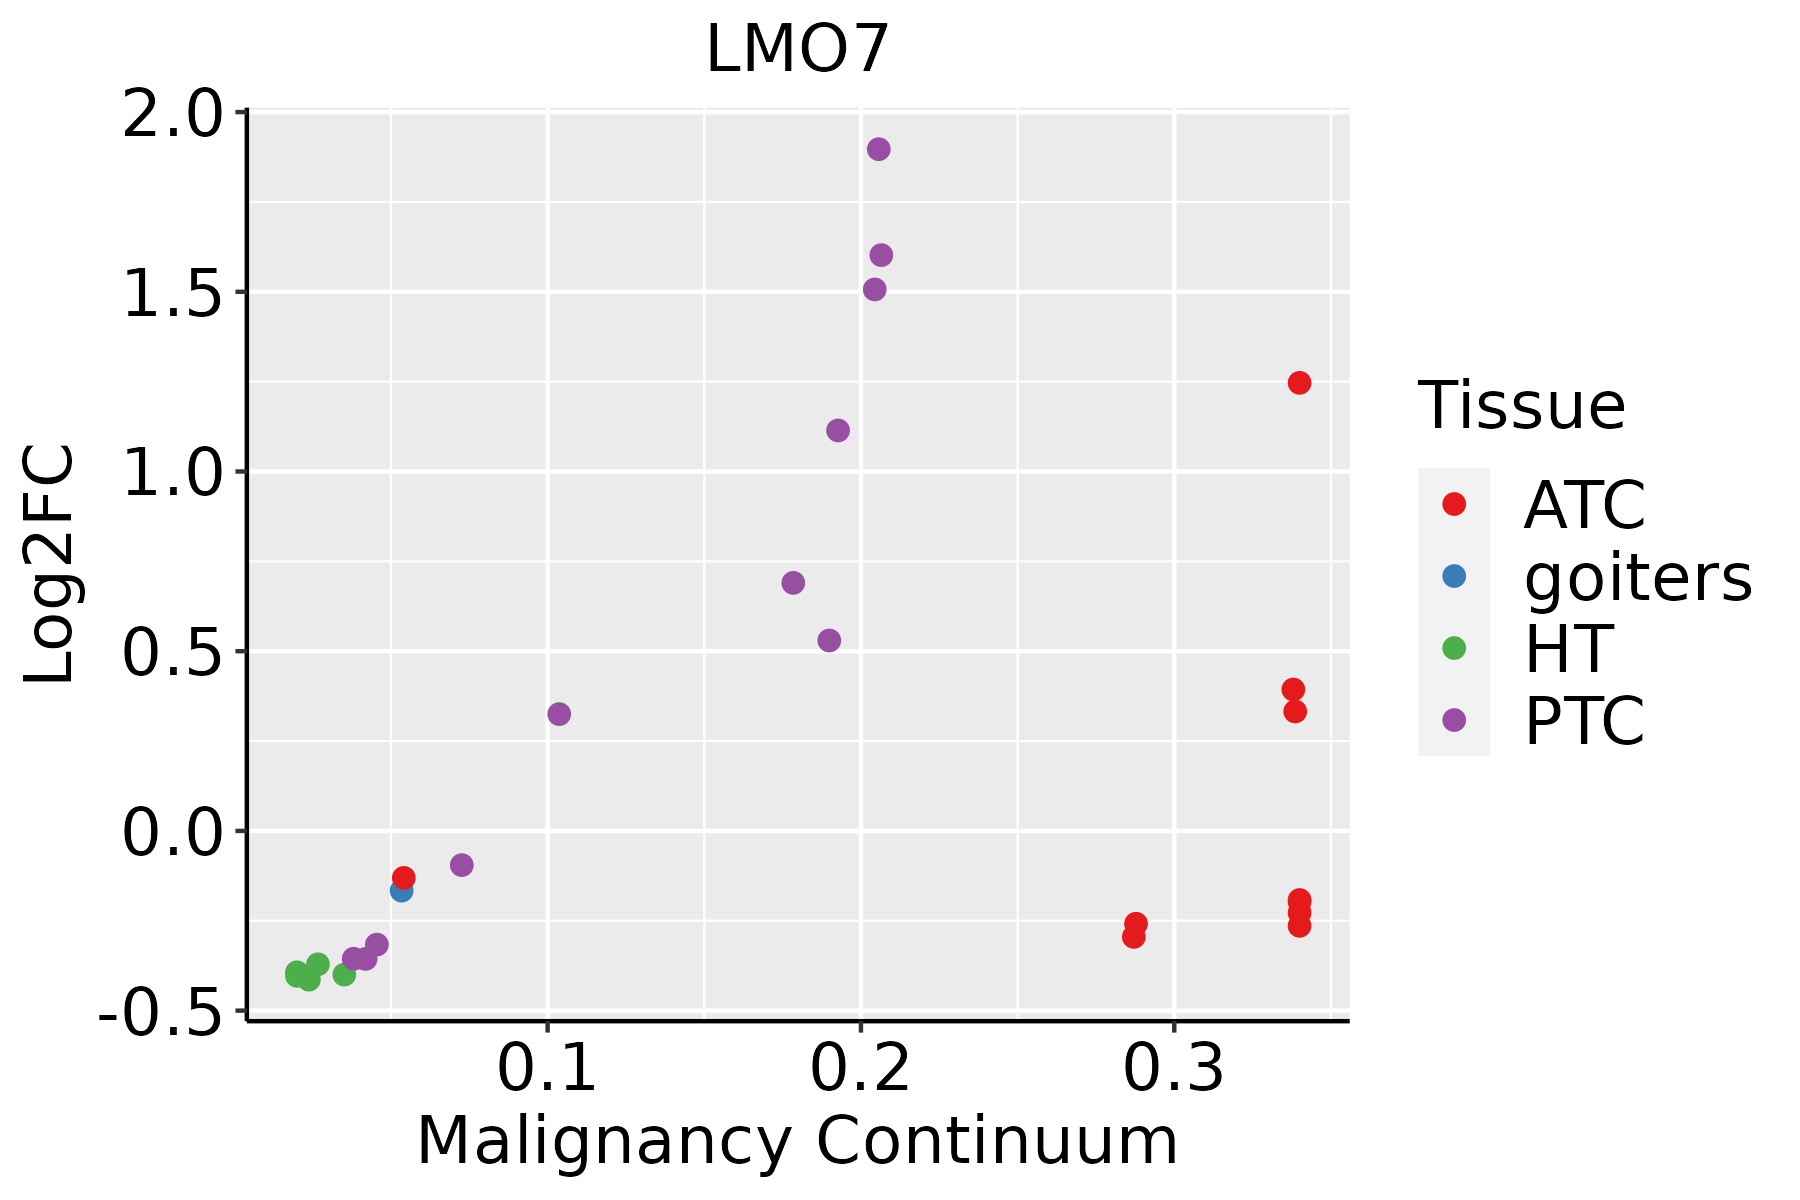 | ATC: Anaplastic thyroid cancer |
| HT: Hashimoto's thyroiditis | ||
| PTC: Papillary thyroid cancer |
| ∗log2FC in expression of this searched gene in stem-like cells from each diseased tissue sample relative to stem-like cells in normal samples in each tissue plotted against the malignancy continuum. Samples are colored based on if they are from different disease stage. |
Top |
Malignant transformation related pathway analysis |
| Find out the enriched GO biological processes and KEGG pathways involved in transition from healthy to precancer to cancer |
| Tissue | Disease Stage | Enriched GO biological Processes |
| Colorectum | AD |  |
| Colorectum | SER |  |
| Colorectum | MSS |  |
| Colorectum | MSI-H |  |
| Colorectum | FAP |  |
| ∗Top 15 enriched GO BP terms are showed in the bar plot of each disease state in each tissue. Each row represents a significant GO biological process which is colored according to the -log10(p.adjust). |
| Page: 1 2 3 4 5 6 7 8 9 |
| GO ID | Tissue | Disease Stage | Description | Gene Ratio | Bg Ratio | pvalue | p.adjust | Count |
| Page: 1 |
| Pathway ID | Tissue | Disease Stage | Description | Gene Ratio | Bg Ratio | pvalue | p.adjust | qvalue | Count |
| hsa04520 | Colorectum | AD | Adherens junction | 50/2092 | 93/8465 | 1.52e-09 | 2.83e-08 | 1.81e-08 | 50 |
| hsa045201 | Colorectum | AD | Adherens junction | 50/2092 | 93/8465 | 1.52e-09 | 2.83e-08 | 1.81e-08 | 50 |
| hsa045202 | Colorectum | SER | Adherens junction | 37/1580 | 93/8465 | 1.54e-06 | 2.35e-05 | 1.71e-05 | 37 |
| hsa045203 | Colorectum | SER | Adherens junction | 37/1580 | 93/8465 | 1.54e-06 | 2.35e-05 | 1.71e-05 | 37 |
| hsa045204 | Colorectum | MSS | Adherens junction | 42/1875 | 93/8465 | 6.18e-07 | 9.01e-06 | 5.52e-06 | 42 |
| hsa045205 | Colorectum | MSS | Adherens junction | 42/1875 | 93/8465 | 6.18e-07 | 9.01e-06 | 5.52e-06 | 42 |
| hsa045208 | Colorectum | FAP | Adherens junction | 45/1404 | 93/8465 | 8.66e-13 | 2.89e-10 | 1.76e-10 | 45 |
| hsa045209 | Colorectum | FAP | Adherens junction | 45/1404 | 93/8465 | 8.66e-13 | 2.89e-10 | 1.76e-10 | 45 |
| hsa0452010 | Colorectum | CRC | Adherens junction | 37/1091 | 93/8465 | 5.72e-11 | 6.37e-09 | 4.32e-09 | 37 |
| hsa0452011 | Colorectum | CRC | Adherens junction | 37/1091 | 93/8465 | 5.72e-11 | 6.37e-09 | 4.32e-09 | 37 |
| hsa0452025 | Endometrium | AEH | Adherens junction | 36/1197 | 93/8465 | 3.49e-09 | 5.98e-08 | 4.37e-08 | 36 |
| hsa04520111 | Endometrium | AEH | Adherens junction | 36/1197 | 93/8465 | 3.49e-09 | 5.98e-08 | 4.37e-08 | 36 |
| hsa0452030 | Esophagus | ESCC | Adherens junction | 69/4205 | 93/8465 | 1.08e-06 | 6.83e-06 | 3.50e-06 | 69 |
| hsa04520114 | Esophagus | ESCC | Adherens junction | 69/4205 | 93/8465 | 1.08e-06 | 6.83e-06 | 3.50e-06 | 69 |
| hsa0452014 | Liver | NAFLD | Adherens junction | 37/1043 | 93/8465 | 1.50e-11 | 1.64e-09 | 1.32e-09 | 37 |
| hsa0452015 | Liver | NAFLD | Adherens junction | 37/1043 | 93/8465 | 1.50e-11 | 1.64e-09 | 1.32e-09 | 37 |
| hsa0452022 | Liver | Cirrhotic | Adherens junction | 52/2530 | 93/8465 | 1.36e-07 | 1.97e-06 | 1.21e-06 | 52 |
| hsa0452032 | Liver | Cirrhotic | Adherens junction | 52/2530 | 93/8465 | 1.36e-07 | 1.97e-06 | 1.21e-06 | 52 |
| hsa0452042 | Liver | HCC | Adherens junction | 68/4020 | 93/8465 | 3.99e-07 | 4.46e-06 | 2.48e-06 | 68 |
| hsa0452052 | Liver | HCC | Adherens junction | 68/4020 | 93/8465 | 3.99e-07 | 4.46e-06 | 2.48e-06 | 68 |
| Page: 1 2 |
Top |
Cell-cell communication analysis |
| Identification of potential cell-cell interactions between two cell types and their ligand-receptor pairs for different disease states |
| Ligand | Receptor | LRpair | Pathway | Tissue | Disease Stage |
| Page: 1 |
Top |
Single-cell gene regulatory network inference analysis |
| Find out the significant the regulons (TFs) and the target genes of each regulon across cell types for different disease states |
| TF | Cell Type | Tissue | Disease Stage | Target Gene | RSS | Regulon Activity |
| ∗The dot plots of a searched regulon are shown for all cell subpopulations in each disease state of each tissue based on the regulon specific score inferred using pySCENIC and by calculating the average expression. |
| Page: 1 |
Top |
Somatic mutation of malignant transformation related genes |
| Annotation of somatic variants for genes involved in malignant transformation |
| Hugo Symbol | Variant Class | Variant Classification | dbSNP RS | HGVSc | HGVSp | HGVSp Short | SWISSPROT | BIOTYPE | SIFT | PolyPhen | Tumor Sample Barcode | Tissue | Histology | Sex | Age | Stage | Therapy Types | Drugs | Outcome |
| LMO7 | SNV | Missense_Mutation | rs190179934 | c.1771N>T | p.Arg591Cys | p.R591C | protein_coding | deleterious(0) | probably_damaging(1) | TCGA-A8-A09E-01 | Breast | breast invasive carcinoma | Female | >=65 | III/IV | Hormone Therapy | anastrozole | SD | |
| LMO7 | SNV | Missense_Mutation | novel | c.255N>C | p.Leu85Phe | p.L85F | protein_coding | deleterious(0) | probably_damaging(1) | TCGA-AC-A2QI-01 | Breast | breast invasive carcinoma | Female | >=65 | III/IV | Chemotherapy | cytoxan | CR | |
| LMO7 | SNV | Missense_Mutation | c.3701G>A | p.Ser1234Asn | p.S1234N | protein_coding | tolerated(0.16) | benign(0.023) | TCGA-AN-A0AK-01 | Breast | breast invasive carcinoma | Female | >=65 | I/II | Unknown | Unknown | SD | ||
| LMO7 | SNV | Missense_Mutation | novel | c.4529N>A | p.Pro1510His | p.P1510H | protein_coding | deleterious(0) | probably_damaging(1) | TCGA-BH-A0B4-01 | Breast | breast invasive carcinoma | Male | >=65 | III/IV | Hormone Therapy | tamoxiphen | SD | |
| LMO7 | SNV | Missense_Mutation | novel | c.2328N>A | p.Ser776Arg | p.S776R | protein_coding | tolerated(0.07) | benign(0.171) | TCGA-BH-A1FM-01 | Breast | breast invasive carcinoma | Female | <65 | III/IV | Unknown | Unknown | SD | |
| LMO7 | SNV | Missense_Mutation | rs775633721 | c.3550A>G | p.Arg1184Gly | p.R1184G | protein_coding | deleterious(0) | benign(0.082) | TCGA-D8-A1XG-01 | Breast | breast invasive carcinoma | Female | >=65 | III/IV | Unknown | Unknown | SD | |
| LMO7 | SNV | Missense_Mutation | novel | c.1481N>C | p.Val494Ala | p.V494A | protein_coding | tolerated(0.09) | benign(0.445) | TCGA-D8-A1XQ-01 | Breast | breast invasive carcinoma | Female | >=65 | I/II | Unknown | Unknown | SD | |
| LMO7 | insertion | Frame_Shift_Ins | novel | c.2809_2810insGAATTGGATGGTGTTGGCTGTGTCTGATGCAGGAAATACACTG | p.Pro937ArgfsTer31 | p.P937Rfs*31 | protein_coding | TCGA-A2-A0EX-01 | Breast | breast invasive carcinoma | Female | <65 | I/II | Hormone Therapy | tamoxiphen | SD | |||
| LMO7 | insertion | In_Frame_Ins | novel | c.1275_1276insAAA | p.Pro425_Thr426insLys | p.P425_T426insK | protein_coding | TCGA-BH-A0AY-01 | Breast | breast invasive carcinoma | Female | <65 | I/II | Chemotherapy | SD | ||||
| LMO7 | insertion | Frame_Shift_Ins | novel | c.1277_1278insCCAACTTAAATTAGGCAAACAAGCAAGTAATAACCGA | p.Ser427GlnfsTer31 | p.S427Qfs*31 | protein_coding | TCGA-BH-A0AY-01 | Breast | breast invasive carcinoma | Female | <65 | I/II | Chemotherapy | SD |
| Page: 1 2 3 4 5 6 7 8 9 10 11 12 13 14 15 16 17 18 19 |
Top |
Related drugs of malignant transformation related genes |
| Identification of chemicals and drugs interact with genes involved in malignant transfromation |
| (DGIdb 4.0) |
| Entrez ID | Symbol | Category | Interaction Types | Drug Claim Name | Drug Name | PMIDs |
| Page: 1 |

Copyright 2023-Present -The University of Texas Health Science Center at Houston |