
|
|||||
|
 | |
| |
| |
| |
| |
| |
|
Gene: LMO4 |
Gene summary for LMO4 |
| Gene information | Species | Human | Gene symbol | LMO4 | Gene ID | 8543 |
| Gene name | LIM domain only 4 | |
| Gene Alias | LMO4 | |
| Cytomap | 1p22.3 | |
| Gene Type | protein-coding | GO ID | GO:0001708 | UniProtAcc | P61968 |
Top |
Malignant transformation analysis |
| Identification of the aberrant gene expression in precancerous and cancerous lesions by comparing the gene expression of stem-like cells in diseased tissues with normal stem cells |
| Entrez ID | Symbol | Replicates | Species | Organ | Tissue | Adj P-value | Log2FC | Malignancy |
| 8543 | LMO4 | GSM4909285 | Human | Breast | IDC | 1.33e-55 | 8.44e-01 | 0.21 |
| 8543 | LMO4 | GSM4909286 | Human | Breast | IDC | 5.75e-08 | 2.63e-01 | 0.1081 |
| 8543 | LMO4 | GSM4909287 | Human | Breast | IDC | 1.41e-22 | 5.85e-01 | 0.2057 |
| 8543 | LMO4 | GSM4909288 | Human | Breast | IDC | 5.98e-06 | 3.29e-01 | 0.0988 |
| 8543 | LMO4 | GSM4909291 | Human | Breast | IDC | 2.14e-17 | -5.51e-01 | 0.1753 |
| 8543 | LMO4 | GSM4909292 | Human | Breast | IDC | 1.03e-02 | -5.51e-01 | 0.1236 |
| 8543 | LMO4 | GSM4909293 | Human | Breast | IDC | 3.81e-08 | 3.16e-01 | 0.1581 |
| 8543 | LMO4 | GSM4909294 | Human | Breast | IDC | 6.02e-12 | 2.92e-01 | 0.2022 |
| 8543 | LMO4 | GSM4909296 | Human | Breast | IDC | 3.48e-13 | -2.73e-01 | 0.1524 |
| 8543 | LMO4 | GSM4909297 | Human | Breast | IDC | 6.64e-25 | -4.98e-01 | 0.1517 |
| 8543 | LMO4 | GSM4909301 | Human | Breast | IDC | 9.50e-16 | -4.68e-01 | 0.1577 |
| 8543 | LMO4 | GSM4909302 | Human | Breast | IDC | 5.37e-09 | -4.12e-01 | 0.1545 |
| 8543 | LMO4 | GSM4909306 | Human | Breast | IDC | 1.19e-03 | -3.58e-01 | 0.1564 |
| 8543 | LMO4 | GSM4909307 | Human | Breast | IDC | 2.31e-16 | -4.75e-01 | 0.1569 |
| 8543 | LMO4 | GSM4909308 | Human | Breast | IDC | 2.40e-20 | -5.20e-01 | 0.158 |
| 8543 | LMO4 | GSM4909309 | Human | Breast | IDC | 3.21e-06 | -3.88e-01 | 0.0483 |
| 8543 | LMO4 | GSM4909311 | Human | Breast | IDC | 2.75e-25 | -4.98e-01 | 0.1534 |
| 8543 | LMO4 | GSM4909312 | Human | Breast | IDC | 8.81e-15 | -3.72e-01 | 0.1552 |
| 8543 | LMO4 | GSM4909313 | Human | Breast | IDC | 3.26e-02 | -3.06e-01 | 0.0391 |
| 8543 | LMO4 | GSM4909315 | Human | Breast | IDC | 6.38e-26 | 5.80e-01 | 0.21 |
| Page: 1 2 3 4 5 6 7 8 9 10 11 12 |
| Tissue | Expression Dynamics | Abbreviation |
| Breast | 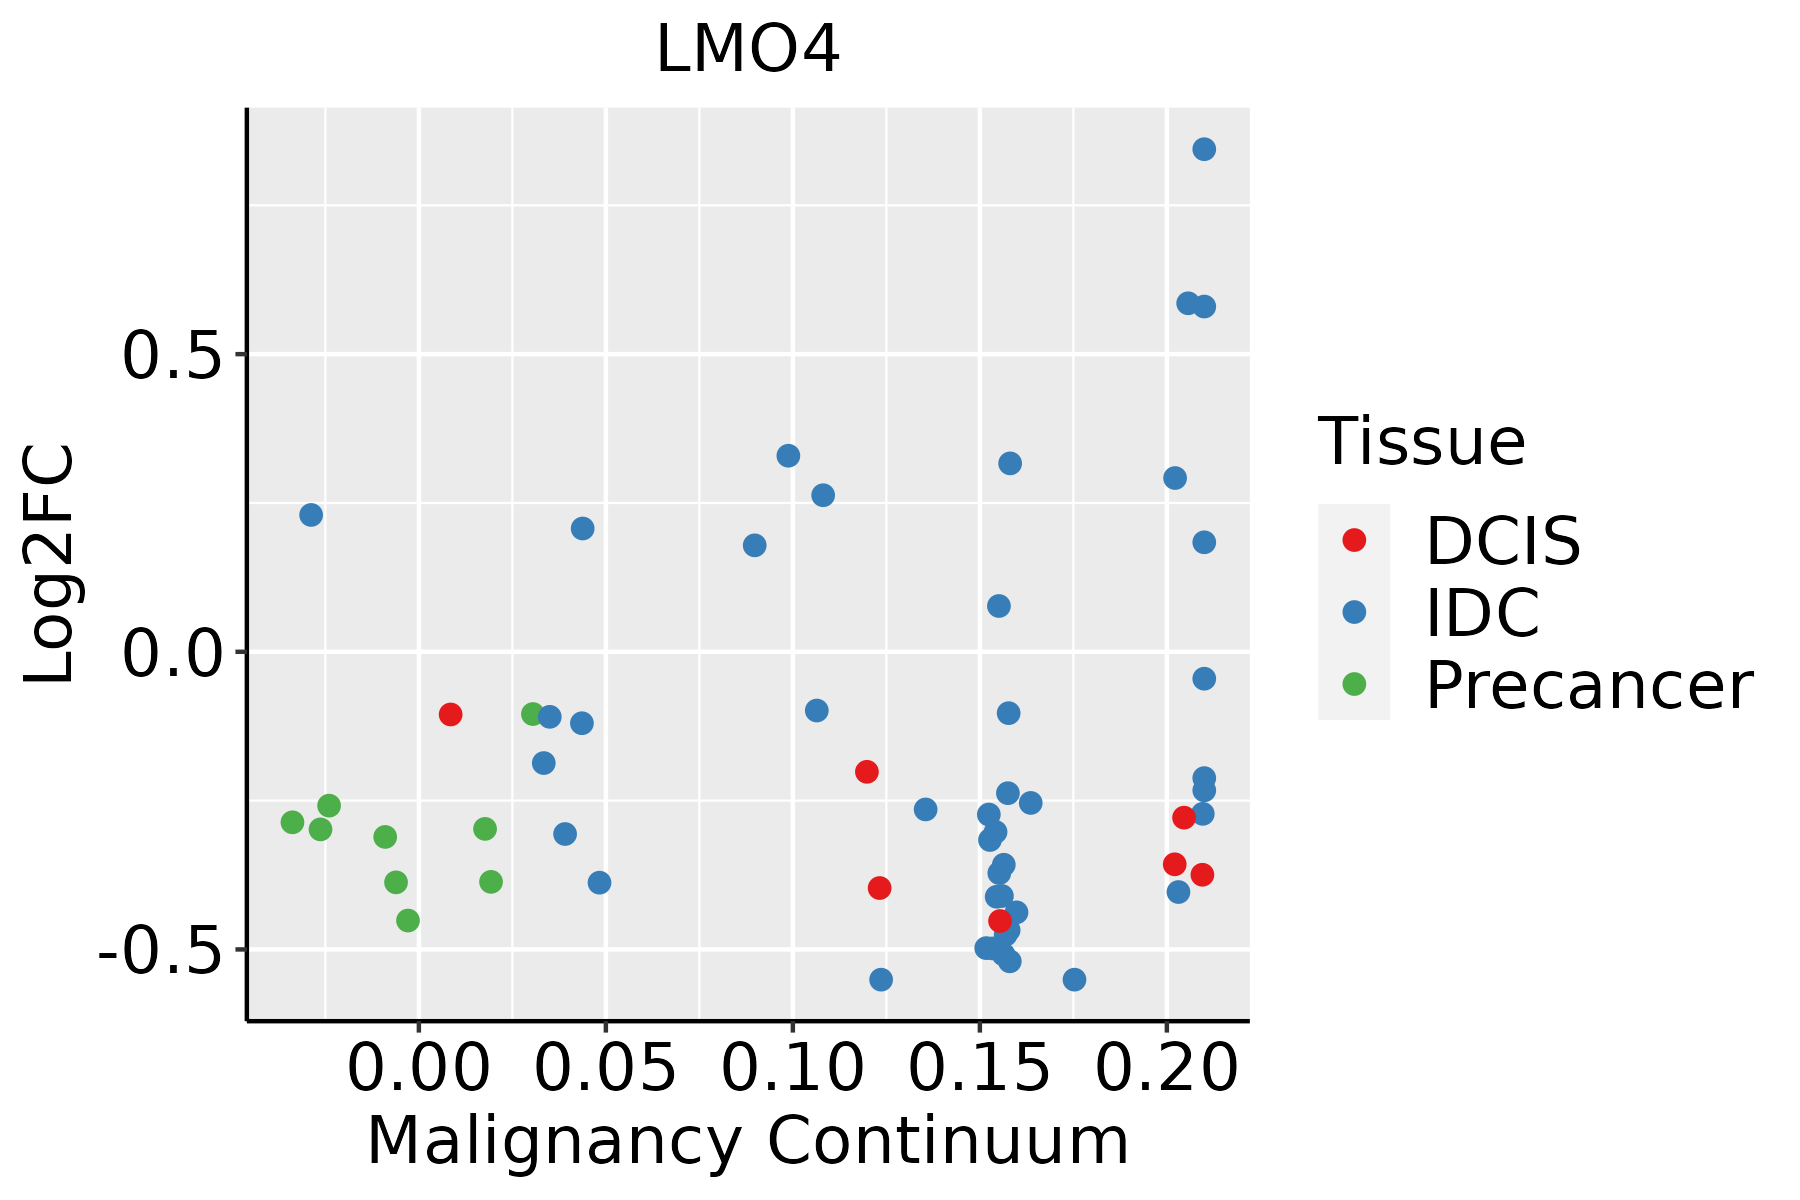 | IDC: Invasive ductal carcinoma |
| DCIS: Ductal carcinoma in situ | ||
| Precancer(BRCA1-mut): Precancerous lesion from BRCA1 mutation carriers | ||
| Cervix | 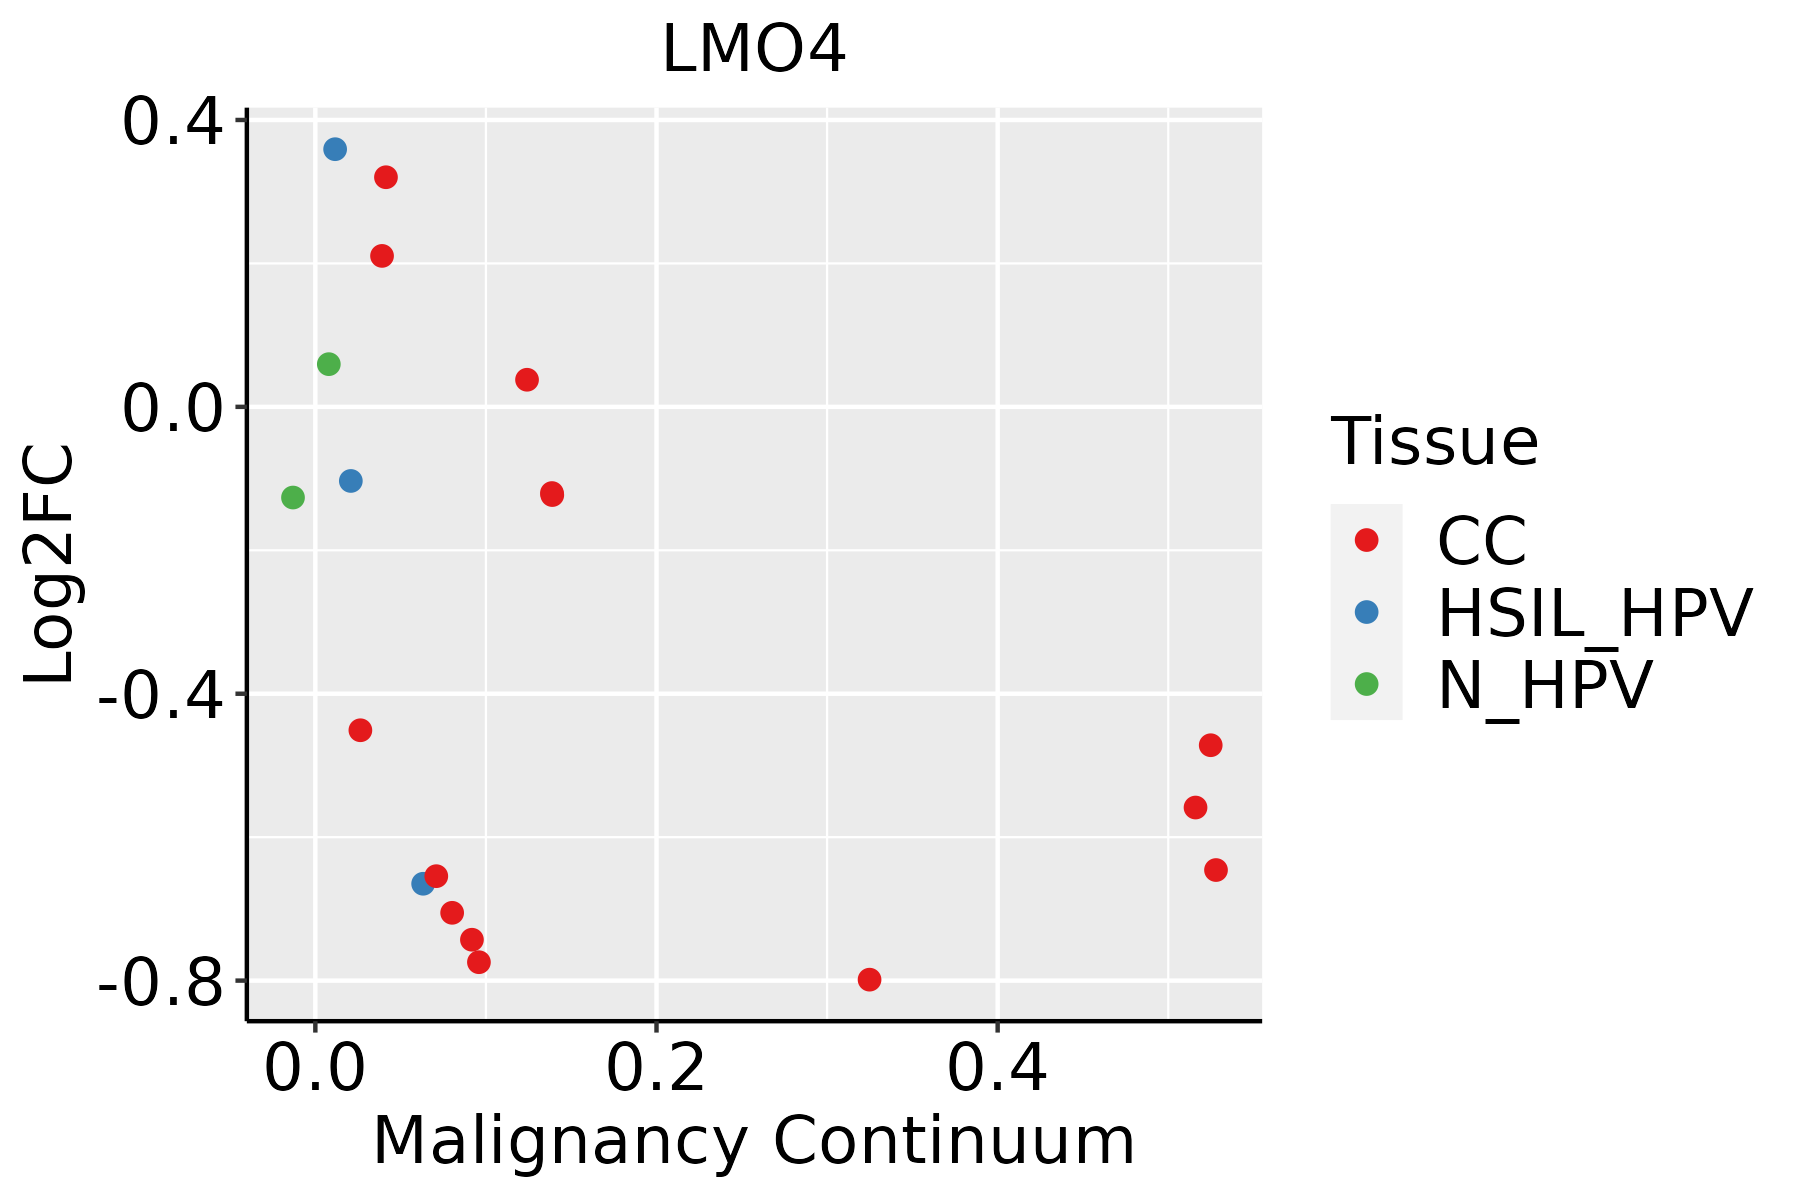 | CC: Cervix cancer |
| HSIL_HPV: HPV-infected high-grade squamous intraepithelial lesions | ||
| N_HPV: HPV-infected normal cervix | ||
| Colorectum (GSE201348) |  | FAP: Familial adenomatous polyposis |
| CRC: Colorectal cancer | ||
| Colorectum (HTA11) |  | AD: Adenomas |
| SER: Sessile serrated lesions | ||
| MSI-H: Microsatellite-high colorectal cancer | ||
| MSS: Microsatellite stable colorectal cancer | ||
| Endometrium | 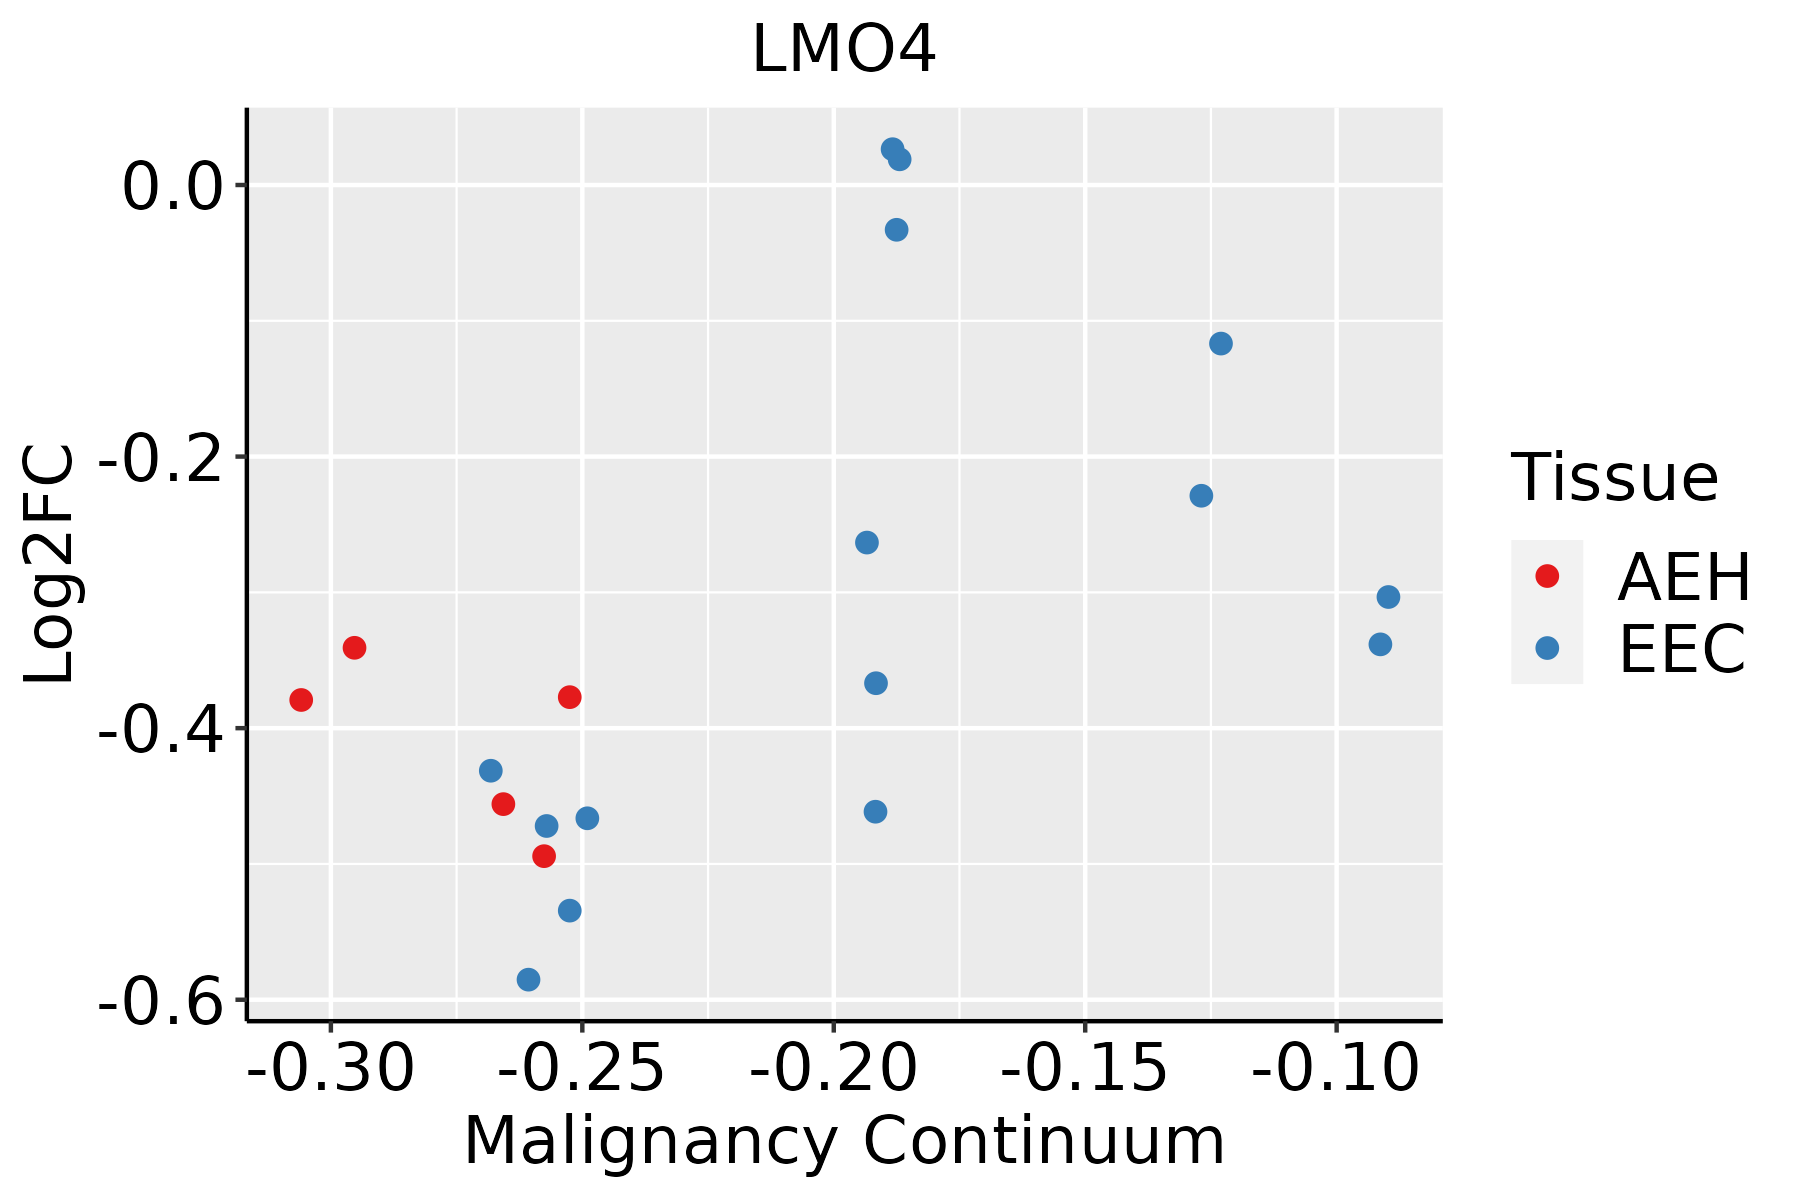 | AEH: Atypical endometrial hyperplasia |
| EEC: Endometrioid Cancer | ||
| Esophagus |  | ESCC: Esophageal squamous cell carcinoma |
| HGIN: High-grade intraepithelial neoplasias | ||
| LGIN: Low-grade intraepithelial neoplasias | ||
| GC |  | CAG: Chronic atrophic gastritis |
| CAG with IM: Chronic atrophic gastritis with intestinal metaplasia | ||
| CSG: Chronic superficial gastritis | ||
| GC: Gastric cancer | ||
| SIM: Severe intestinal metaplasia | ||
| WIM: Wild intestinal metaplasia | ||
| Liver | 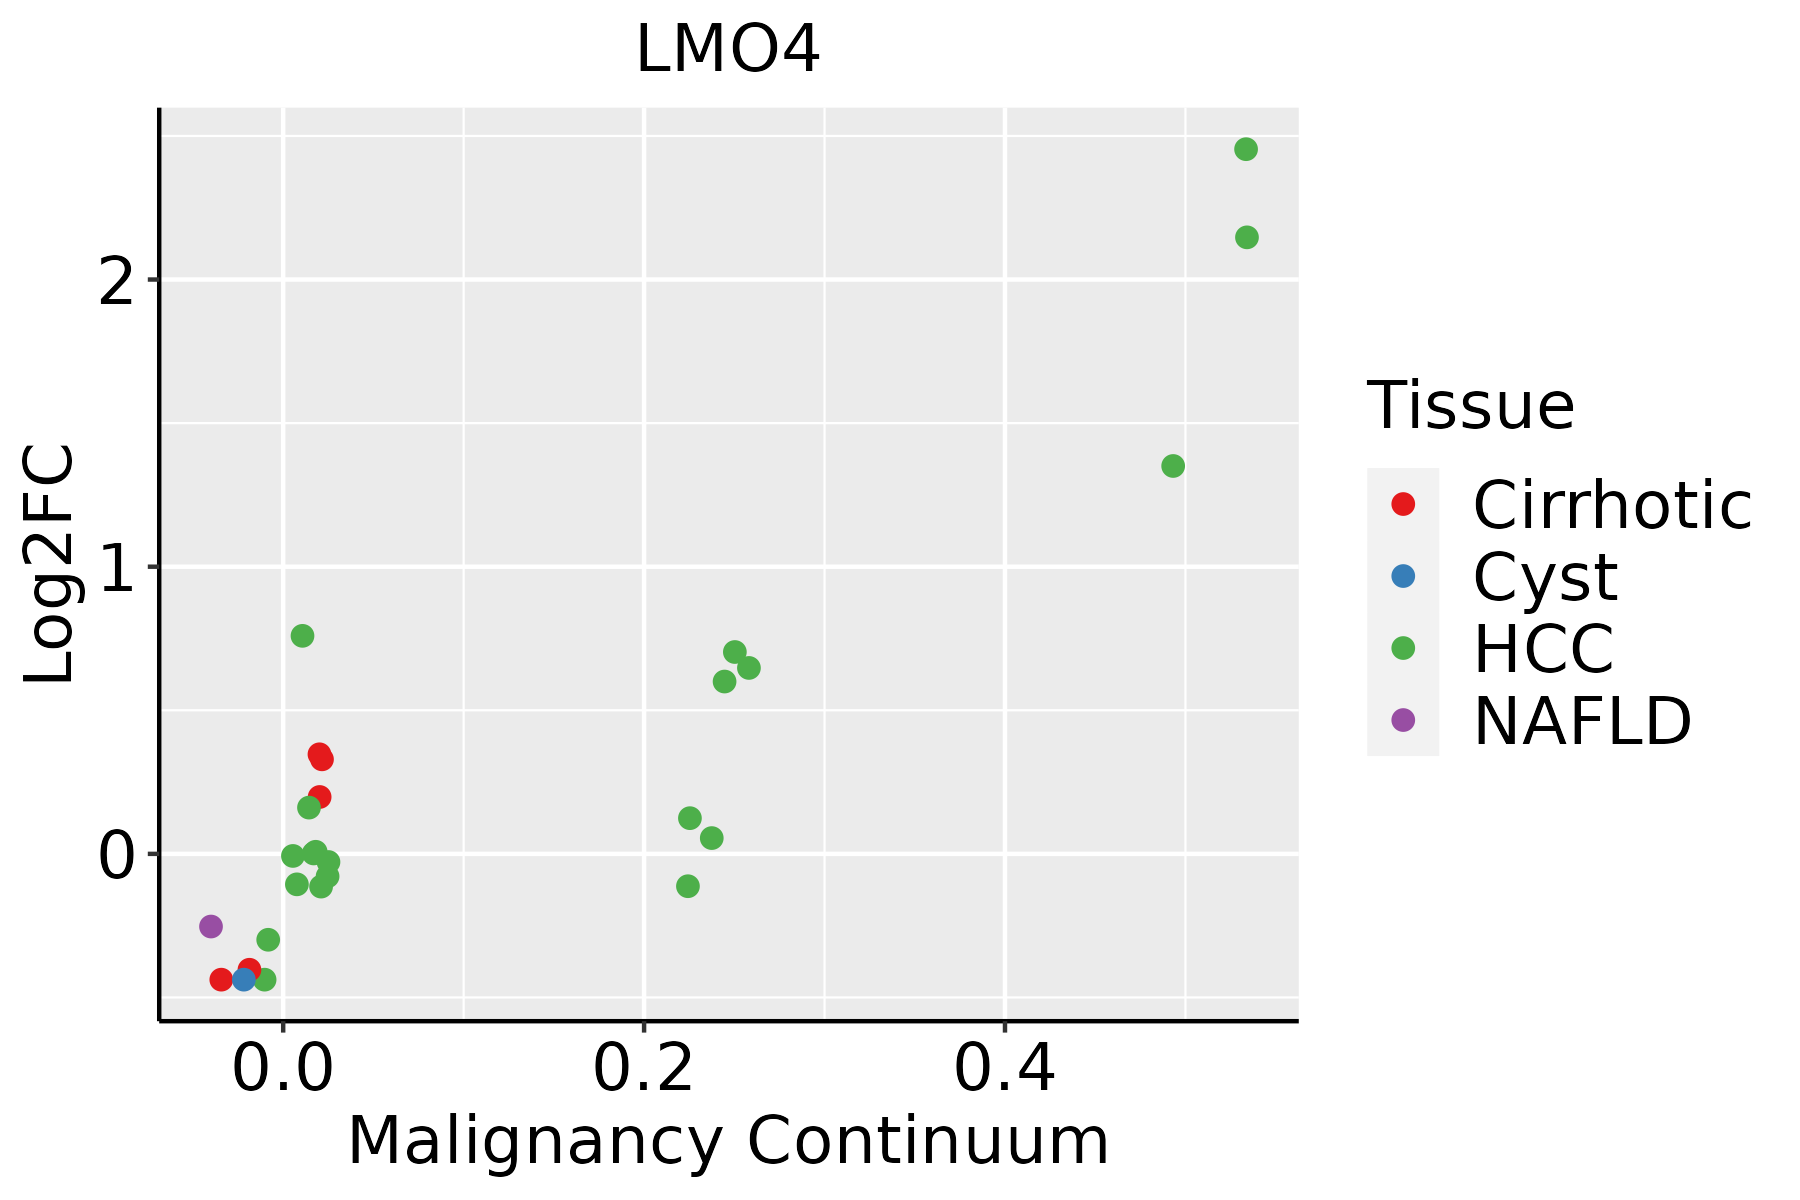 | HCC: Hepatocellular carcinoma |
| NAFLD: Non-alcoholic fatty liver disease | ||
| Oral Cavity |  | EOLP: Erosive Oral lichen planus |
| LP: leukoplakia | ||
| NEOLP: Non-erosive oral lichen planus | ||
| OSCC: Oral squamous cell carcinoma | ||
| Prostate |  | BPH: Benign Prostatic Hyperplasia |
| Skin | 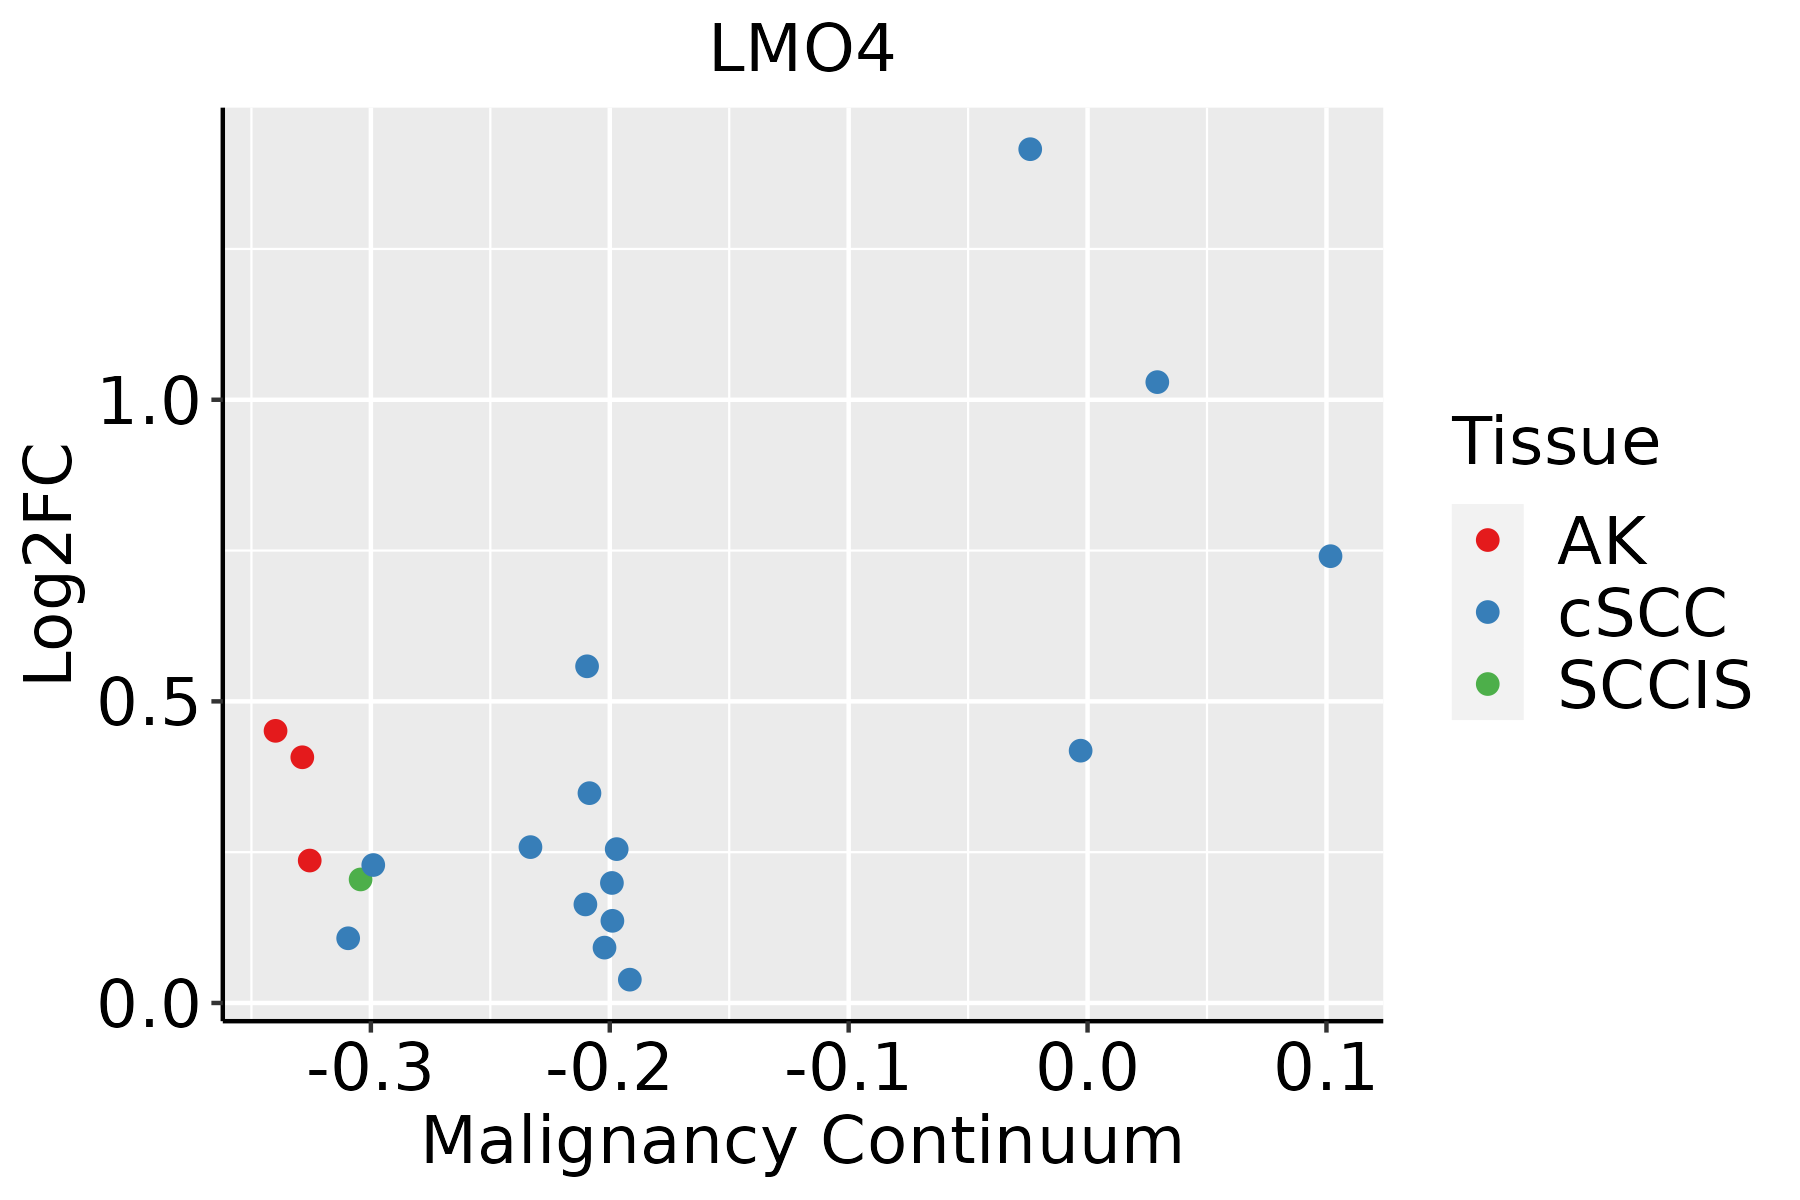 | AK: Actinic keratosis |
| cSCC: Cutaneous squamous cell carcinoma | ||
| SCCIS:squamous cell carcinoma in situ | ||
| Thyroid |  | ATC: Anaplastic thyroid cancer |
| HT: Hashimoto's thyroiditis | ||
| PTC: Papillary thyroid cancer |
| ∗log2FC in expression of this searched gene in stem-like cells from each diseased tissue sample relative to stem-like cells in normal samples in each tissue plotted against the malignancy continuum. Samples are colored based on if they are from different disease stage. |
Top |
Malignant transformation related pathway analysis |
| Find out the enriched GO biological processes and KEGG pathways involved in transition from healthy to precancer to cancer |
| Tissue | Disease Stage | Enriched GO biological Processes |
| Colorectum | AD |  |
| Colorectum | SER |  |
| Colorectum | MSS |  |
| Colorectum | MSI-H |  |
| Colorectum | FAP |  |
| ∗Top 15 enriched GO BP terms are showed in the bar plot of each disease state in each tissue. Each row represents a significant GO biological process which is colored according to the -log10(p.adjust). |
| Page: 1 2 3 4 5 6 7 8 9 |
| GO ID | Tissue | Disease Stage | Description | Gene Ratio | Bg Ratio | pvalue | p.adjust | Count |
| GO:00432549 | Breast | Precancer | regulation of protein-containing complex assembly | 50/1080 | 428/18723 | 1.63e-06 | 5.97e-05 | 50 |
| GO:00487329 | Breast | Precancer | gland development | 49/1080 | 436/18723 | 6.11e-06 | 1.73e-04 | 49 |
| GO:00351486 | Breast | Precancer | tube formation | 19/1080 | 148/18723 | 8.79e-04 | 1.01e-02 | 19 |
| GO:0048538 | Breast | Precancer | thymus development | 9/1080 | 45/18723 | 9.22e-04 | 1.05e-02 | 9 |
| GO:00313338 | Breast | Precancer | negative regulation of protein-containing complex assembly | 18/1080 | 141/18723 | 1.27e-03 | 1.35e-02 | 18 |
| GO:00336749 | Breast | Precancer | positive regulation of kinase activity | 42/1080 | 467/18723 | 2.94e-03 | 2.54e-02 | 42 |
| GO:00018386 | Breast | Precancer | embryonic epithelial tube formation | 15/1080 | 121/18723 | 4.12e-03 | 3.24e-02 | 15 |
| GO:00605625 | Breast | Precancer | epithelial tube morphogenesis | 31/1080 | 325/18723 | 4.21e-03 | 3.31e-02 | 31 |
| GO:004873214 | Breast | IDC | gland development | 64/1434 | 436/18723 | 3.47e-07 | 1.74e-05 | 64 |
| GO:004325414 | Breast | IDC | regulation of protein-containing complex assembly | 61/1434 | 428/18723 | 1.77e-06 | 7.31e-05 | 61 |
| GO:006056212 | Breast | IDC | epithelial tube morphogenesis | 44/1434 | 325/18723 | 1.58e-04 | 2.73e-03 | 44 |
| GO:003514812 | Breast | IDC | tube formation | 23/1434 | 148/18723 | 8.79e-04 | 1.02e-02 | 23 |
| GO:003133313 | Breast | IDC | negative regulation of protein-containing complex assembly | 22/1434 | 141/18723 | 1.07e-03 | 1.17e-02 | 22 |
| GO:00485381 | Breast | IDC | thymus development | 10/1434 | 45/18723 | 1.80e-03 | 1.74e-02 | 10 |
| GO:000183812 | Breast | IDC | embryonic epithelial tube formation | 19/1434 | 121/18723 | 2.10e-03 | 1.97e-02 | 19 |
| GO:00721756 | Breast | IDC | epithelial tube formation | 19/1434 | 132/18723 | 5.63e-03 | 4.08e-02 | 19 |
| GO:004325424 | Breast | DCIS | regulation of protein-containing complex assembly | 61/1390 | 428/18723 | 6.32e-07 | 2.71e-05 | 61 |
| GO:004873223 | Breast | DCIS | gland development | 60/1390 | 436/18723 | 2.50e-06 | 8.74e-05 | 60 |
| GO:006056221 | Breast | DCIS | epithelial tube morphogenesis | 41/1390 | 325/18723 | 5.98e-04 | 7.60e-03 | 41 |
| GO:003133322 | Breast | DCIS | negative regulation of protein-containing complex assembly | 22/1390 | 141/18723 | 7.08e-04 | 8.51e-03 | 22 |
| Page: 1 2 3 4 5 6 7 8 9 10 11 12 13 |
| Pathway ID | Tissue | Disease Stage | Description | Gene Ratio | Bg Ratio | pvalue | p.adjust | qvalue | Count |
| Page: 1 |
Top |
Cell-cell communication analysis |
| Identification of potential cell-cell interactions between two cell types and their ligand-receptor pairs for different disease states |
| Ligand | Receptor | LRpair | Pathway | Tissue | Disease Stage |
| Page: 1 |
Top |
Single-cell gene regulatory network inference analysis |
| Find out the significant the regulons (TFs) and the target genes of each regulon across cell types for different disease states |
| TF | Cell Type | Tissue | Disease Stage | Target Gene | RSS | Regulon Activity |
| ∗The dot plots of a searched regulon are shown for all cell subpopulations in each disease state of each tissue based on the regulon specific score inferred using pySCENIC and by calculating the average expression. |
| Page: 1 |
Top |
Somatic mutation of malignant transformation related genes |
| Annotation of somatic variants for genes involved in malignant transformation |
| Hugo Symbol | Variant Class | Variant Classification | dbSNP RS | HGVSc | HGVSp | HGVSp Short | SWISSPROT | BIOTYPE | SIFT | PolyPhen | Tumor Sample Barcode | Tissue | Histology | Sex | Age | Stage | Therapy Types | Drugs | Outcome |
| LMO4 | SNV | Missense_Mutation | c.445N>T | p.His149Tyr | p.H149Y | P61968 | protein_coding | deleterious(0.01) | benign(0.284) | TCGA-B6-A0IJ-01 | Breast | breast invasive carcinoma | Female | <65 | I/II | Unknown | Unknown | SD | |
| LMO4 | SNV | Missense_Mutation | rs754509420 | c.371N>T | p.Pro124Leu | p.P124L | P61968 | protein_coding | tolerated(0.25) | probably_damaging(0.987) | TCGA-BH-A0E9-01 | Breast | breast invasive carcinoma | Female | <65 | I/II | Chemotherapy | taxotere | CR |
| LMO4 | SNV | Missense_Mutation | c.308N>T | p.Ala103Val | p.A103V | P61968 | protein_coding | tolerated(0.06) | benign(0.113) | TCGA-D5-6928-01 | Colorectum | colon adenocarcinoma | Male | >=65 | I/II | Unknown | Unknown | SD | |
| LMO4 | SNV | Missense_Mutation | rs771825798 | c.287N>T | p.Ala96Val | p.A96V | P61968 | protein_coding | deleterious(0.03) | probably_damaging(0.962) | TCGA-F4-6808-01 | Colorectum | colon adenocarcinoma | Female | <65 | I/II | Unknown | Unknown | SD |
| LMO4 | SNV | Missense_Mutation | novel | c.380N>A | p.Arg127Gln | p.R127Q | P61968 | protein_coding | deleterious(0) | probably_damaging(0.976) | TCGA-A5-A0G2-01 | Endometrium | uterine corpus endometrioid carcinoma | Female | <65 | III/IV | Unknown | Unknown | SD |
| LMO4 | SNV | Missense_Mutation | c.229T>C | p.Tyr77His | p.Y77H | P61968 | protein_coding | deleterious(0) | probably_damaging(1) | TCGA-AP-A0LE-01 | Endometrium | uterine corpus endometrioid carcinoma | Female | <65 | I/II | Unknown | Unknown | SD | |
| LMO4 | SNV | Missense_Mutation | c.379N>T | p.Arg127Trp | p.R127W | P61968 | protein_coding | deleterious(0) | probably_damaging(0.999) | TCGA-AP-A0LM-01 | Endometrium | uterine corpus endometrioid carcinoma | Female | <65 | III/IV | Chemotherapy | cisplatin | SD | |
| LMO4 | SNV | Missense_Mutation | novel | c.395N>G | p.Asn132Ser | p.N132S | P61968 | protein_coding | tolerated(0.15) | benign(0.075) | TCGA-E6-A2P8-01 | Endometrium | uterine corpus endometrioid carcinoma | Female | <65 | III/IV | Unknown | Unknown | PD |
| LMO4 | SNV | Missense_Mutation | novel | c.362N>A | p.Arg121His | p.R121H | P61968 | protein_coding | deleterious(0.04) | possibly_damaging(0.667) | TCGA-EO-A3KX-01 | Endometrium | uterine corpus endometrioid carcinoma | Female | >=65 | I/II | Unknown | Unknown | SD |
| LMO4 | SNV | Missense_Mutation | novel | c.325N>T | p.His109Tyr | p.H109Y | P61968 | protein_coding | deleterious(0) | probably_damaging(0.999) | TCGA-EY-A1GU-01 | Endometrium | uterine corpus endometrioid carcinoma | Female | >=65 | I/II | Unknown | Unknown | SD |
| Page: 1 2 |
Top |
Related drugs of malignant transformation related genes |
| Identification of chemicals and drugs interact with genes involved in malignant transfromation |
| (DGIdb 4.0) |
| Entrez ID | Symbol | Category | Interaction Types | Drug Claim Name | Drug Name | PMIDs |
| Page: 1 |

Copyright 2023-Present -The University of Texas Health Science Center at Houston |